It’s that time of year when we “welcome” relatives into our homes for the holidays.

Traveling this week?

How about shopping on Black Friday to save $50 on a flat-screen TV? I’ll pass.

Actually, today’s note is going to focus on relative strength. RSI’s on the major indexes which are divergent from price action and the major US sector ETFs vs SPY and vs their equal-weight ETF. I highly recommend looking at this section. Let me know how you like it as I might do it more.
We hope you and your family have a happy Thanksgiving and thank you for all your continued support. We will be taking time off and returning Sunday for the Week Ahead, Commodity, and Currency weekly notes.
Next Tuesday we are doing a webinar with Tracy Shuchart our Energy and Materials Sector Notes analyst on what is happening with the energy markets. Next Tuesday at 11 am ET
trade ideas
No changes for today.
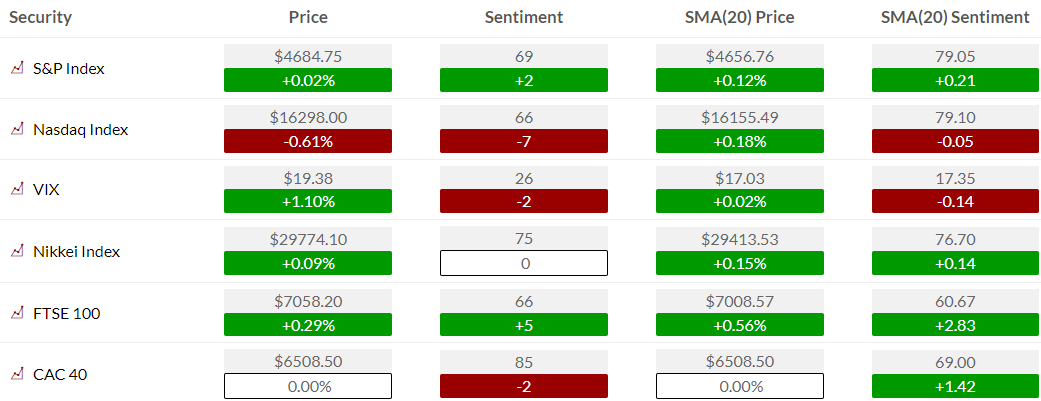
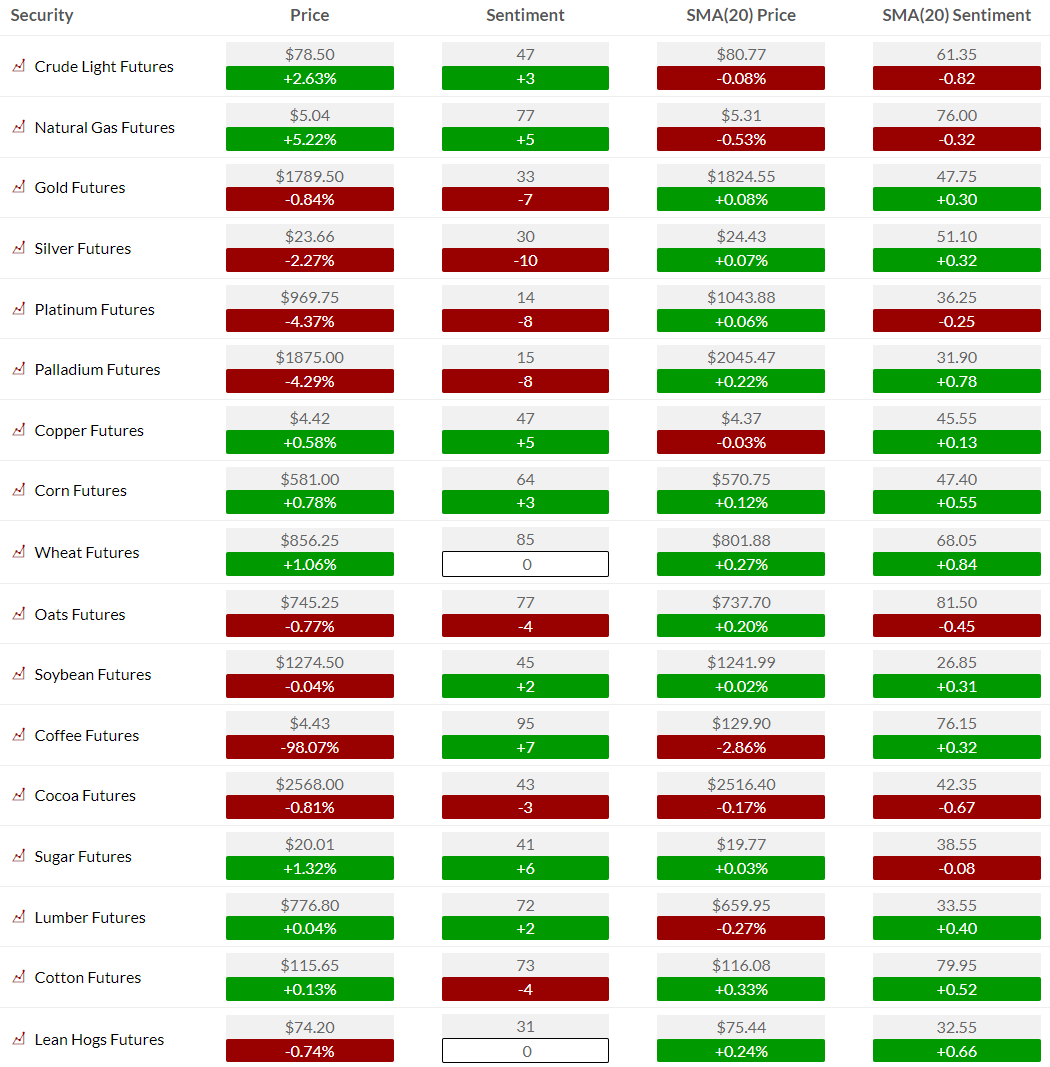
US MARKET SENTIMENT
The S&P bullish sentiment might be making a lower high vs the index price – a possible negative divergence
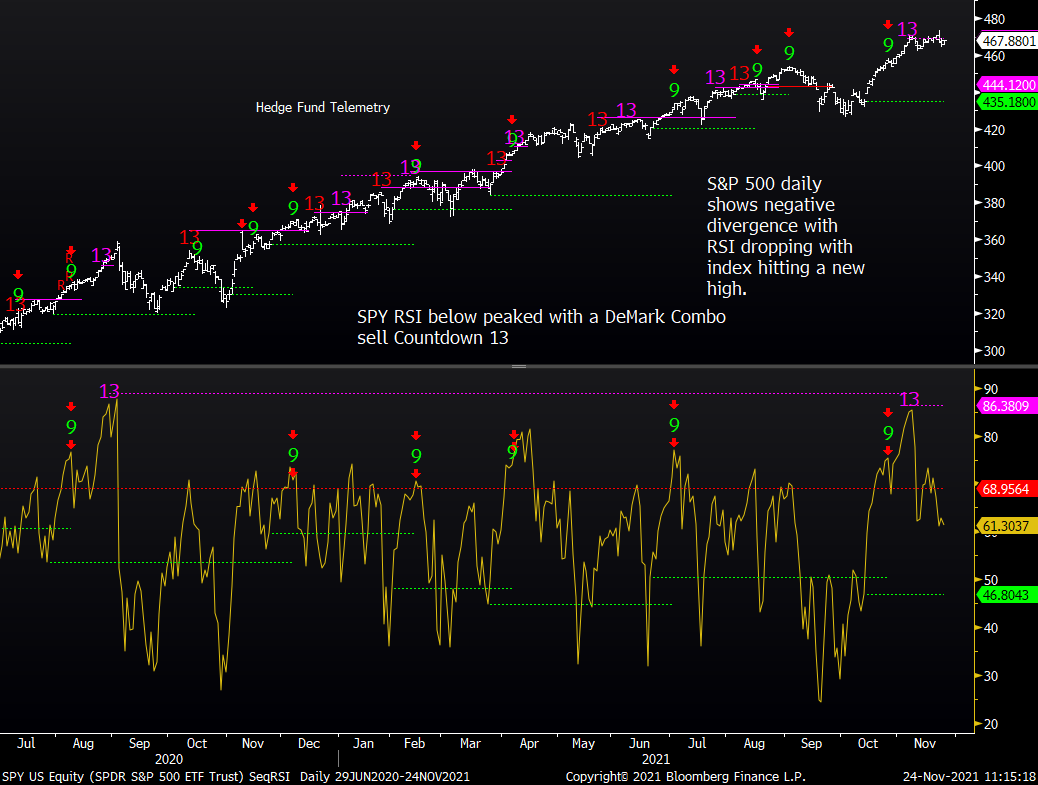
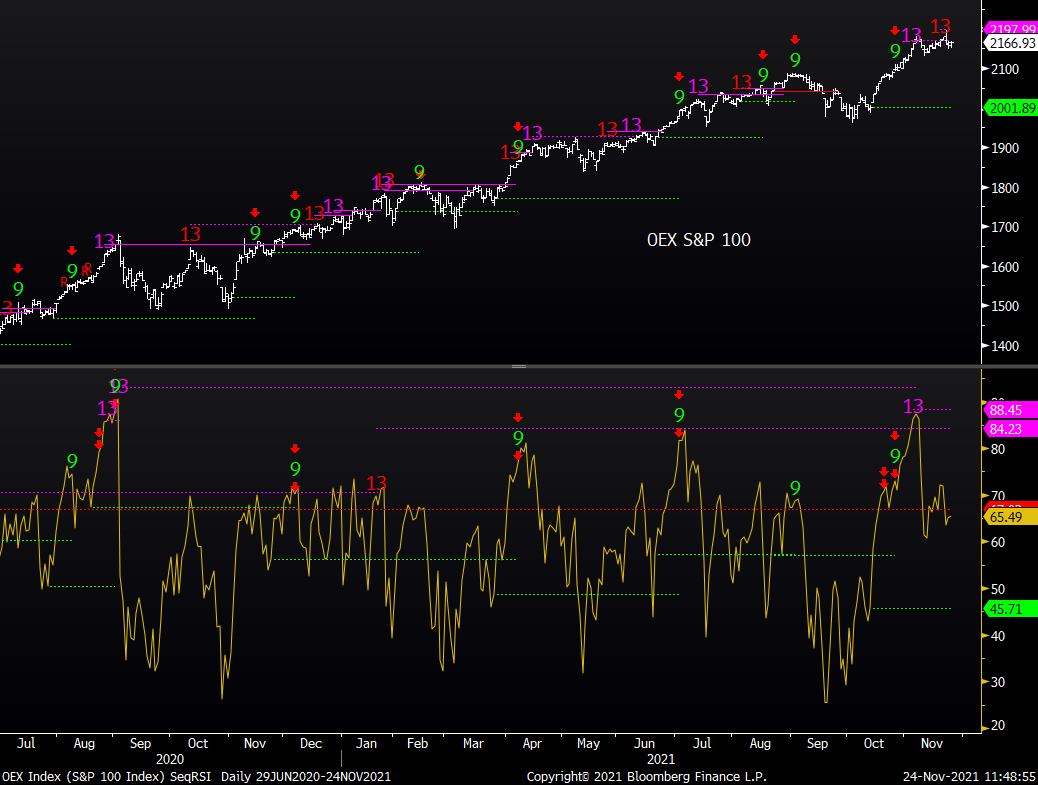
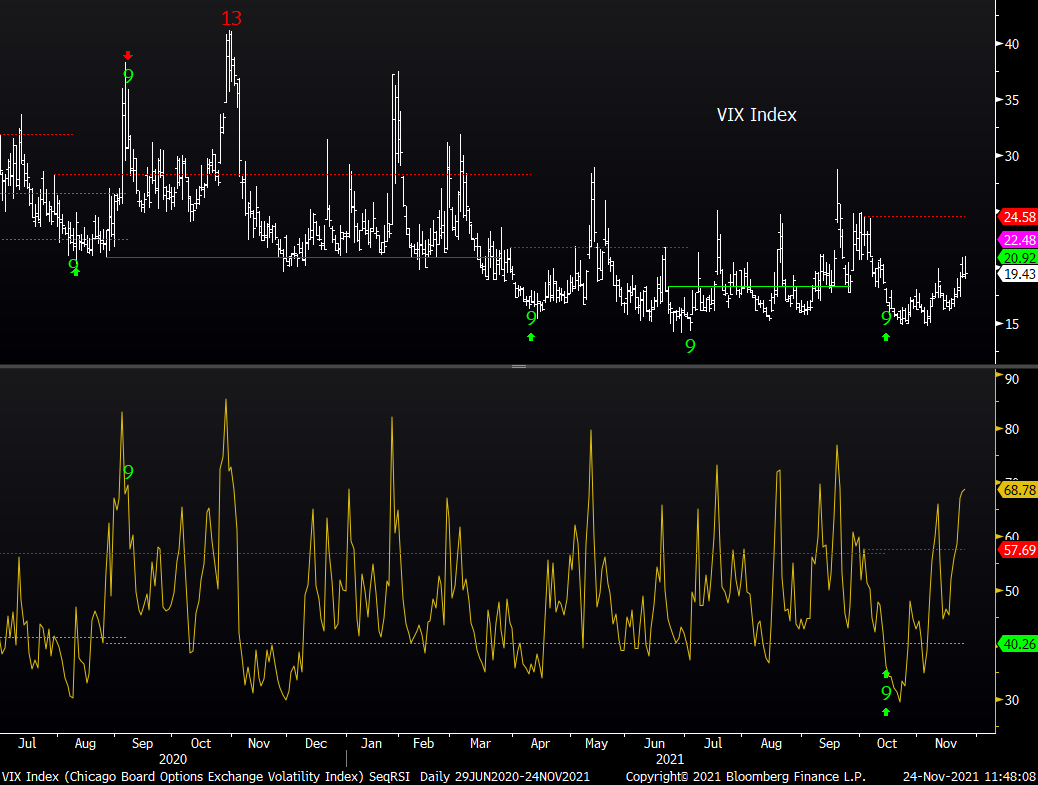
US MARKETS with RSI divergences
S&P daily with the DeMark Combo 13 in play on the index and on the RSI peak level too. It’s incredible how far RSI has dropped while the index is within a couple of percent from the all-time high. I use the 9 day RSI.
S&P 100 with the Sequential sell Countdown 13 and Combo 13 in play while the RSI also had a Combo 13 at the recent very extended high.
The VIX was left pending on day 12 of 13 with the Sequential. To complete a Countdown bar thirteen much be greater/less than or equal to the close of the 8th bar and the normal pattern of the thirteenth bar must be greater/less than or equal to the high/low of two earlier bars. RSI is divergent here too but just in the opposite direction.
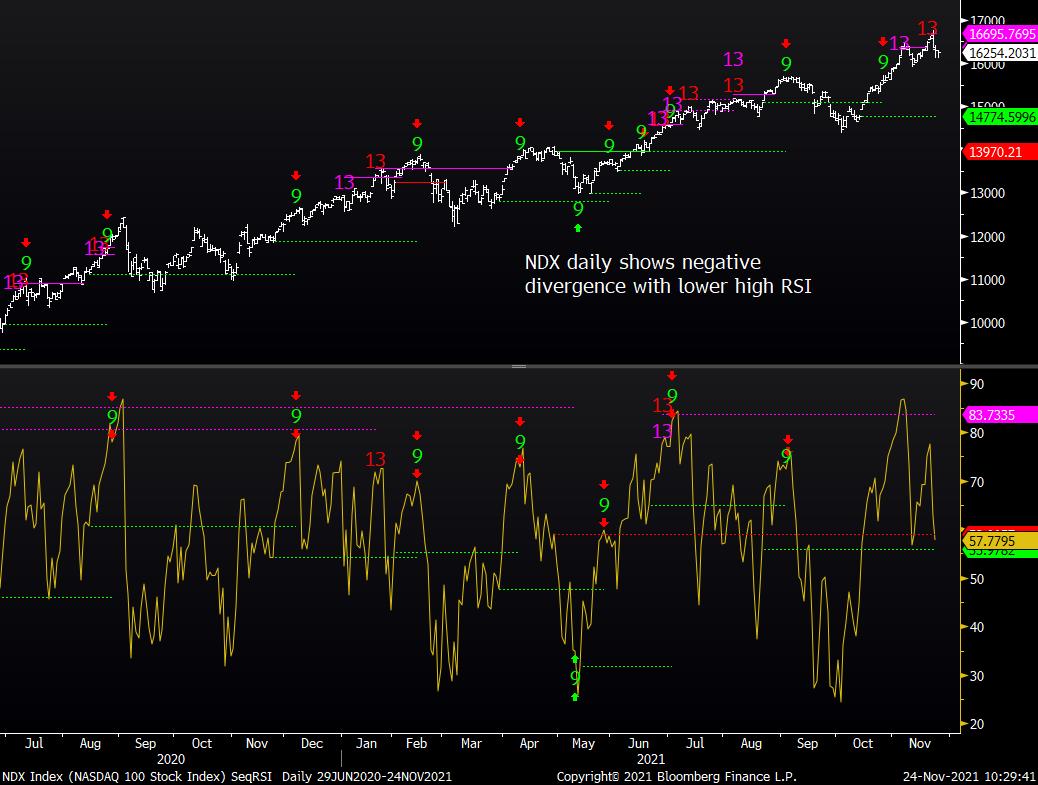
NDX daily did get the Sequential and Combo sell Countdown 13’s on the indexes. RSI was nearly at 90% and one of the highest levels in years. A very clear negative divergence
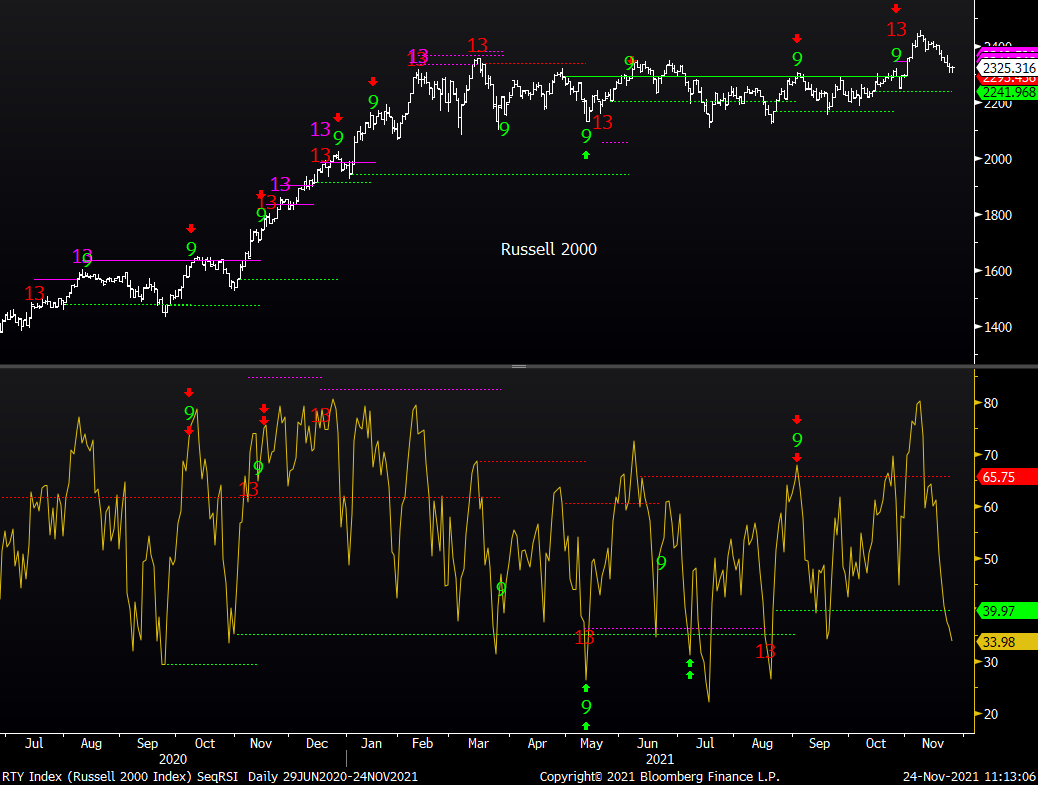
Russell 2000 IWM daily has been in this range for nearly all year. There was a Sequential sell Countdown a little early as there was some residual momentum left which has now reversed. RSI was over 80 and very overbought reversing nearly to oversold levels.
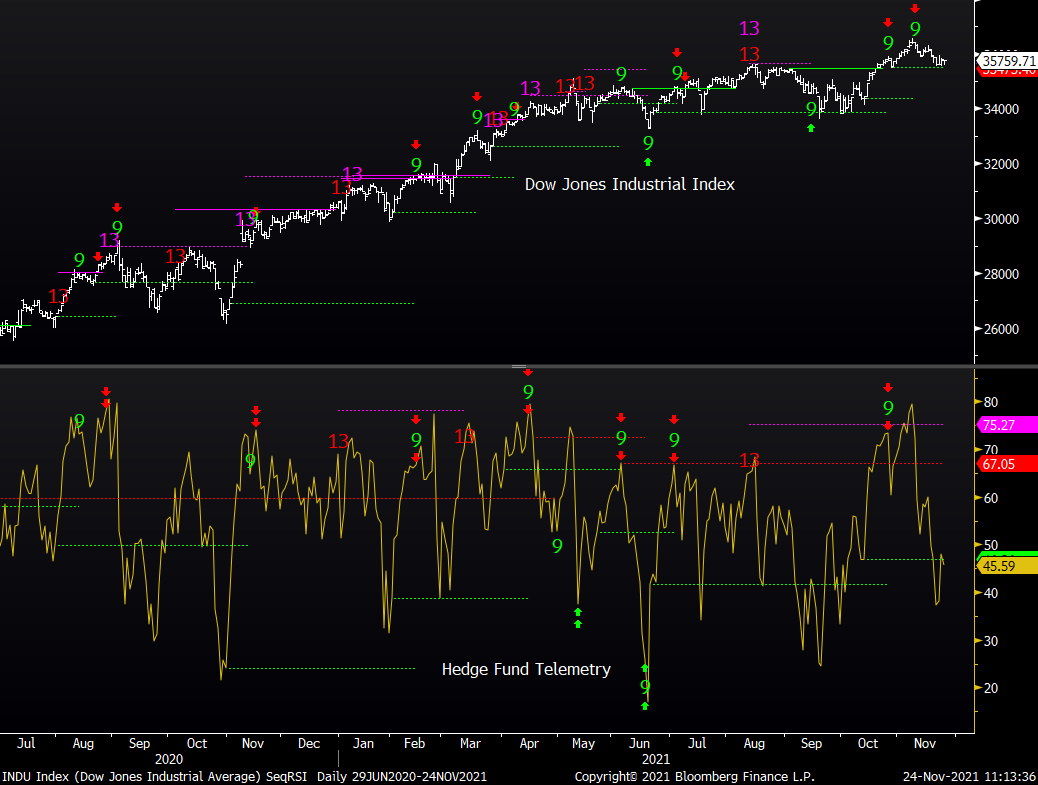
Dow Jones Industrial Average also has seen the RSI drop severely with little complementary price action.
Sector etf – relative strength focus
consumer discretionary
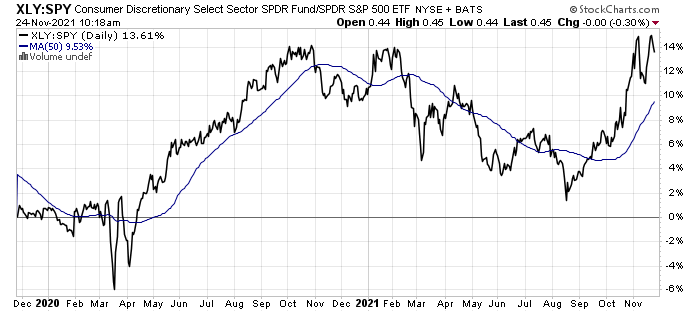
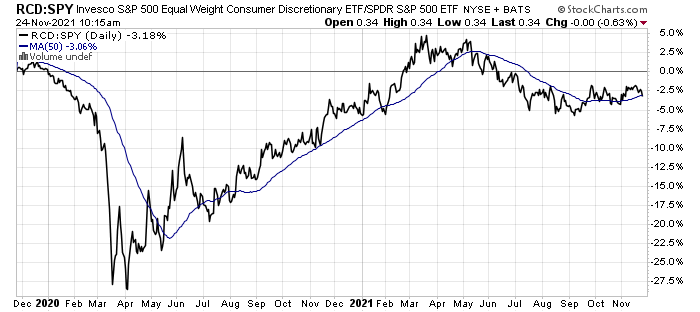
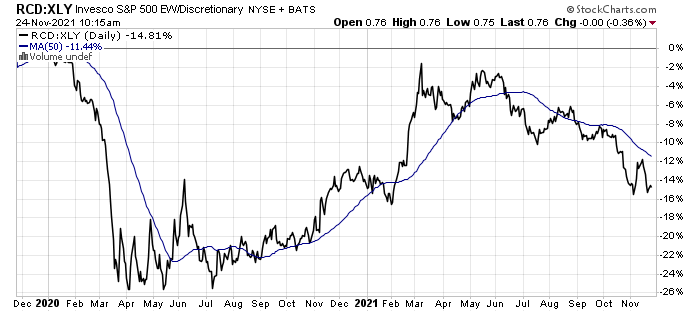
XLY Consumer Discretionary
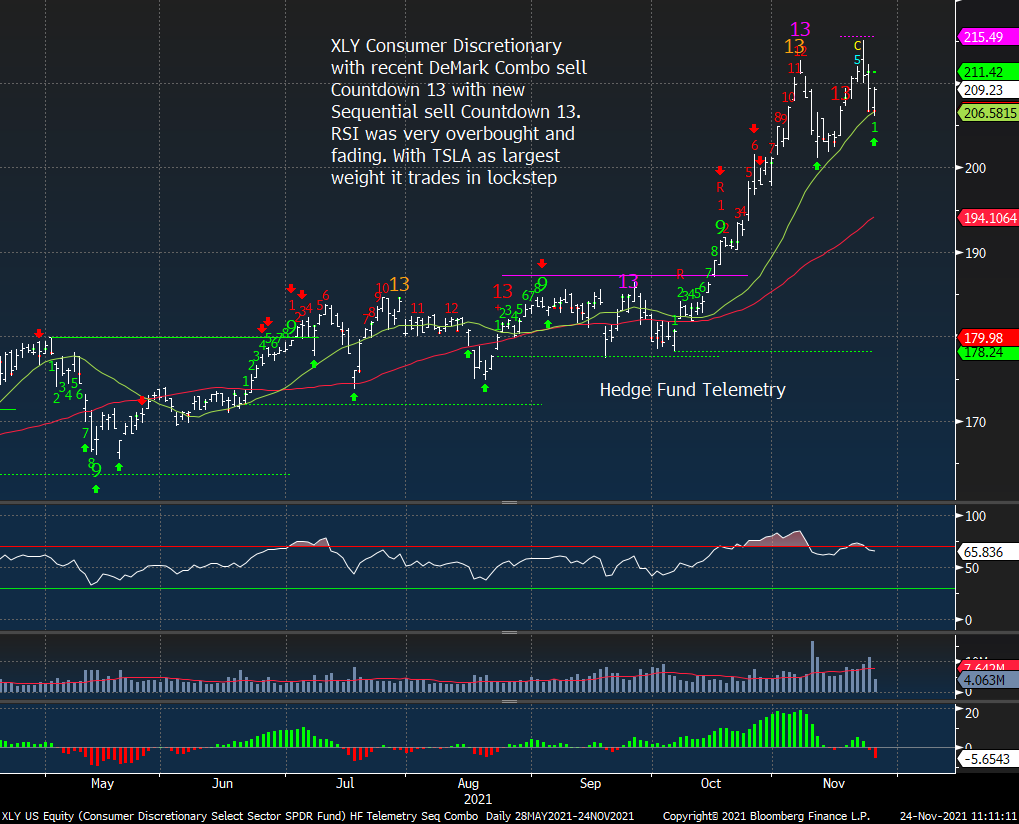
XLY VS SPY has outperformed thanks to TSLA, HD, and AMZN and did make a new high
Equal weight RCD vs SPY has underperformed.
Equal weight RCD vs XLY illustrates how the majority of stocks have underperformed
technology
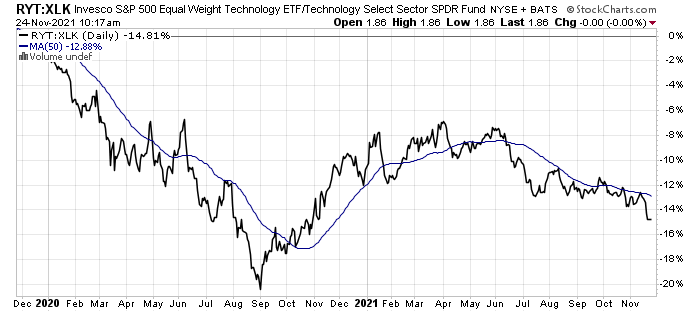
XLK Technology
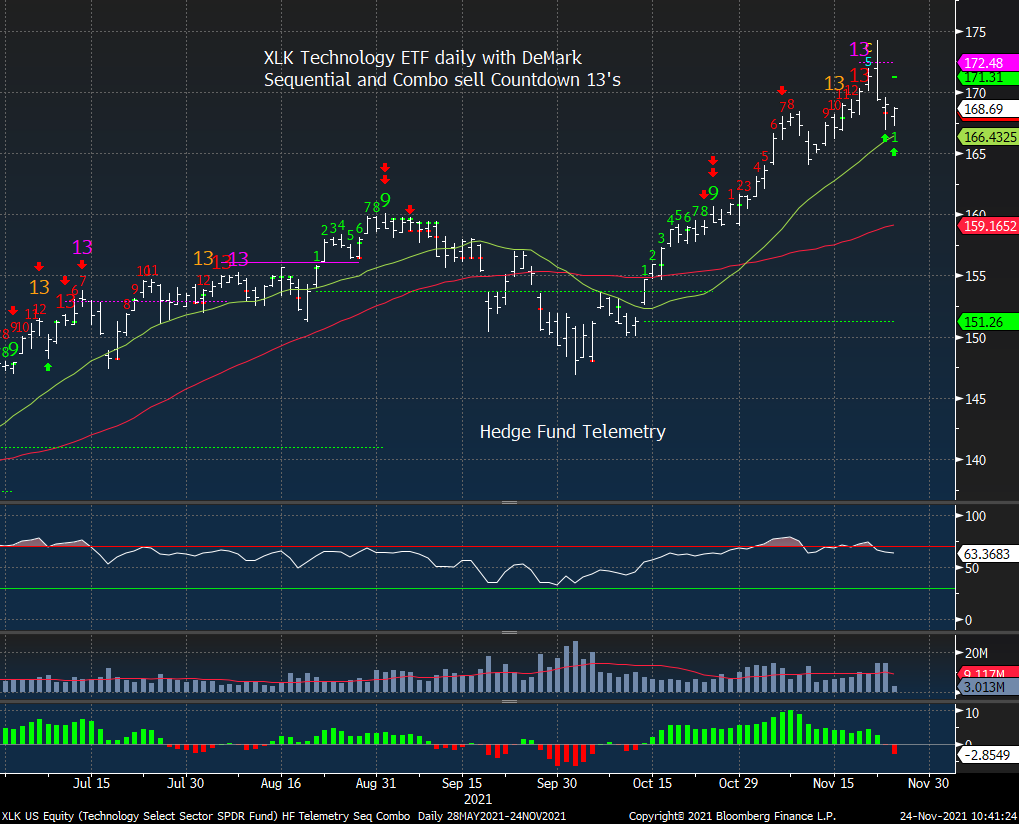
XLK vs SPY shows strong relative outperformance making a new high
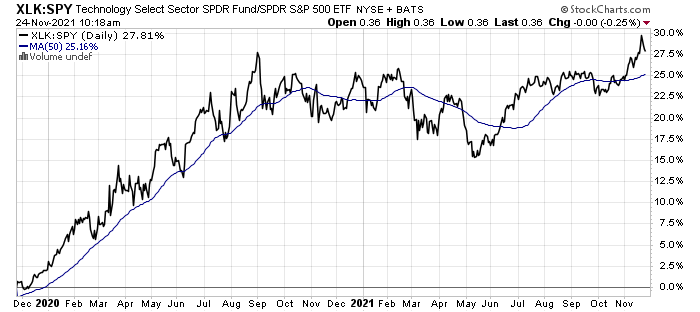
Equal weight RYT vs SPY has done well this year however it peaked relatively early in the year.
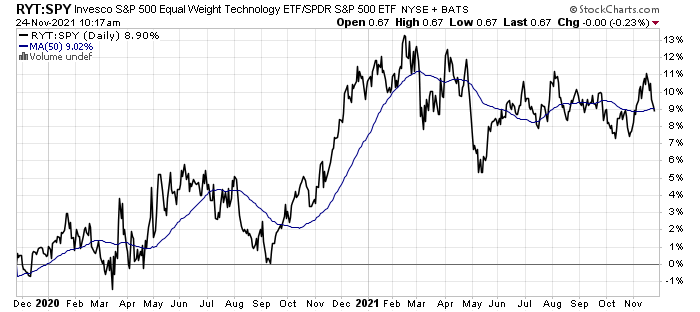
Equal weight RYT vs XLK has underperformed and is making a new relative low
energy
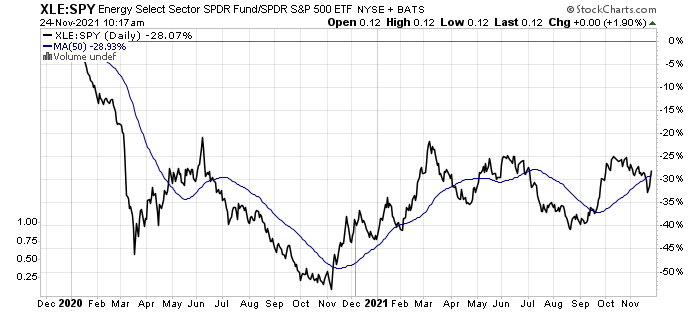
XLE Energy
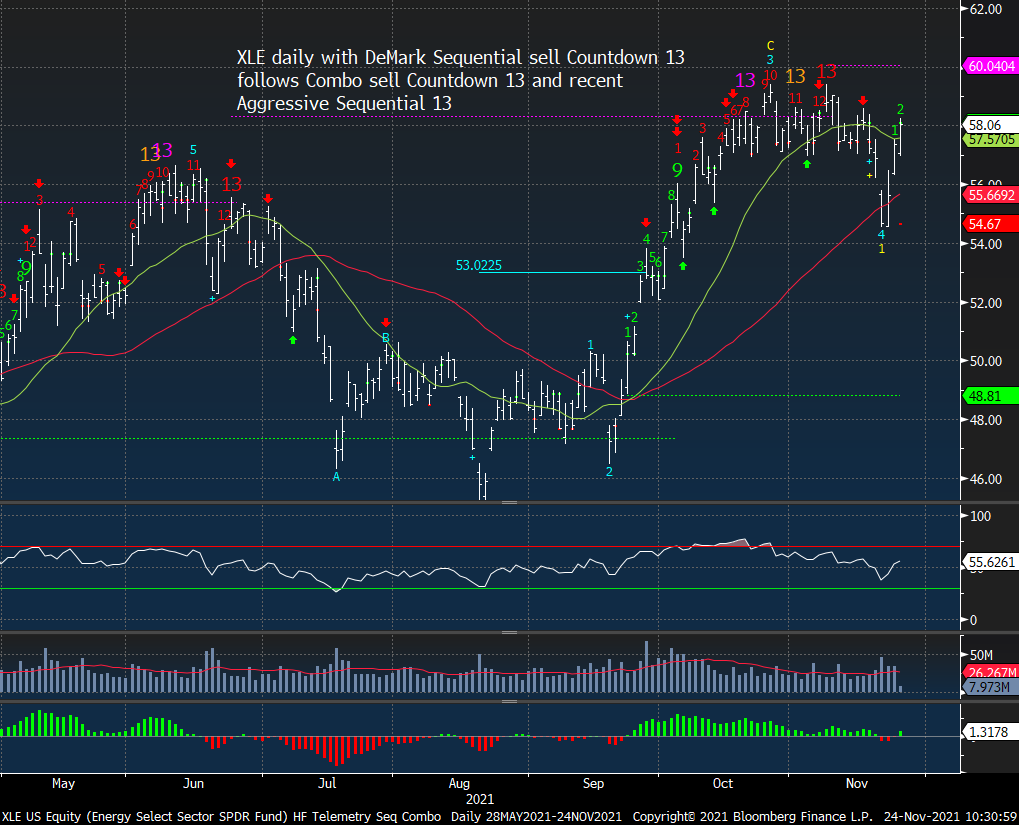
XLE vs SPY has had a good year relatively after some very very negative years. I’m thinking this ratio could breakout.
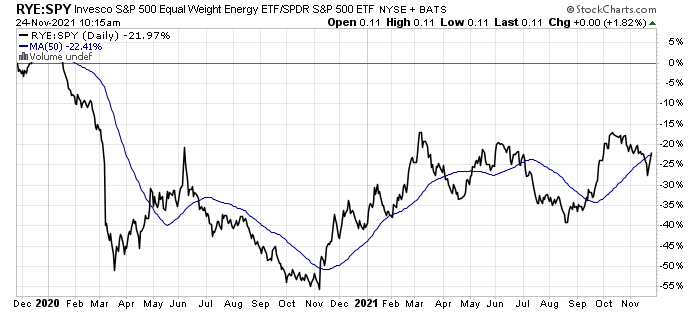
Equal weight RYE vs SPY looks similar to the XLE illustrating strong breath within the sector
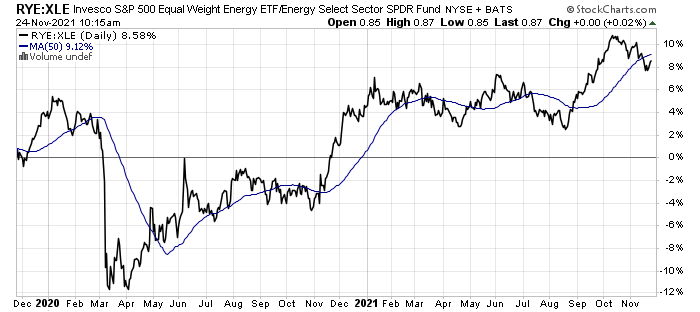
RYE vs XLE shows how the average stock in the sector has outperformed the larger market caps
financials
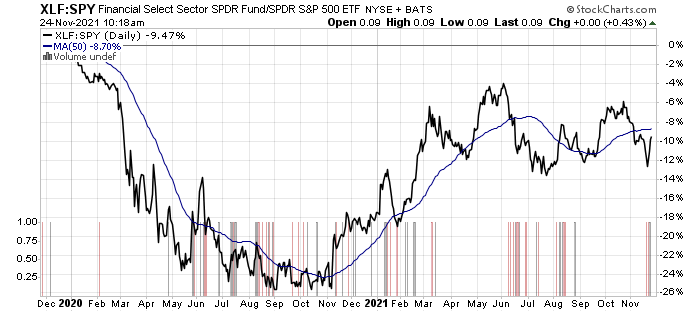
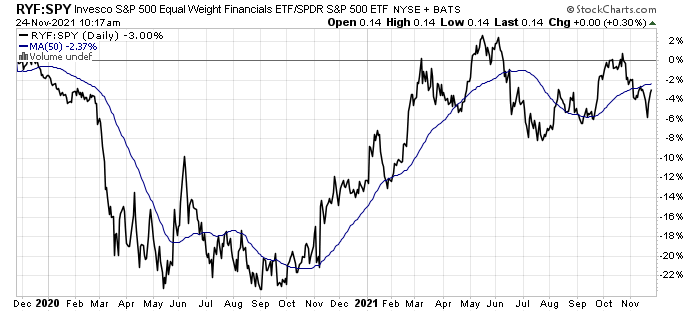
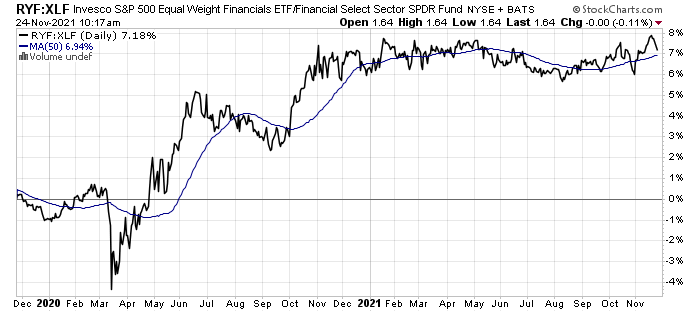
XLF Financials
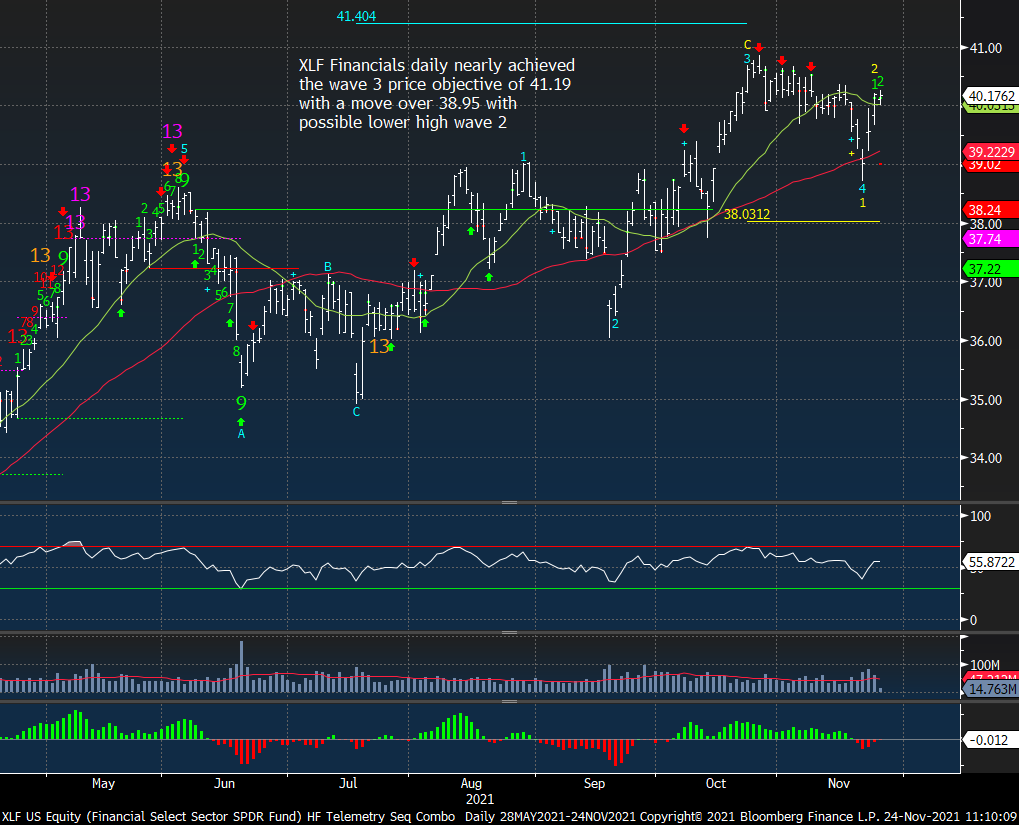
XLF vs SPY had a strong relative start to the year but peaked relatively in May. It’s holding support and this is why I like the sector once we get some stability or a little lower level.
Equal weight RYF vs SPY looks similar to XLF
RYF vs XLF made a slight new high after correlating with each other.
industrials
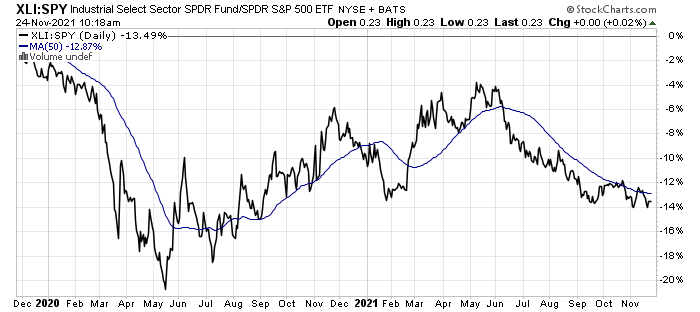
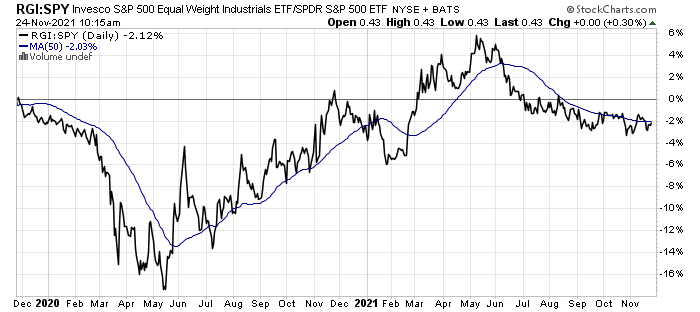
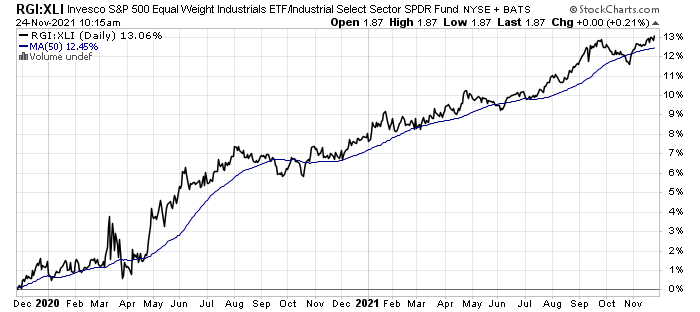
XLI Industrials
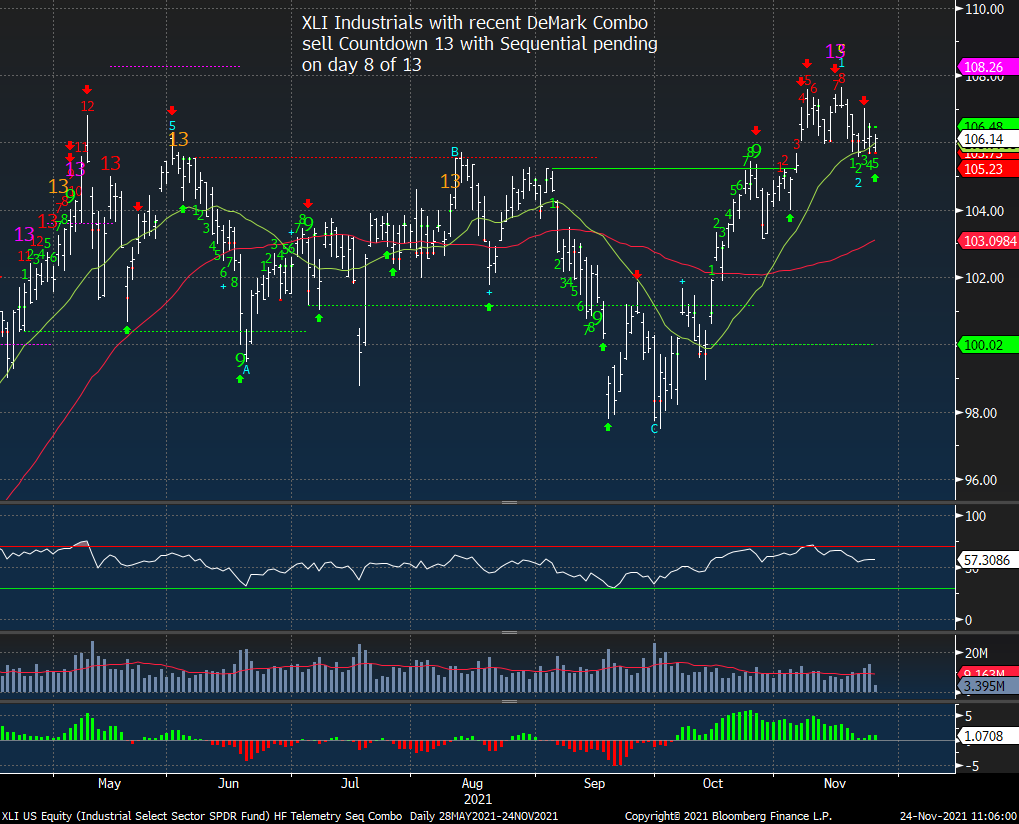
XLI vs SPY peaked in May and has been underperforming making a recent relative low
Equal weight RGI vs SPY looks similar to the above chart
RGI vs XLI however shows equal weight with steady outperformance. The large weights have been a drag on the sector ETF XLI
materials
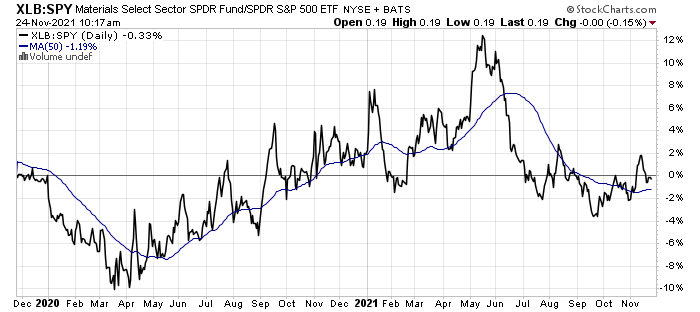
XLB Materials
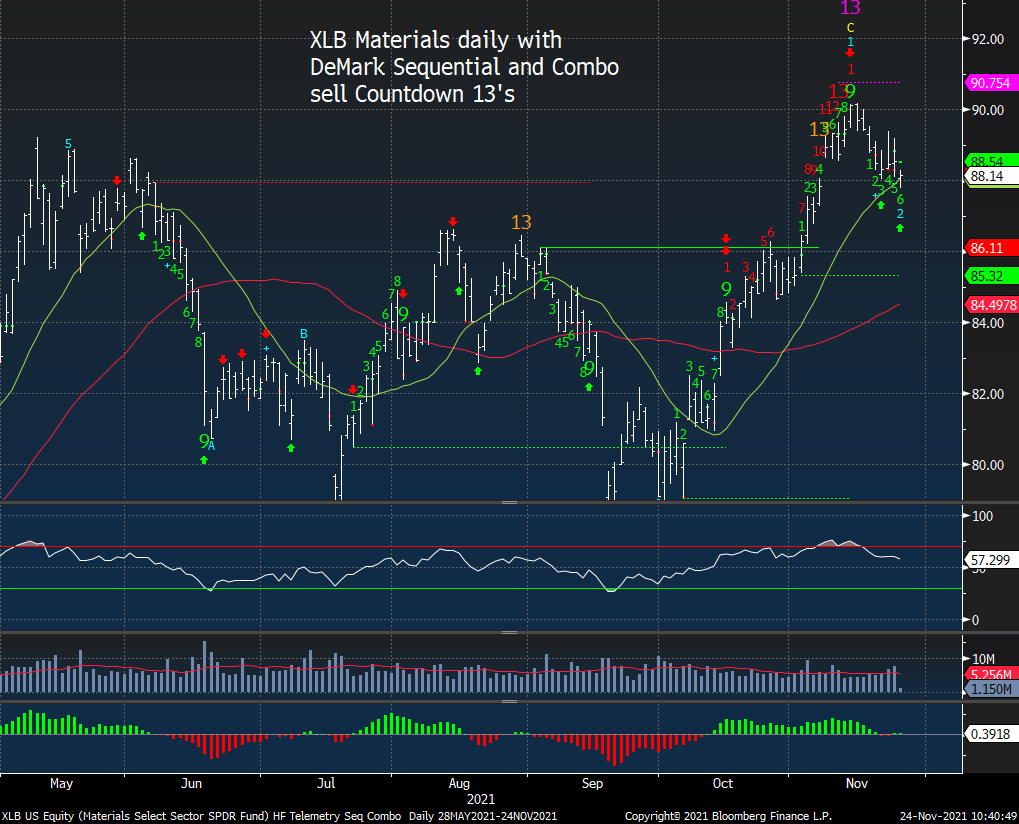
XLB vs SPY was outperforming in a big way by May but has given back all of the relative gains.
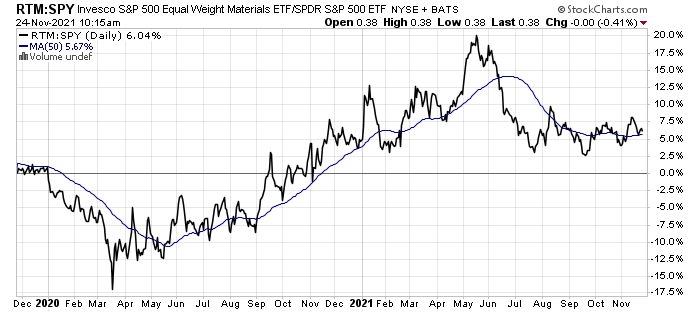
Equal weight RTM vs SPY was outperforming even more than XLB and has held up a little better
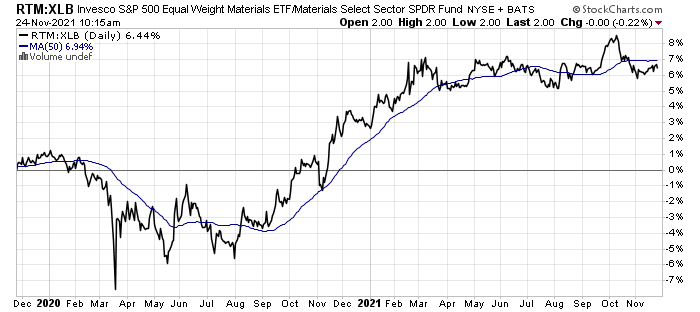
RTM vs XLB confirms the last statement
consumer staples
XLB Consumer Staples
XLP vs SPY has been in a steady decline relatively after the peak in March 2020
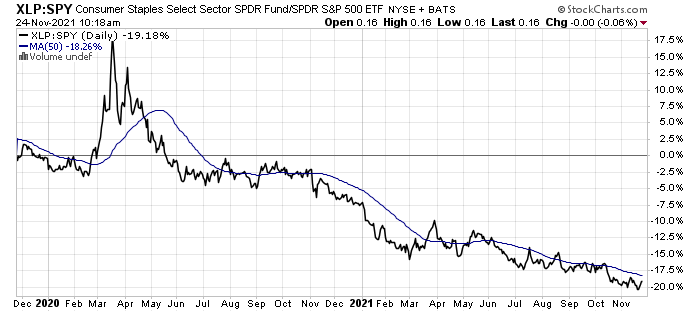
Equal weight vs SPY ditto
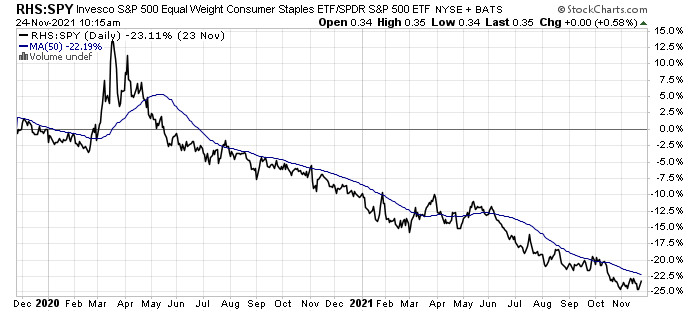
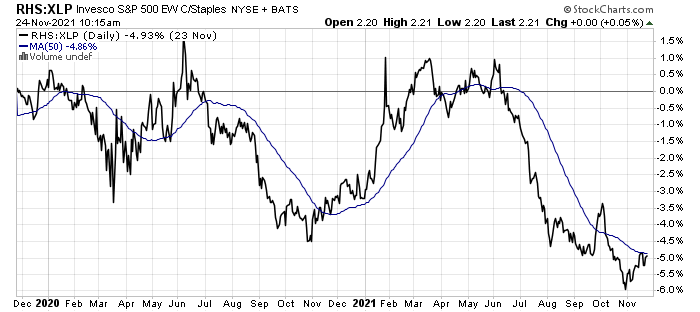
RHS vs XLP shows the majority of this sector has been very difficult in the last 6 months
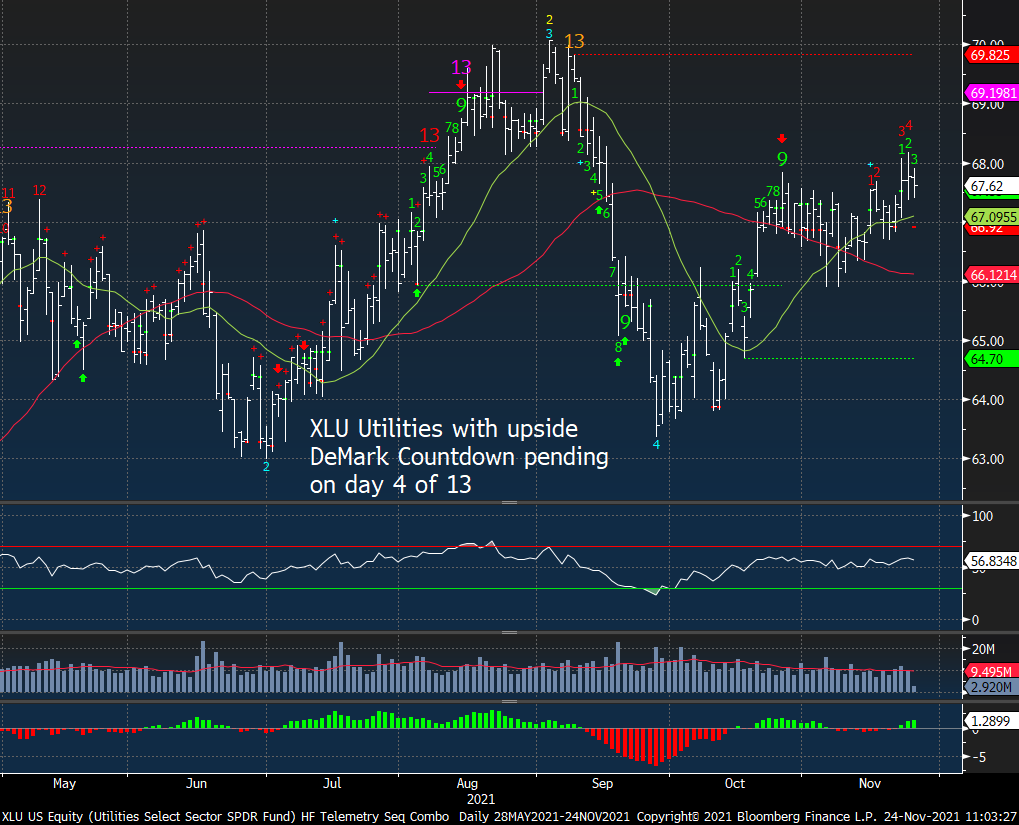
utilities
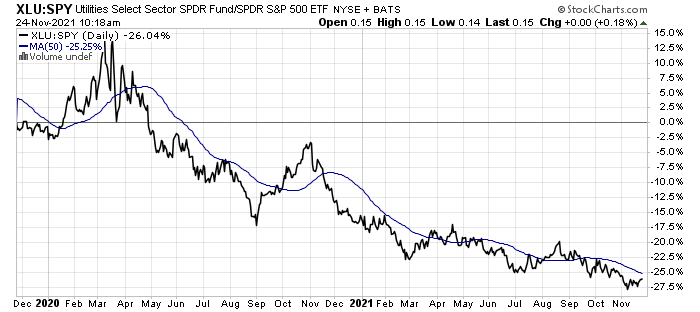
XLU Utilities – potential higher and maybe that is a big tell for future risk-off rotation
XLU vs SPY shows a steady decline after March 2020 relative high
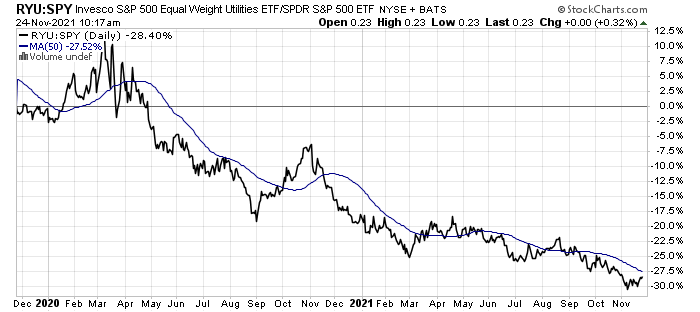
Equal weight RYU vs SPY is similar as above.
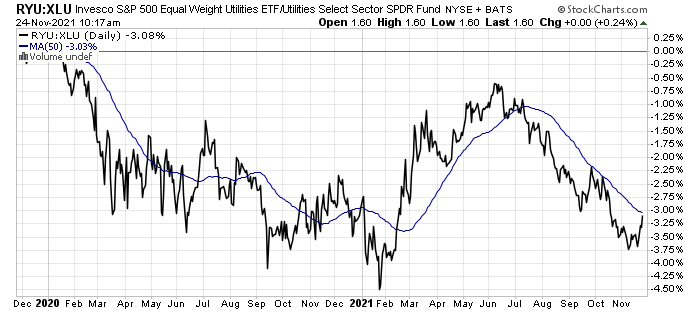
RYU vs XLU spiked early in the year and I would have to look at what stocks in the XLU got hit.
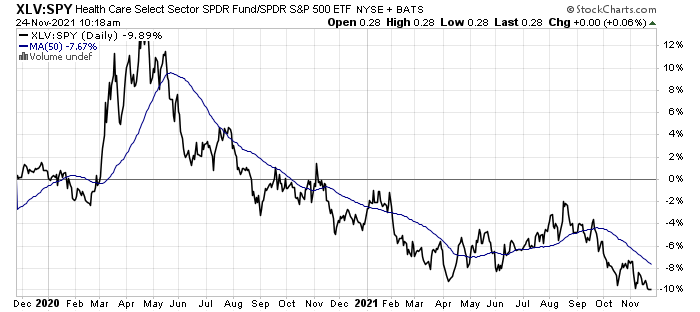
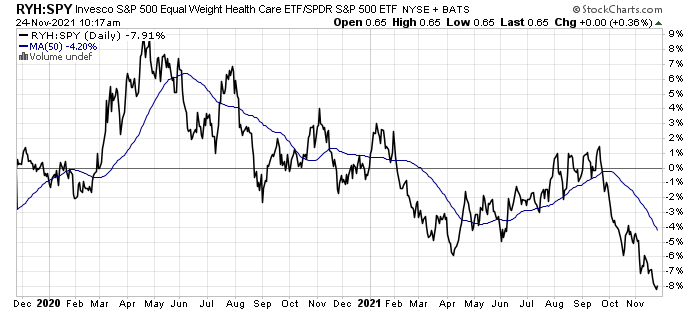
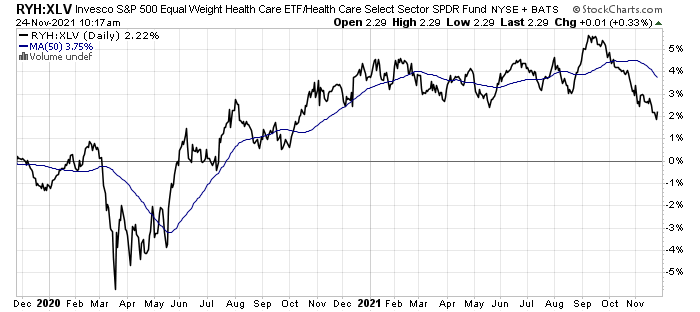
healthcare
XLV Healthcare
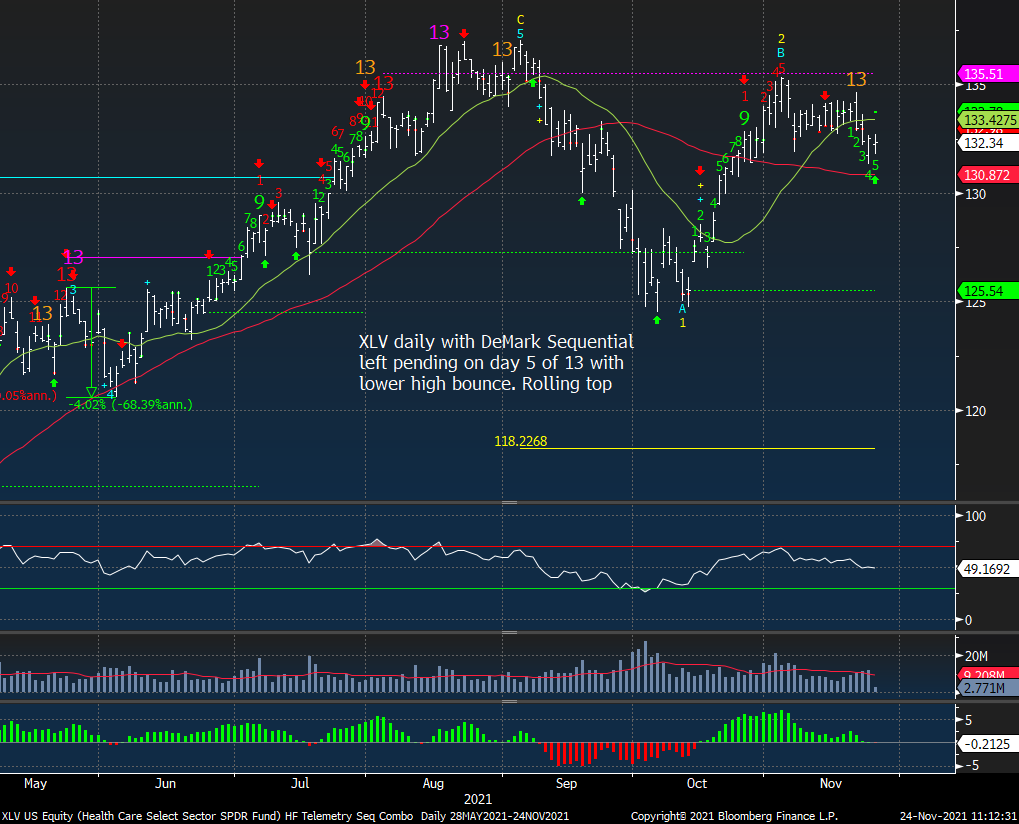
XLV vs SPY is making a relative new low after underperforming since April 2020
Equal weight RYH vs SPY shows the average healthcare stock has been very weak in the last two months
RYH vs XLV starting to go negative on the year.
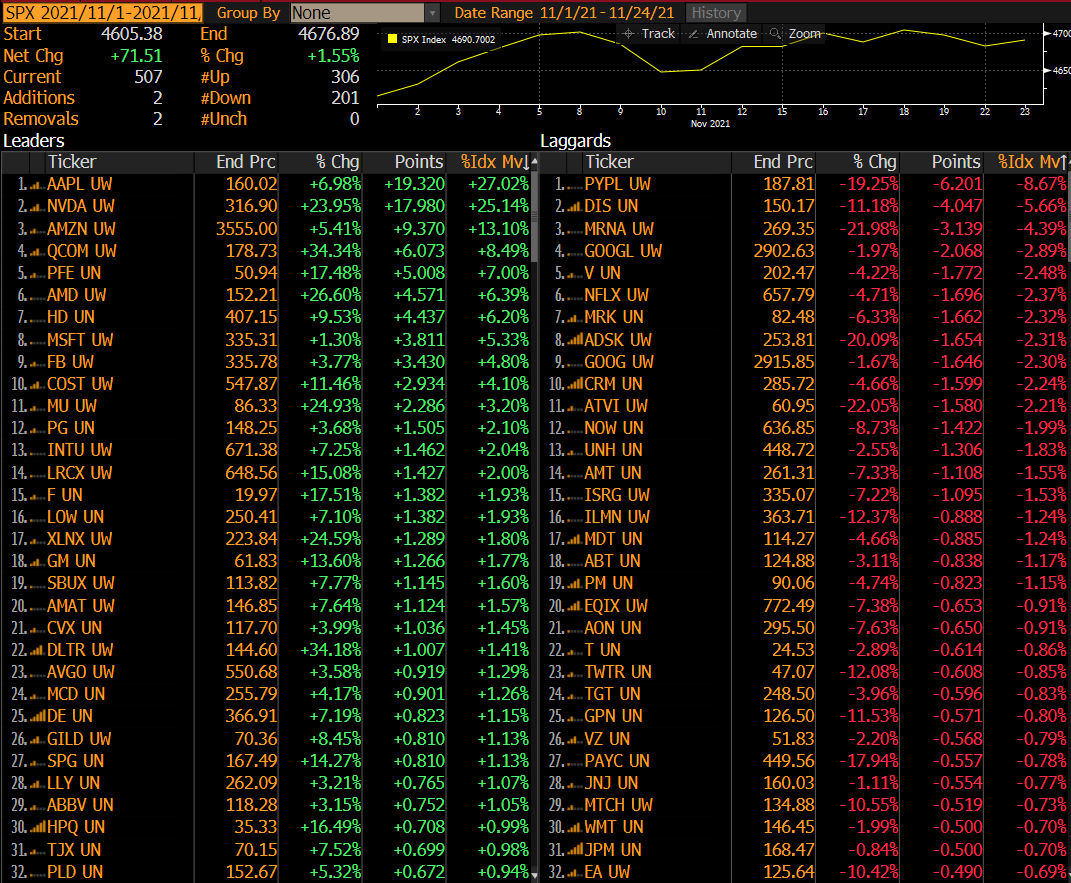
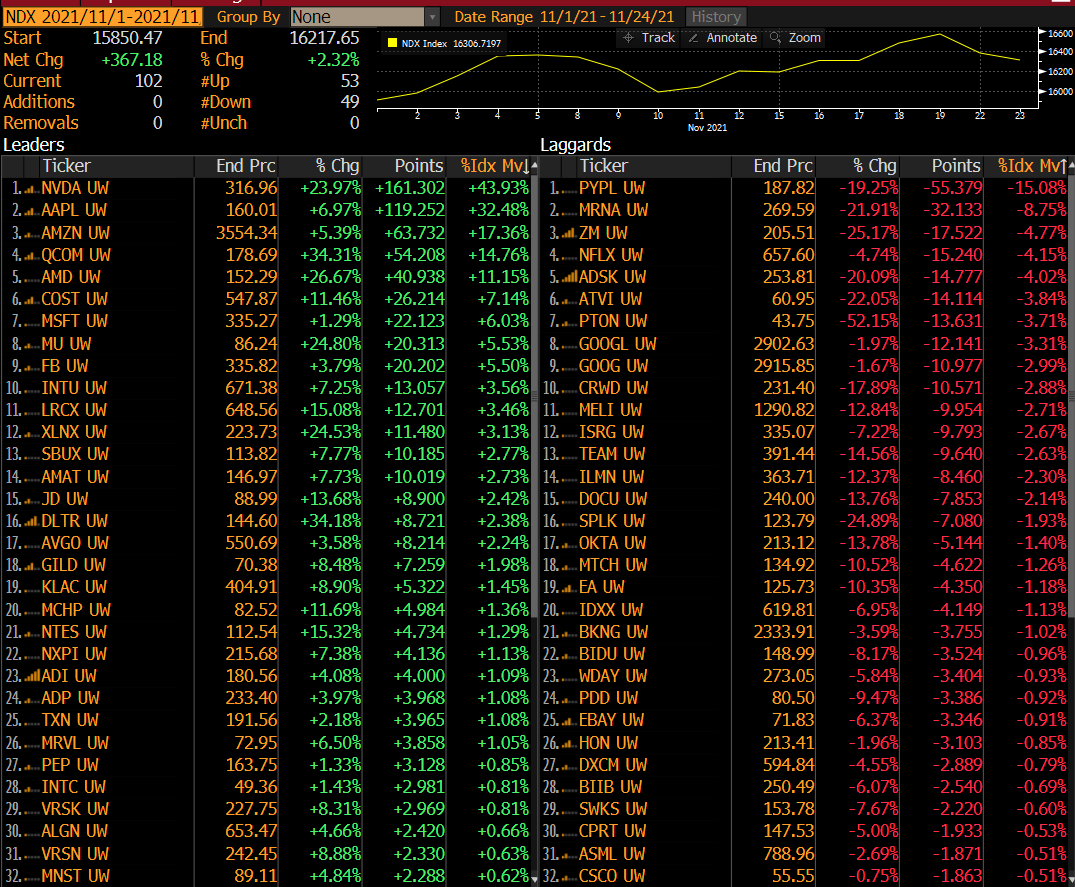
S&P and Nasdaq 100 attribution for november – interesting
S&P attribution for November shows some interesting things. Breadth has been decent 306 up and 201 down. AAPL, NVDA, AMZN, QCOM did the overwhelming heavy lifting this month. There are a lot of stocks down hard on the month too.
NDX attribution for November shows a few even more interesting things to mention. First breadth is nearly flat with 53 up and 49 down. It shows a lot of dispersion notable considering the NDX hit a new all-time high. Then it’s been narrow with NVDA, AAPL, AMZN, QCOM, AMD doing the majority of the heavy lifting.
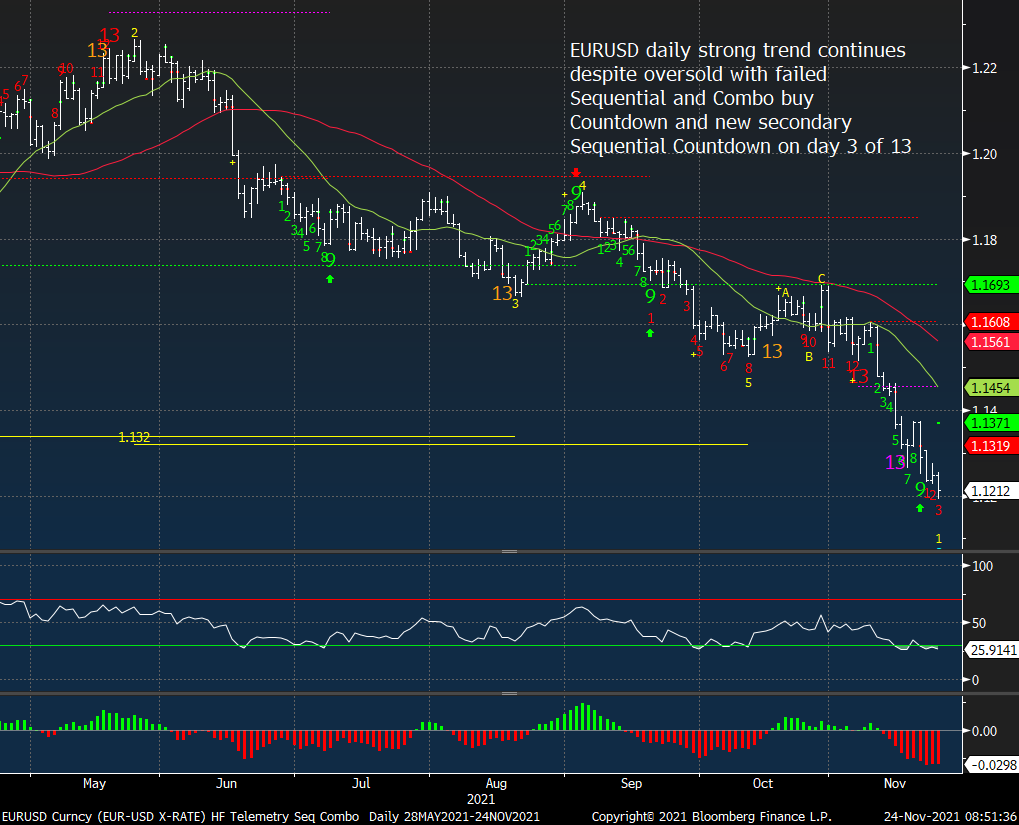
EURO/USD daily/weekly potential for continuation of trend
EURUSD daily with a strong trend that might not stop. It should but might not
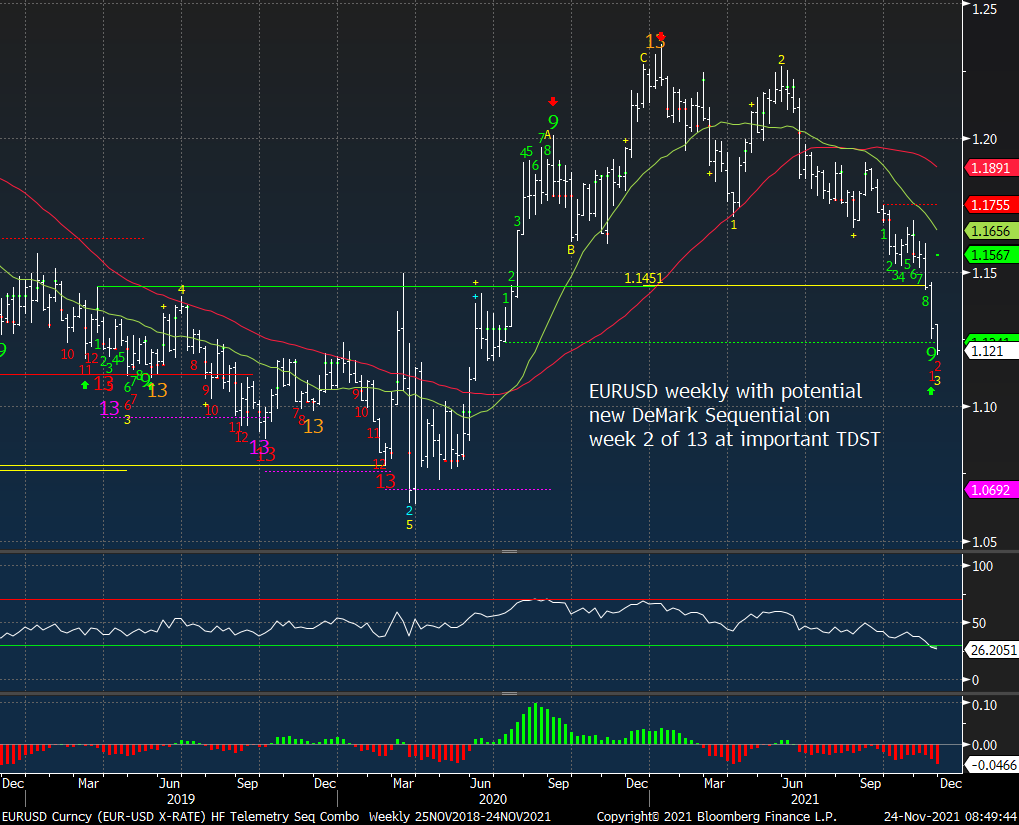
EURUSD weekly
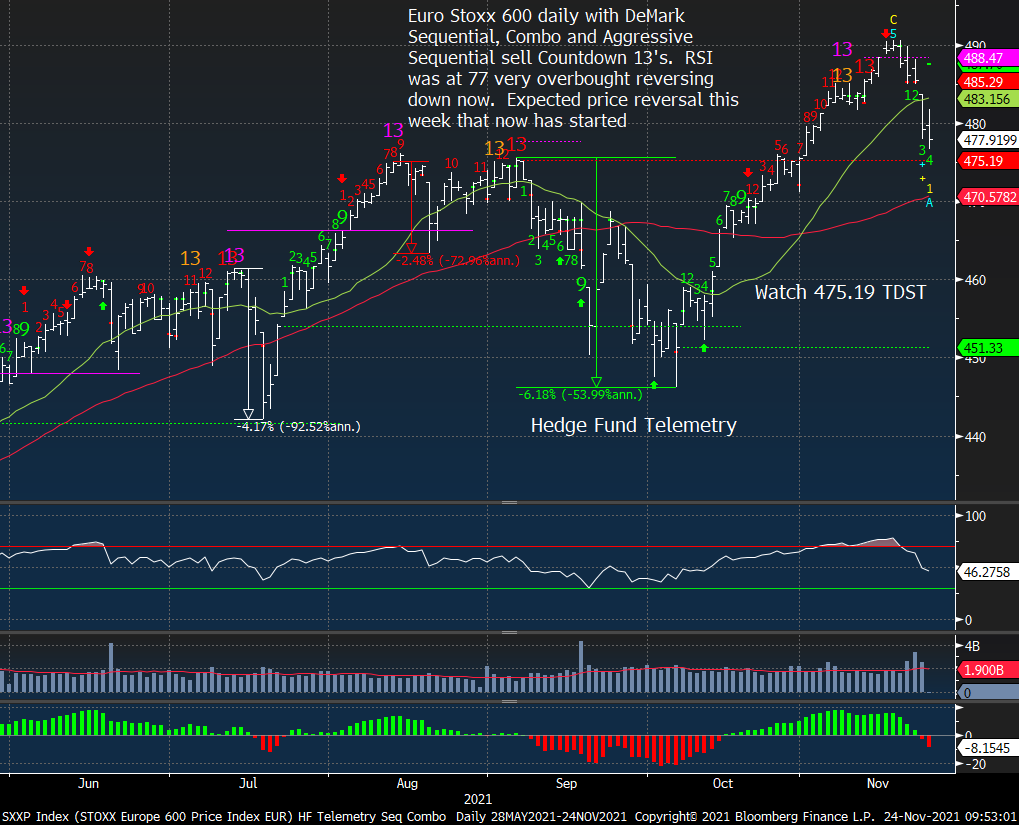
Euro Stoxx 600 – weakness
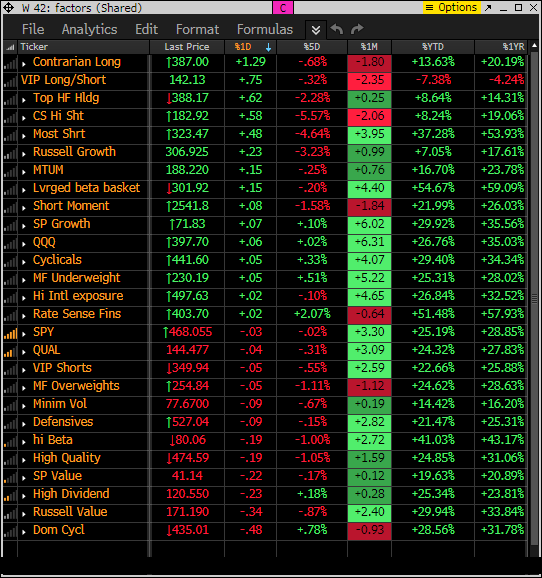
FACTOR, short baskets AND PPO MONITOR UPDATE
Factor monitor mixed today however a lot are under the 5 day rolling period. A lot could also turn under the 1 month rolling period with a little downside too. When that happens, sellers start to get the motivation to sell.
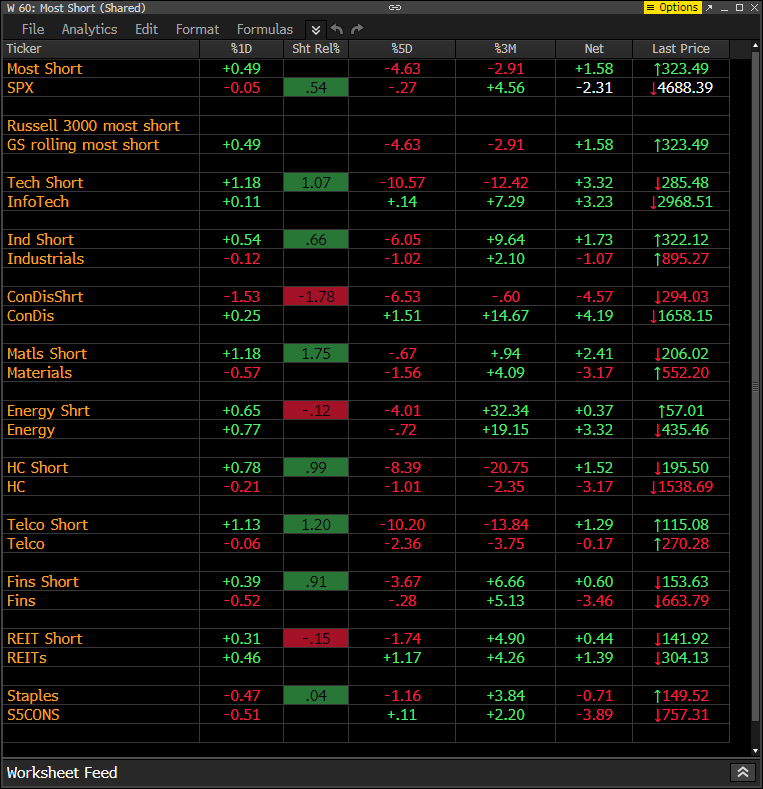
This is the monitor that has the S&P indexes and the Goldman Sachs most shorted baskets. Today the short baskets are mostly up (squeeze up) while consumer discretionary most shorted are down (retail is down)
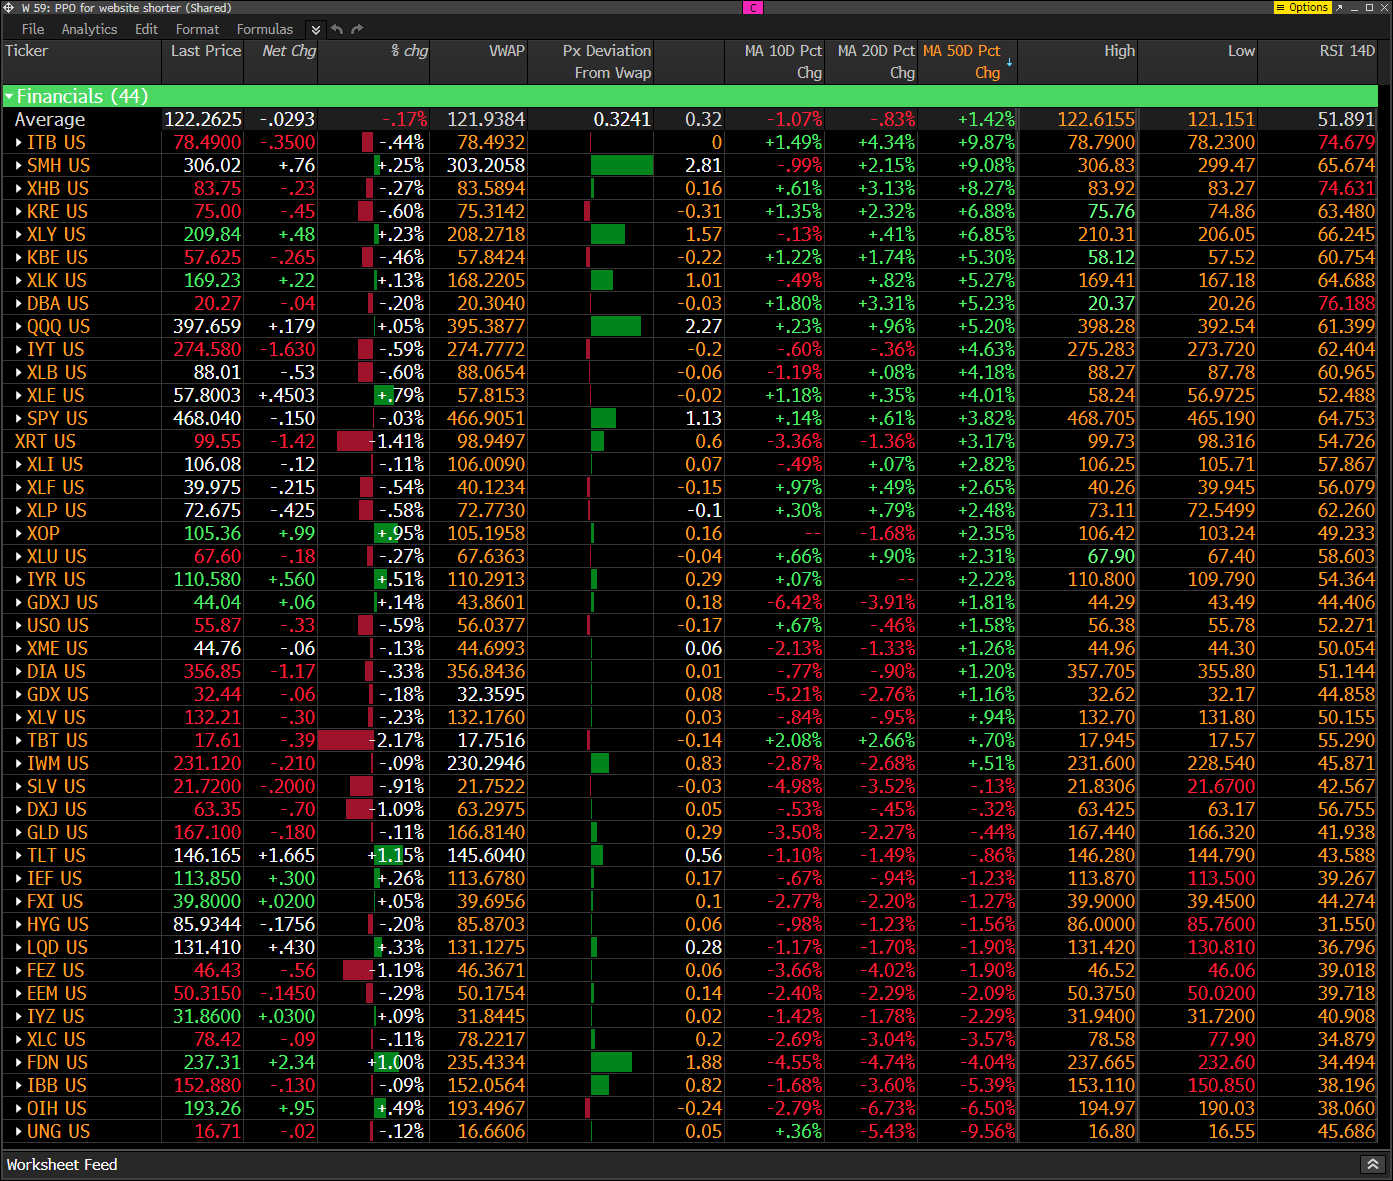
The PPO monitor (percentage price oscillator) force ranks ETF’s by percentage above/below the 50 day moving average. This monitor is offered to Hedge Fund Telemetry subscribers who are on Bloomberg. Watch the 10 day and 20 day for ETFs to turn red/green an early sign of rotation down/up.
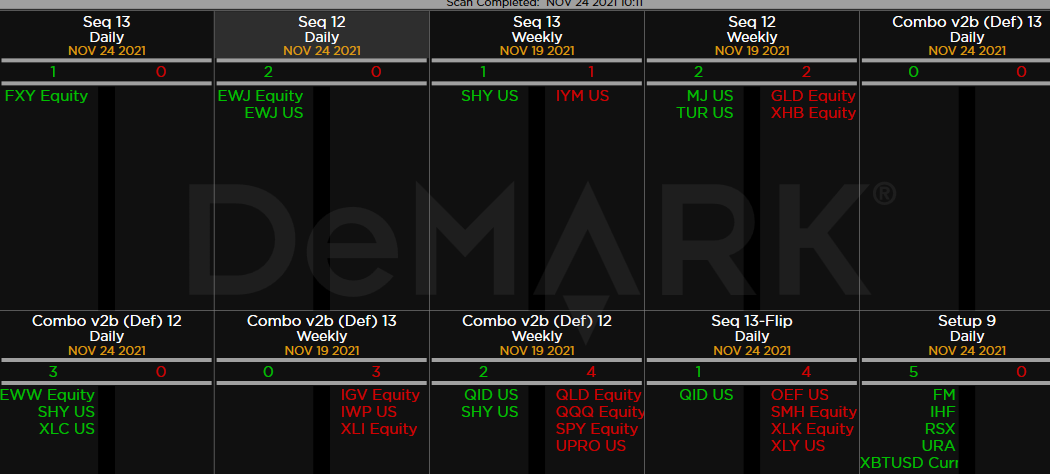
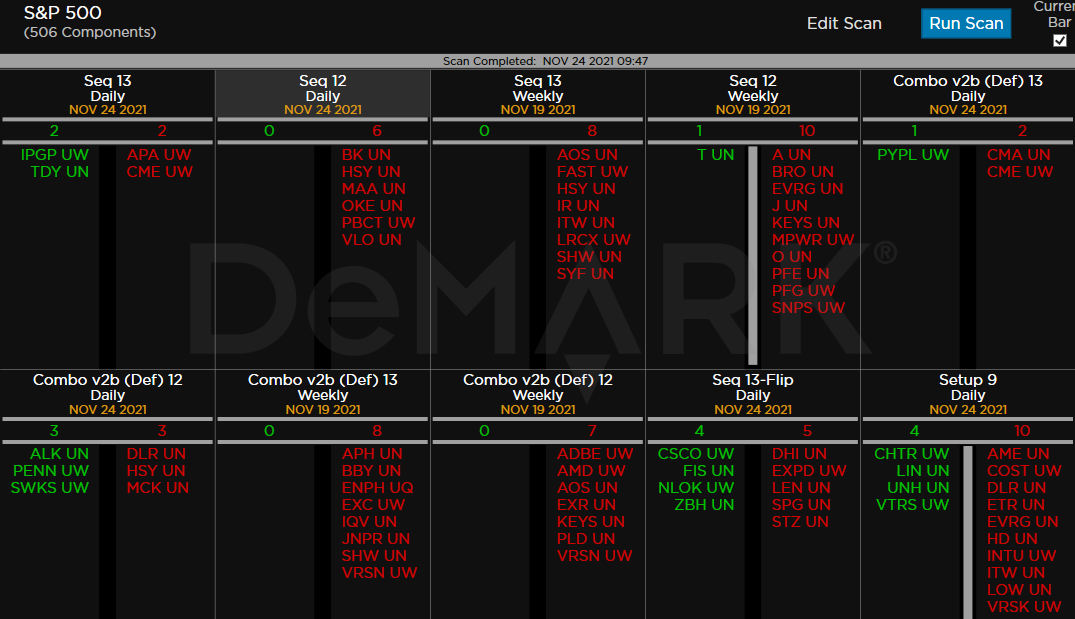
demark observations
Within the S&P the DeMark Sequential and Combo Countdown 13’s and 12/13’s on daily and weekly time periods. Still seeing a lot of weekly sell Countdown 13’s and on deck 12’s and some daily sell Countdown Sequential and Combo 13’s and 12’s to watch. Some dispersion with a few buy signals developing too
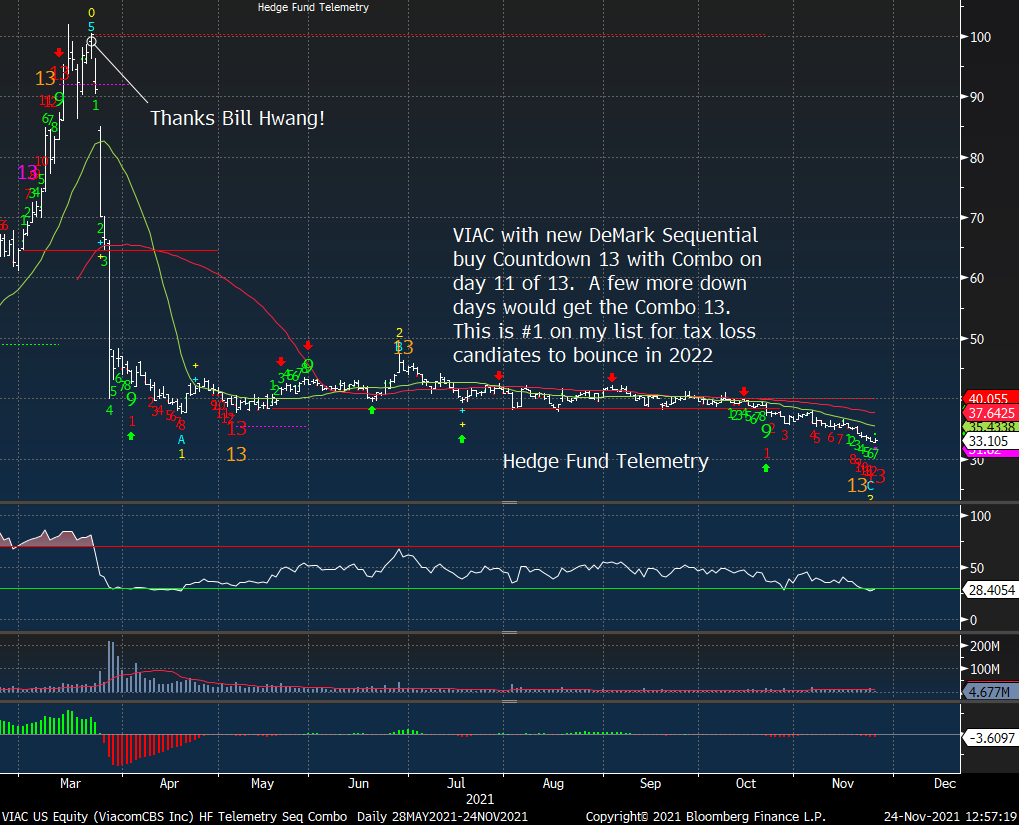
VIAC is #1 on my list of good tax loss bounce candidates for 2022. If you want to buy a little here to start that’s fine however I hope we’ll get the Combo 13 and that would take a few more down days.
ETFs Some important ETFs with weekly Countdown 13’s and on deck 12’s. Price flips down OEF, SMH, XLK, XLY – important to watch for a continuation lower