There are a lot of charts and indicators that suggest the markets are at critical levels. First, the equity markets are short-term oversold based on 60-minute time frame charts as shown on First Call earlier. Second, everyone wants to buy a dip as they did last Friday and a few other ill-fated times earlier this week. Third, the markets are not oversold based on daily charts, sentiment, or with the usual internals. I might add credit spreads and option-adjusted spreads with various sectors are at critical levels too. Levels that either have another successful dip bought or a break that gives us a 10%+ correction.
I was going to call this note “Ignore at your own risk” because the markets have a consistent way of ignoring potentially bad news or even basic valuation or when the froth is just extreme. Apple had a crappy quarter in Q3 and they leaked out before earnings they were going to sell 10 million fewer iPhones vs expectations due to supply chain problems. They released new iPhones that were almost identical to the previous model while increasing the price a little bit. Now they leaked to suppliers that they now have a demand problem which caused the Asian suppliers to drop hard while Apple was down 3% in the premarket, it’s only down less than 1%. Could other companies also have a demand problem developing? Something to not ignore.
The next big risk to the market I said recently is tomorrow’s jobs report. Fed Chairman Powell already took some of the surprise out of the report as he’s now pivoting to raising the amount of the taper at this month’s Fed meeting. The bond market has been volatile with the 2/10 yield curve flattening even more and that’s more of a bearish development illustrating the potential for the Fed to move faster not only on QE but raising rates next Summer. Going from zero to 25 or 50bps shouldn’t matter much yet the markets will have to go through some digestion of that potential. Combining the tougher comps starting in Q1 for earnings growth and margins into Fed accommodation tightening while inflation isn’t as transitory as expected is a daunting thought.
Below I will highlight those critical levels I’m watching with sentiment, markets, internals, and credit spreads.
Trade Ideas
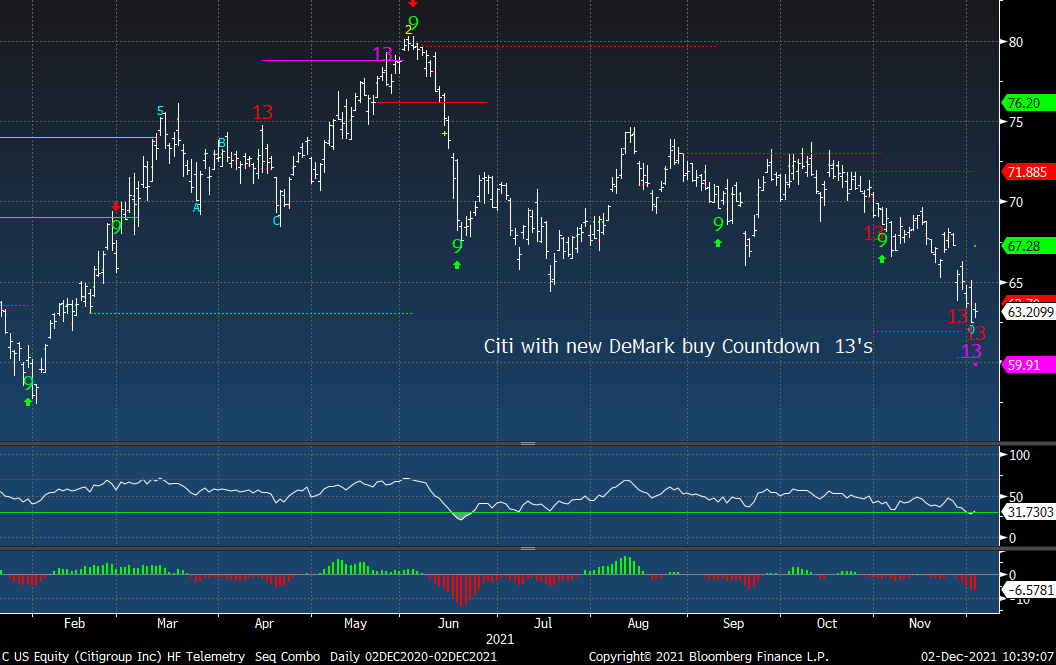
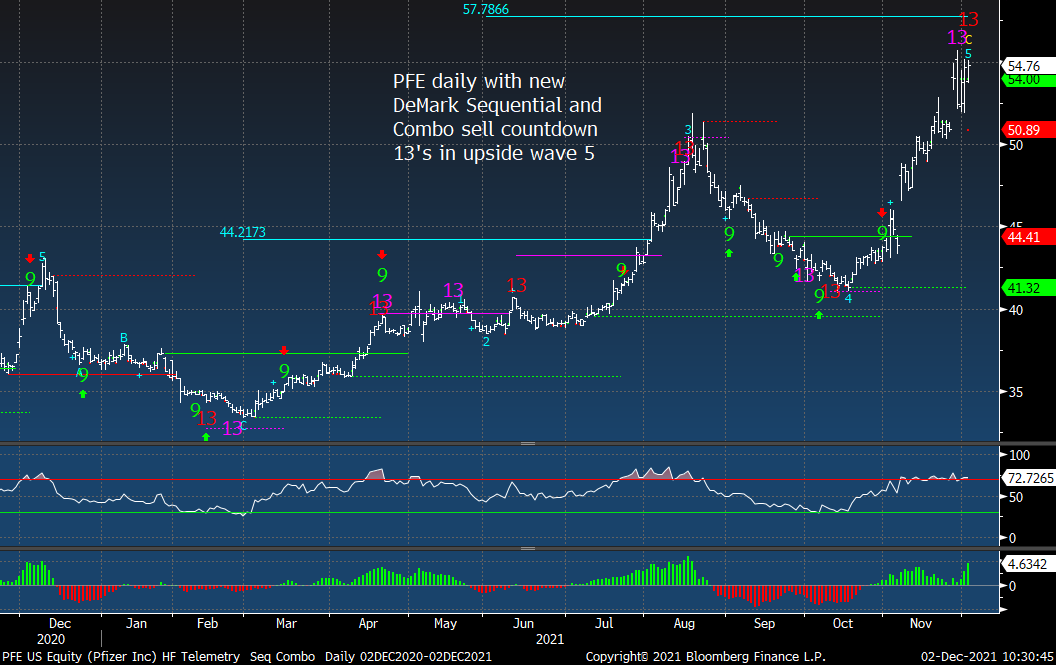
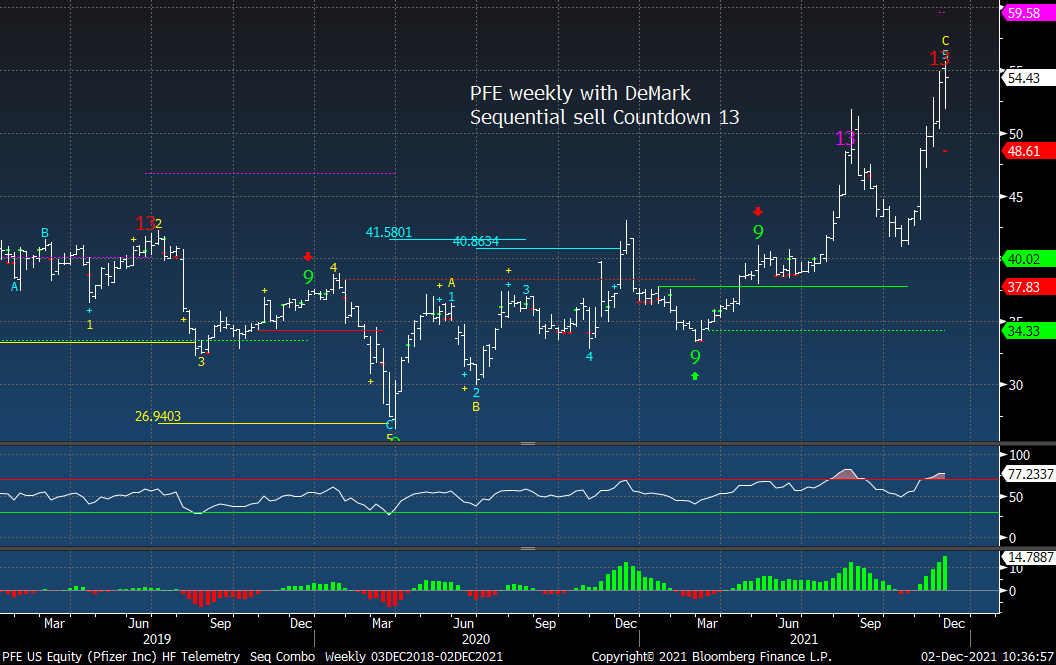
I’ve been hearing some chatter of some positive developments with the cannabis SAFE act that is floating around Congress. If this gets a vote it will pass and the sector will rally taking off the overhang from cannabis banking restrictions. If you are short HOOD or bought the Dec 30 puts for $1.00 or the lotto pic 25 puts for 0.23 take some gains NOW at its trading at 23.50! It’s piggish right now and I love it but don’t overstay your good trade. I will be buying more ATVI, TWTR, VIAC when the tax-loss selling starts to end. I am adding a 3% short position in PFE as there are some good daily and weekly exhaustion signals happening in sync. I am also buying a 3% sized long in Citi “C”. I’m going to cover and take off the TGT short for a 2.7% gain and the XLB short for a 4.3% gain.
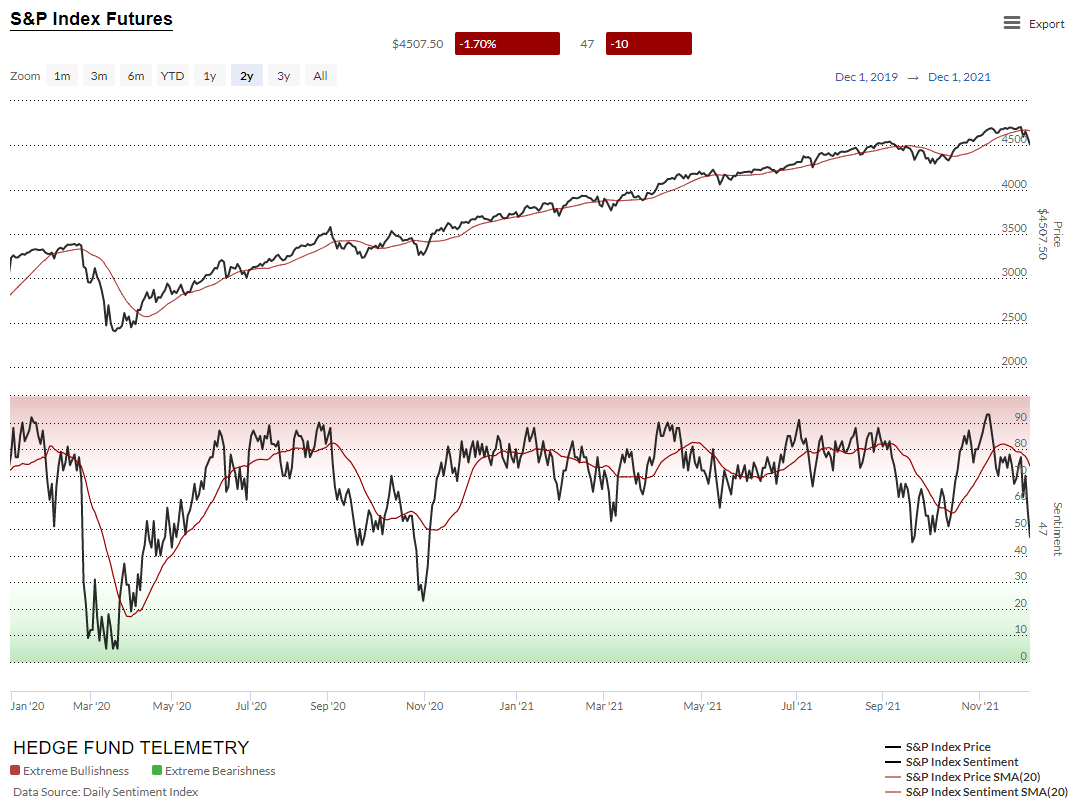
US MARKET SENTIMENT
The S&P bullish sentiment is now under 50% at 47%. It will likely bounce again unless there is another late day rug pull
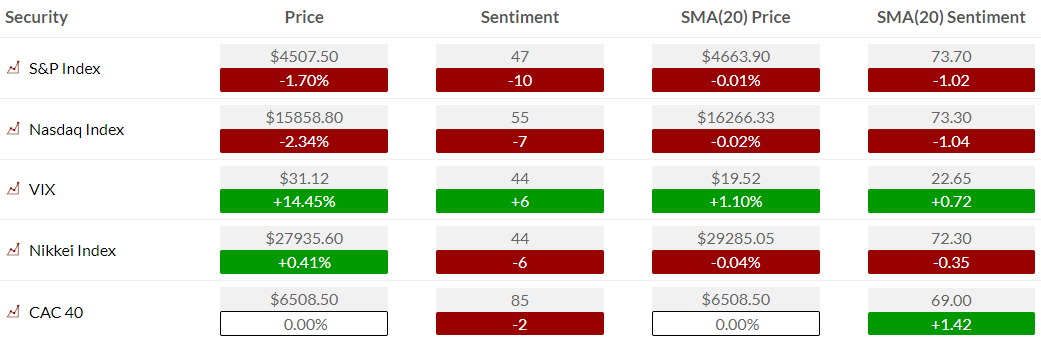
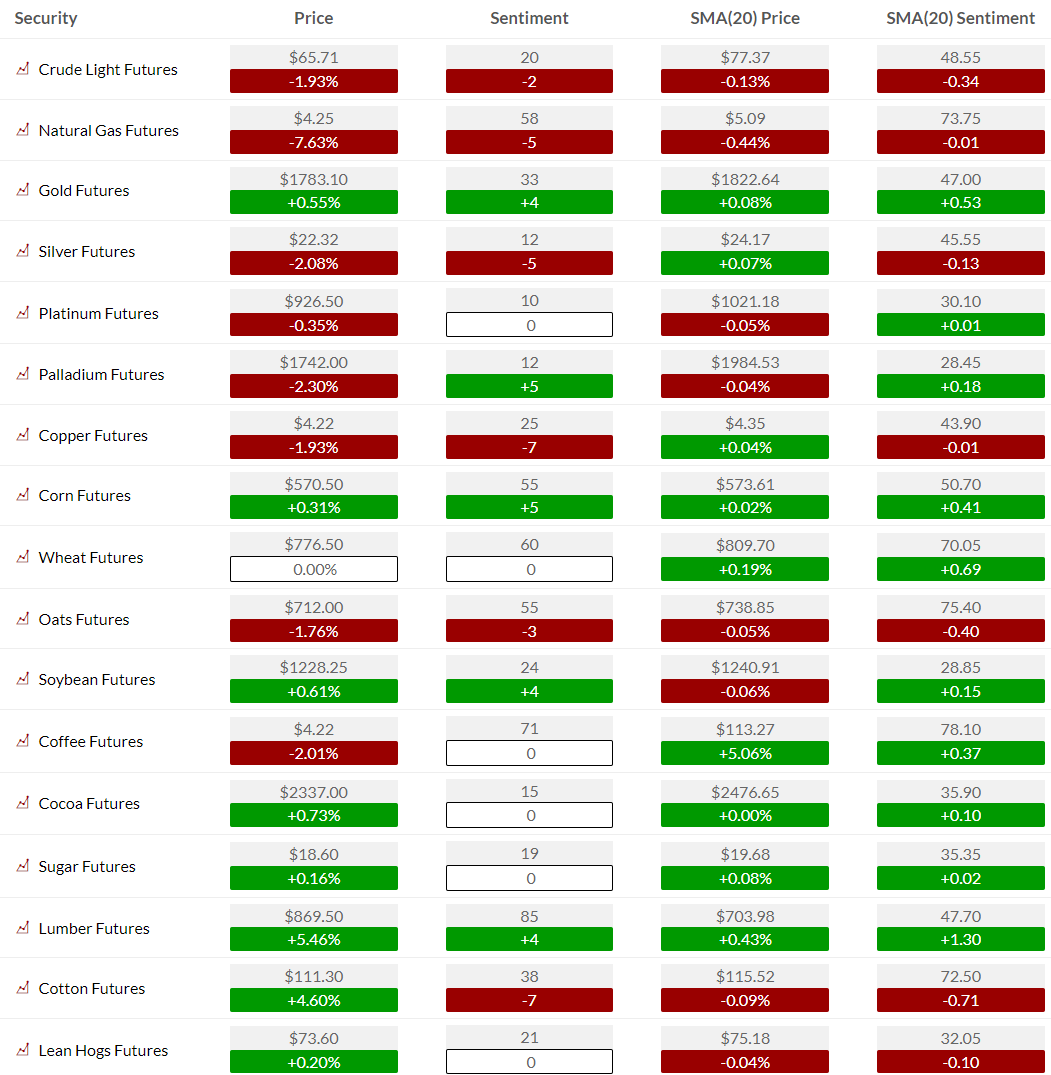
S&P futures bullish sentiment made a negative divergence vs index price. As you can see the 50% level give or take a few points is a critical level. It better hold for the dip buyers.
US MARKETS
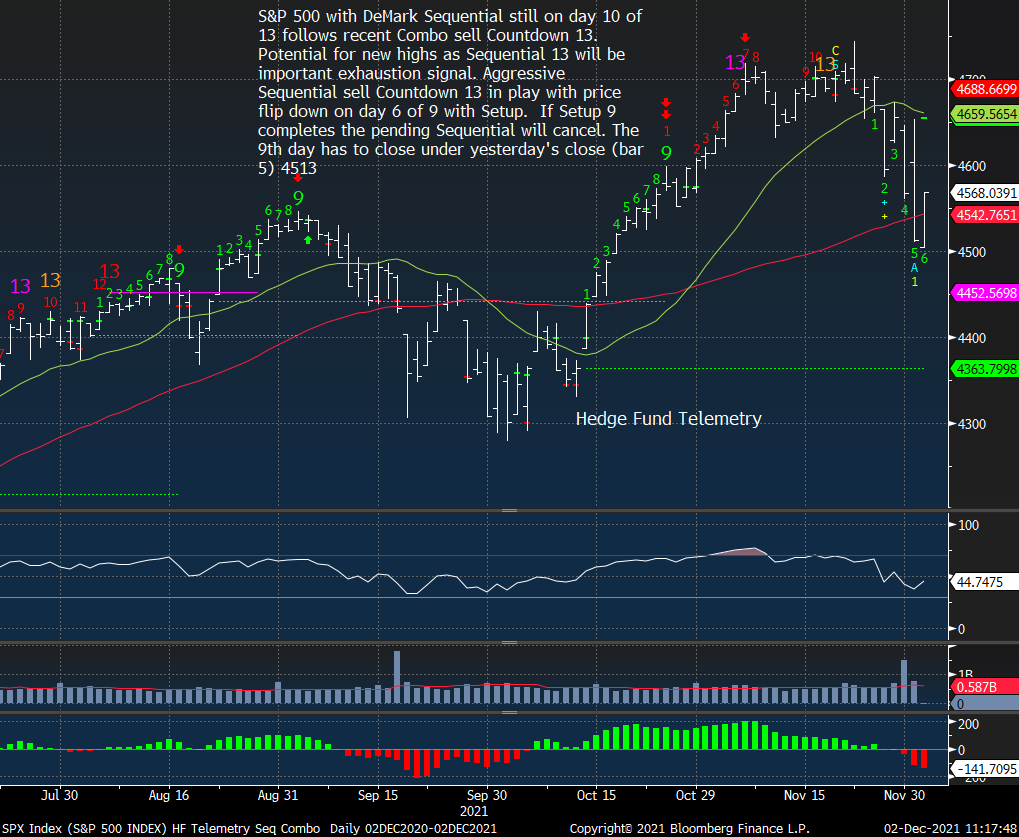
S&P daily with the DeMark Sequential still is pending on day 10 of 13 after a new Combo 13 was in play. 4500 is a nice big round number however CTA’s who are fully long equities turn sellers ~4475-4450.
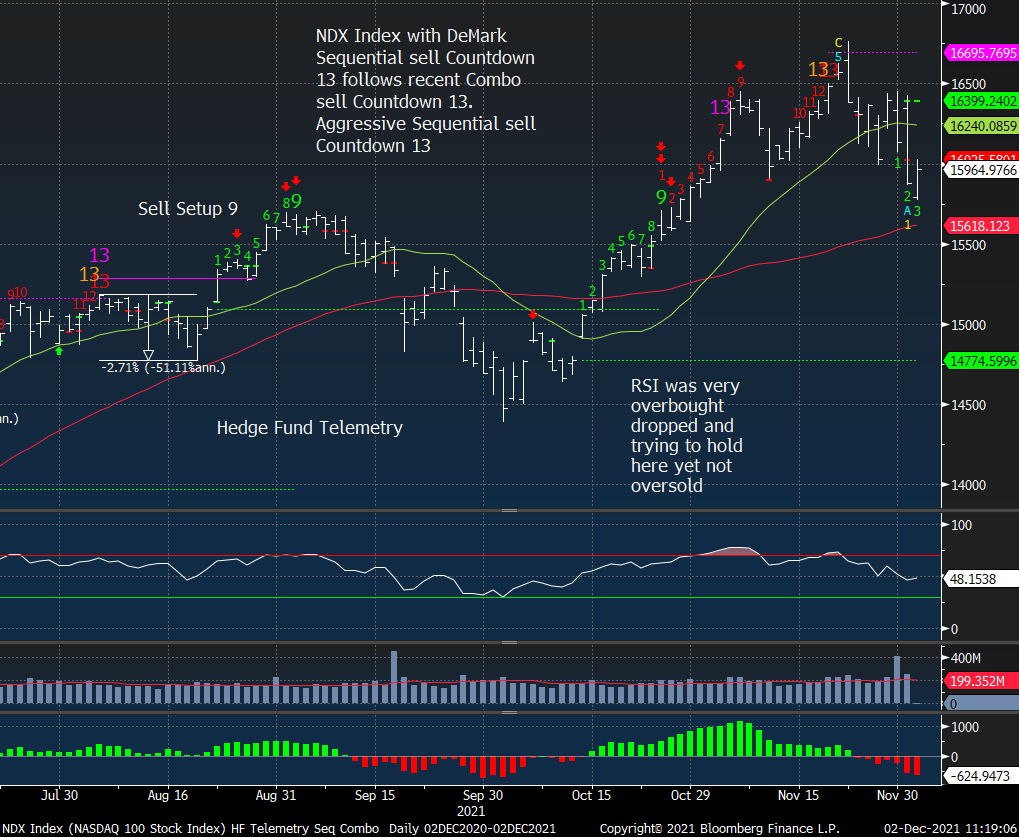
NDX daily also reversing after gapping down. Not a bad sign however this did not get oversold enough as it did in September.
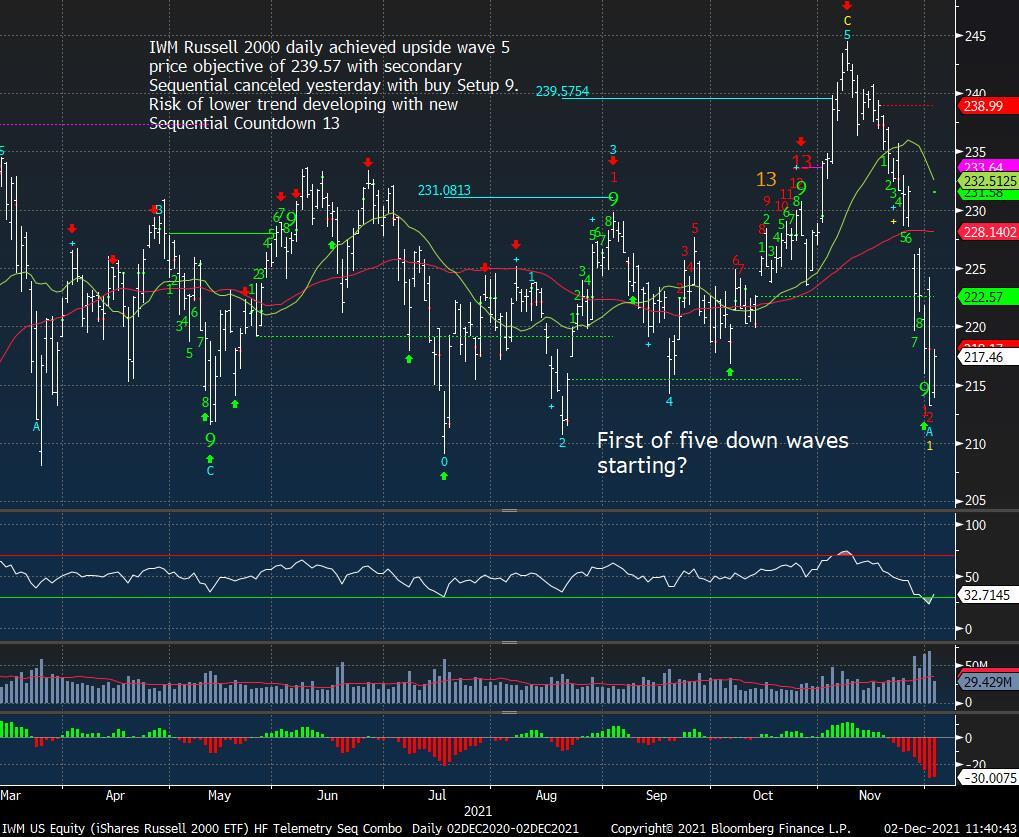
Russell 2000 IWM daily at the low end again and could start a new downside Sequential if we see new lows.
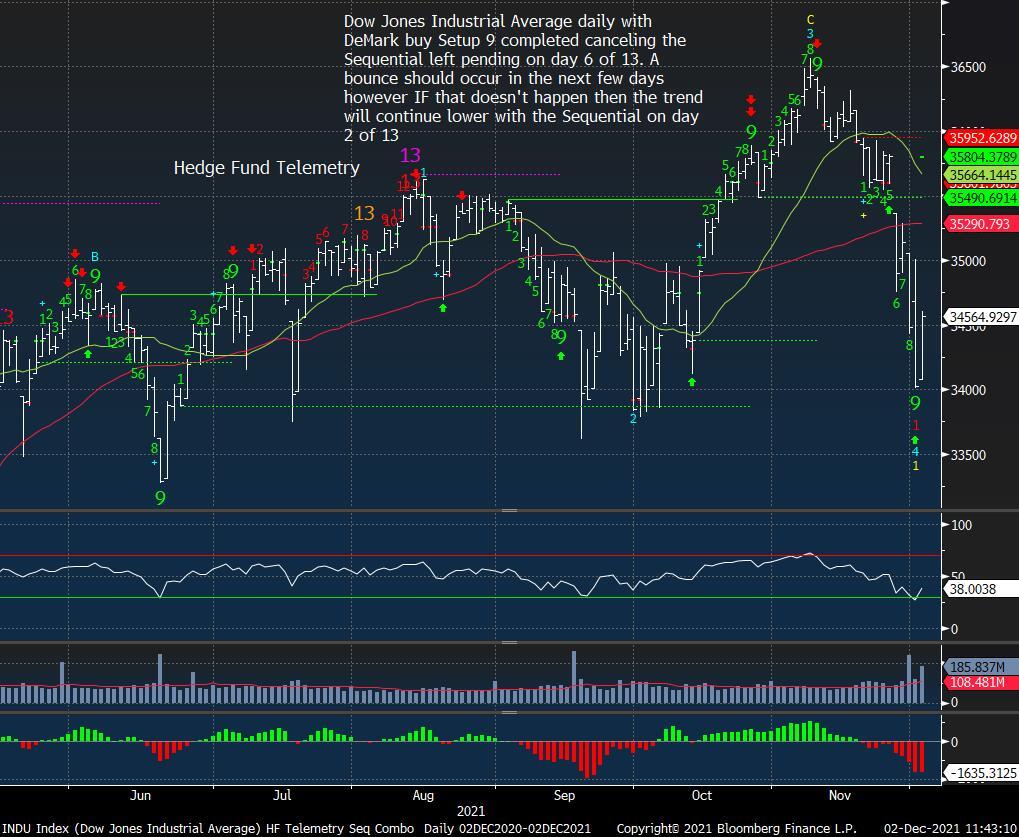
Dow Jones Industrial Average bouncing with the Setup 9 yet like the Russell there is potential for a new Sequential downside Countdown if these critical levels don’t hold.
INternals – some are getting oversold and some are not
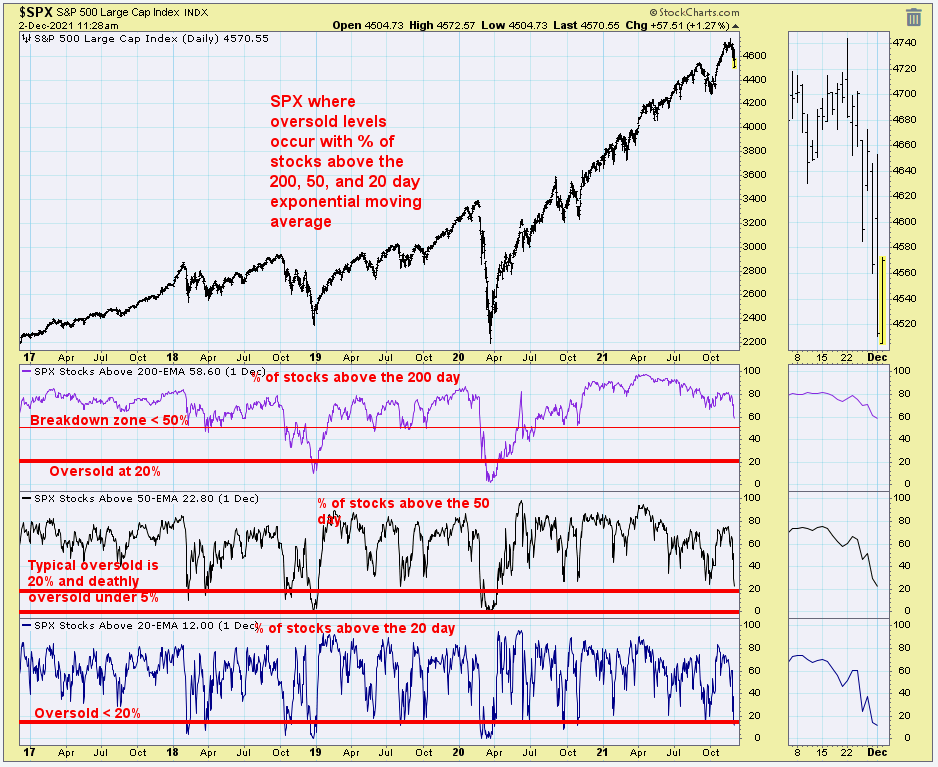
SPX Oversold indicator looks at the percentage of stocks above the 20, 50, and 200-day moving averages. The 20 and 50 day levels are at mildly oversold levels while the percentage of stocks above the 200 day is dropping hard (for this indicator). This tells me that the majority of stocks are starting to go sideways vs the major indexes masking this since the mega-cap stocks have been doing the majority of the heavy lifting.
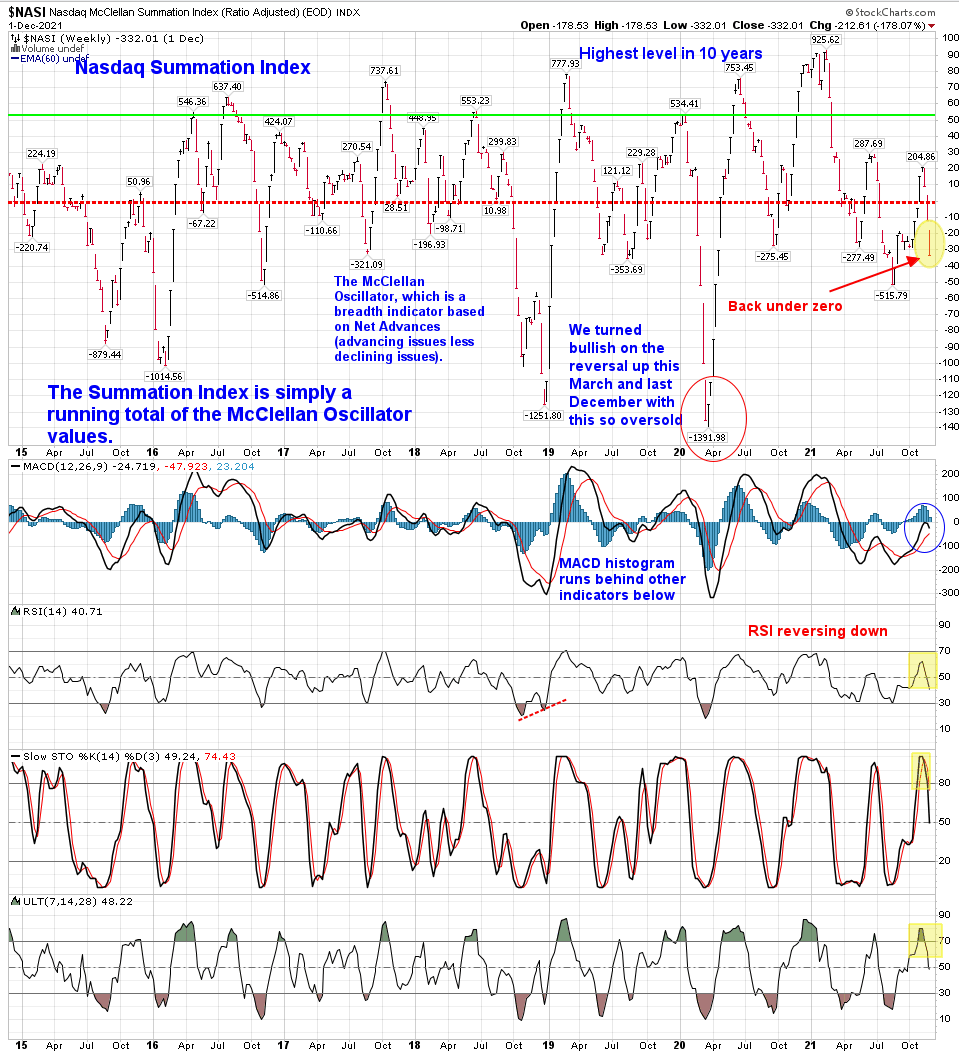
Nasdaq Summation Index weekly has been VERY divergent vs the index price and remains well under zero when markets tend to become very apparent in distress. The momentum indicators on this chart are not oversold. Not even the fastest indicator on the bottom is oversold.
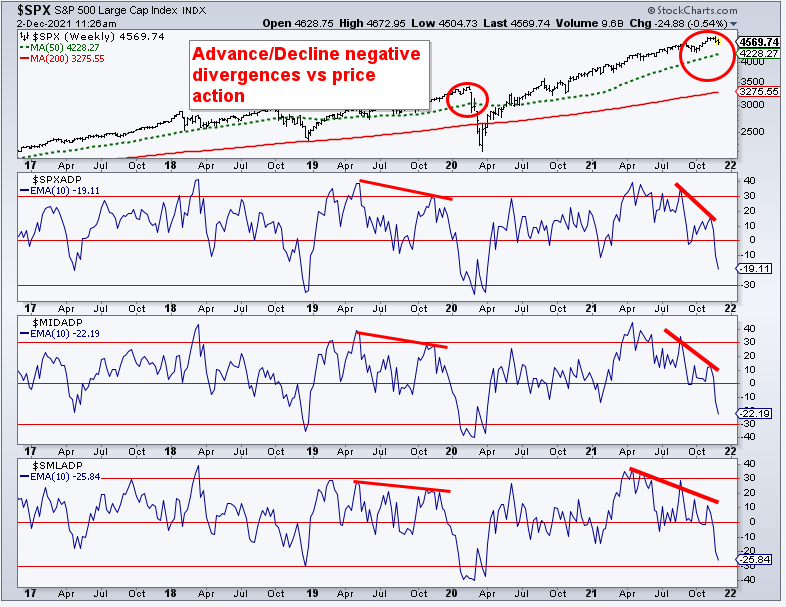
Advance/Decline divergences were highlighted recently and they still can work a little lower. When AD lines drop like this the market indexes are usually down a lot more. Not quite oversold enough
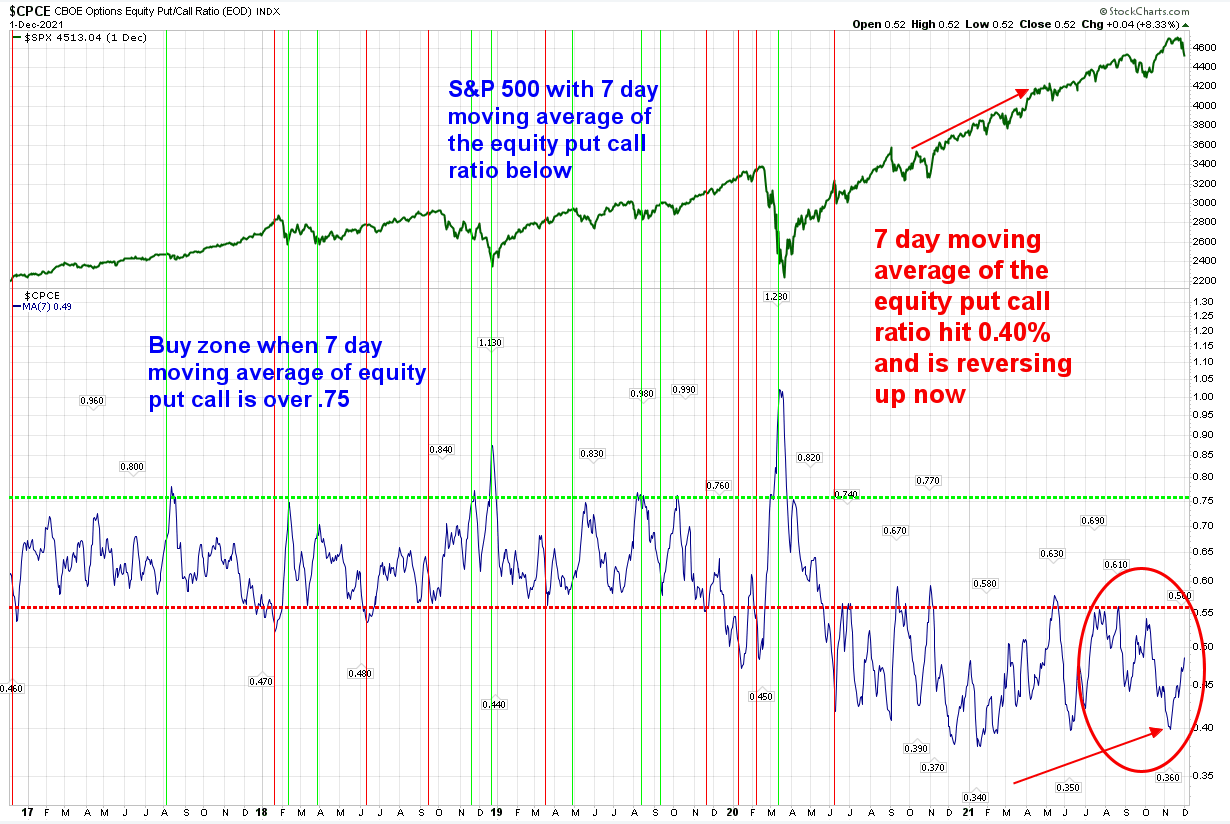
7 day moving average of the Equity Put/Call Ratio shows it rising however it’s not even close to giving a moderate oversold level. Considering this is a 7-day moving average this will continue to rise since the drama in the markets really started last Friday.
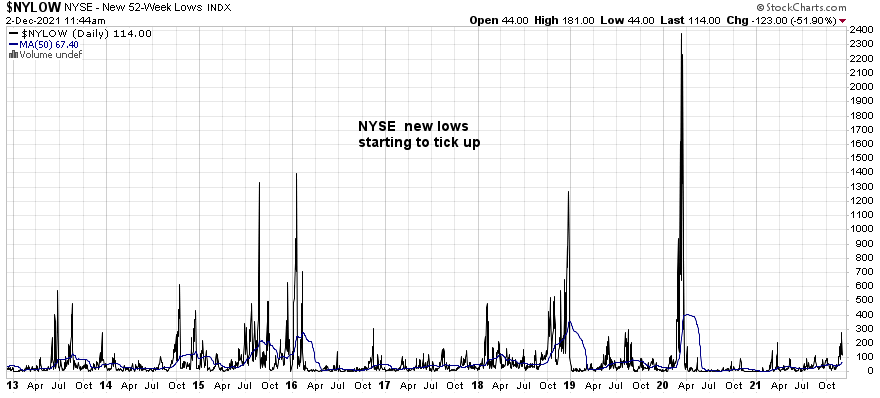
NYSE New lows are moving up a little and I expect this to increase in the coming months/quarter as the anniversary of the March 2020 low will expire and reset to March 2021.
SEctors in focus
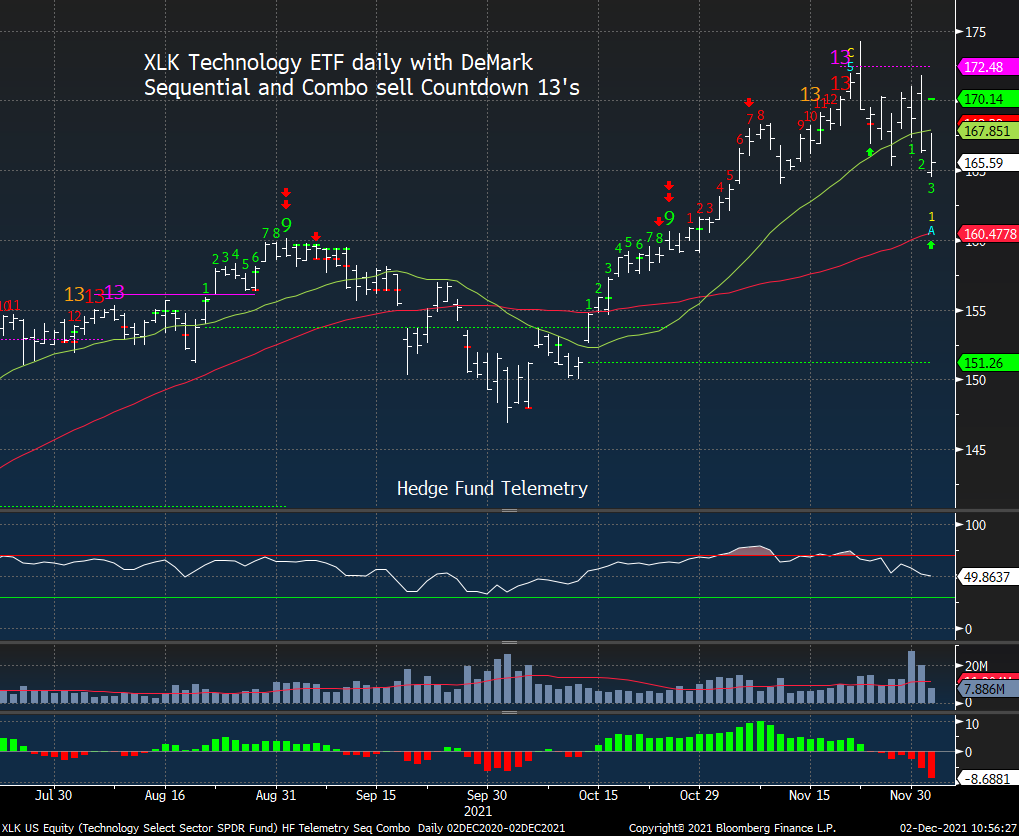
XLK Tech is still very extended from the September low
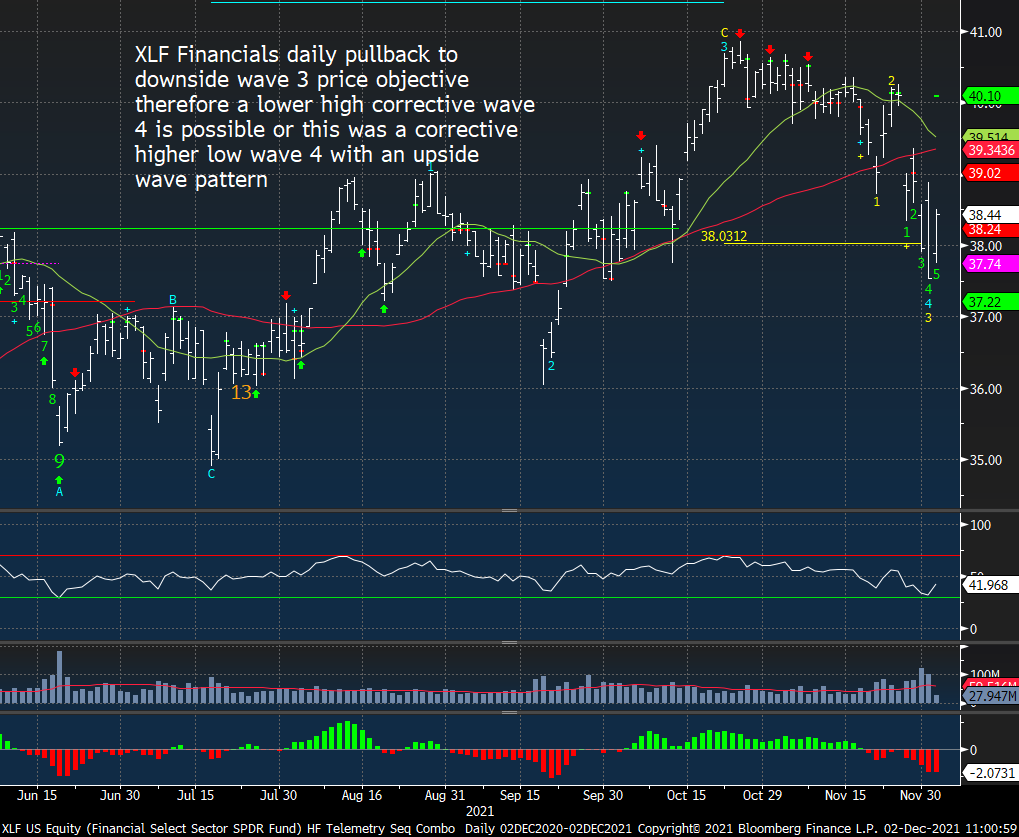
XLF Financials are at support and if this breaks the 36 level is likely.
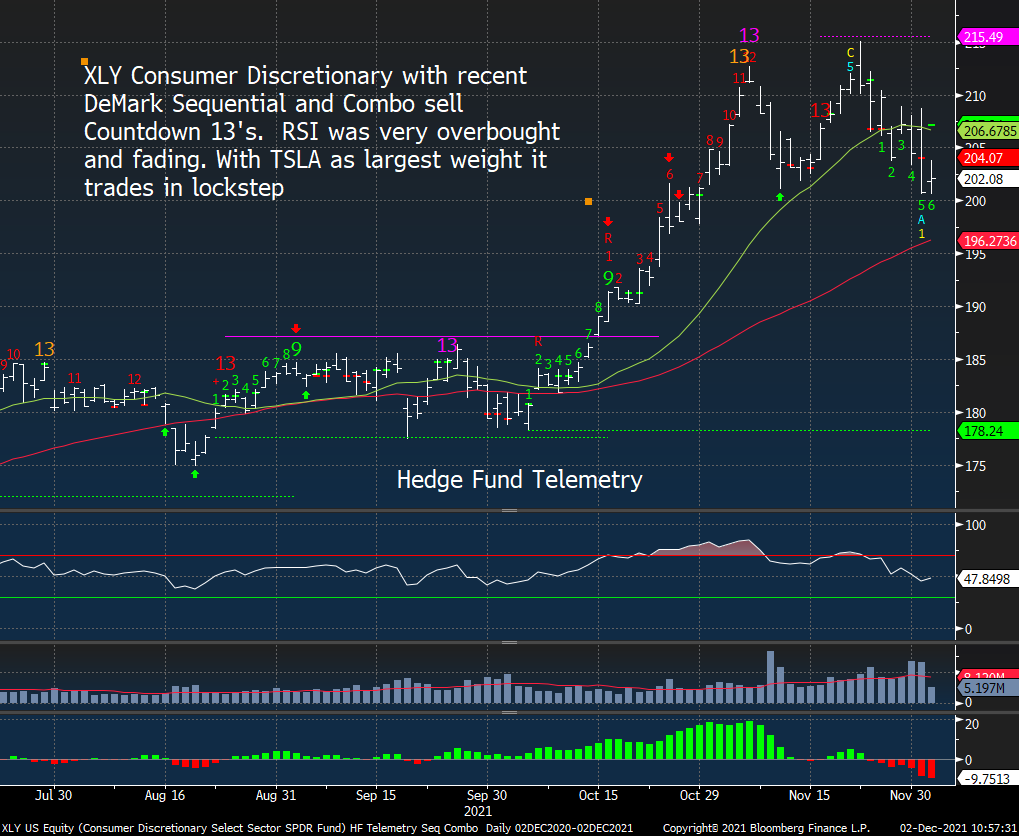
XLY Consumer Discretionary has support at 200. If this breaks, most likely it’s due to Tesla breaking too
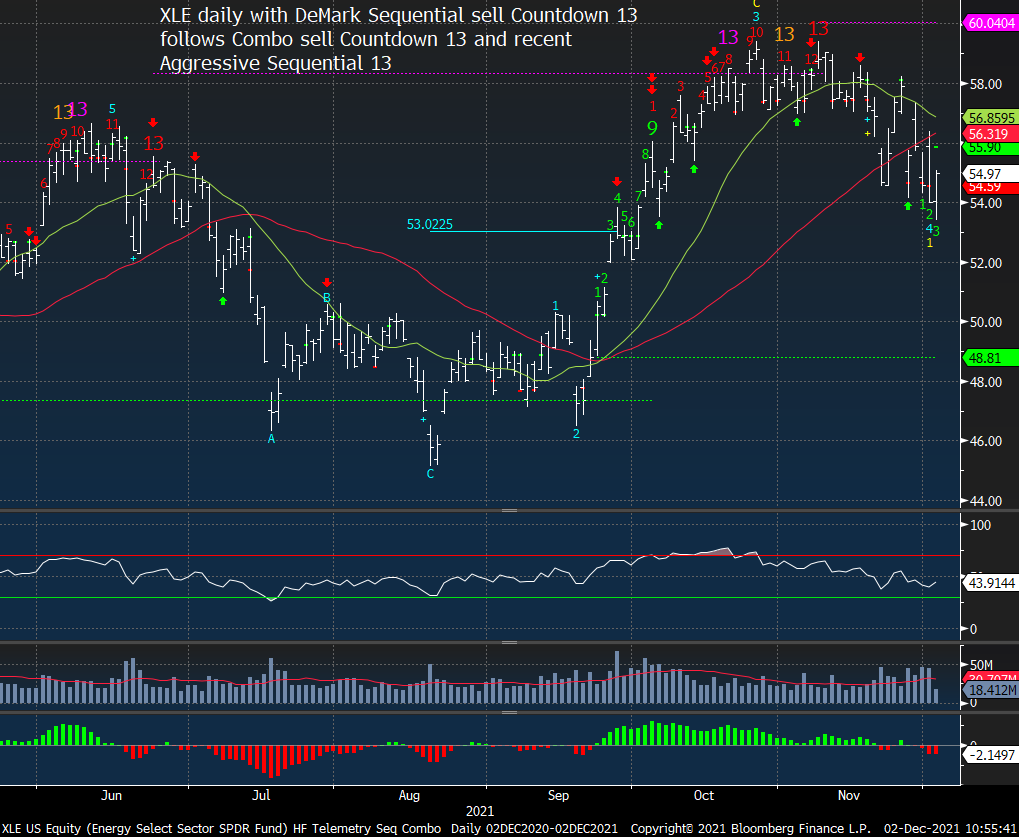
XLE Energy is bouncing today and I get a lot of questions about when to buy back energy. I’m not in a hurry as I would rather not get trapped long as many people have been in the last couple of weeks.
XOP Energy is a little steeper with a rounding top
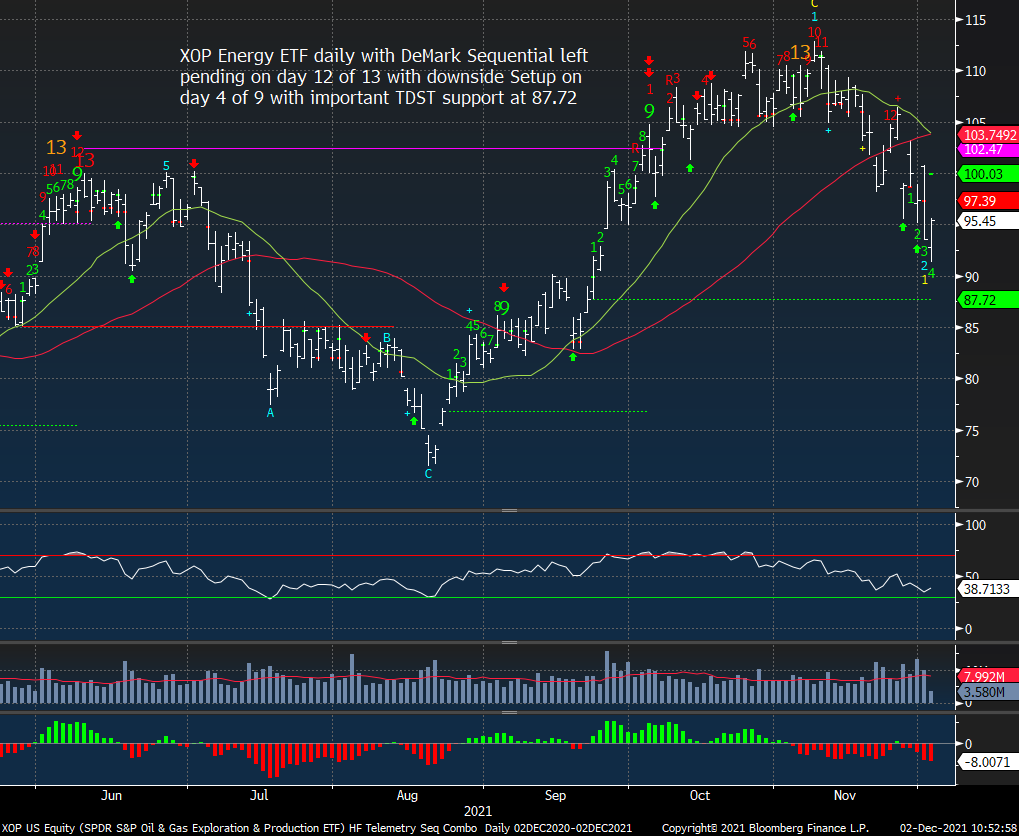
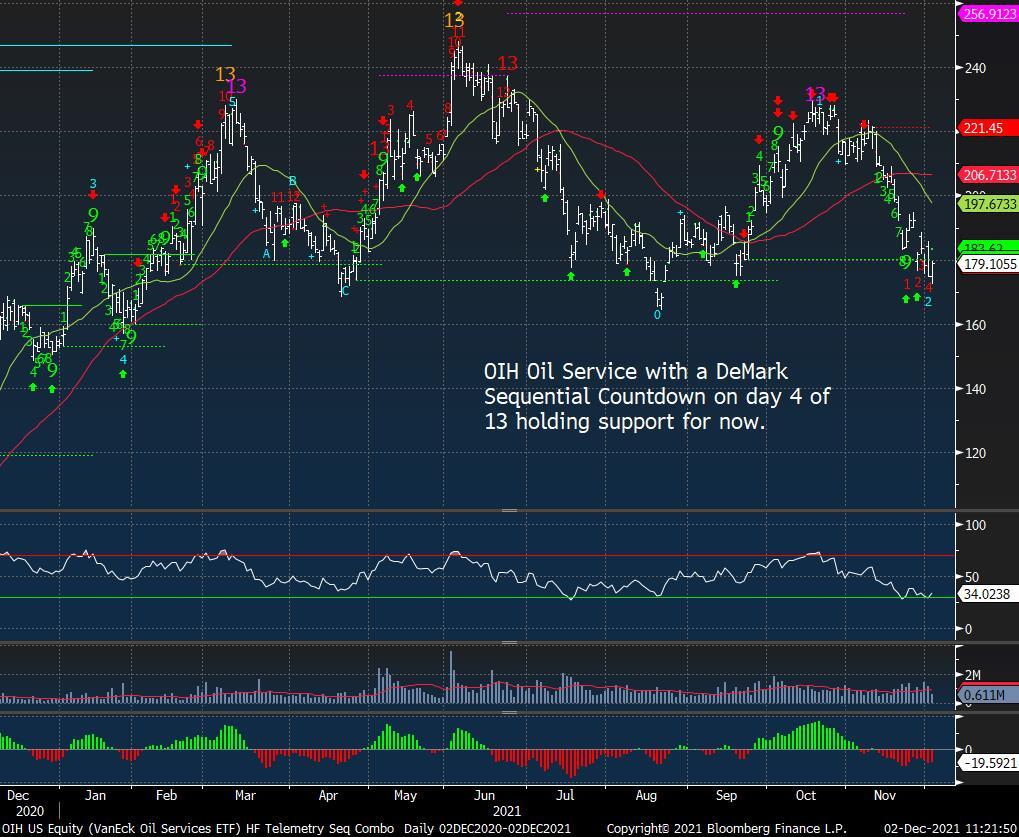
OIH Oil Services is right at past support levels – April and August. With the downside Sequential Countdown at the TDST line I’m concerned there could be a break lower. Very critical to hold here.
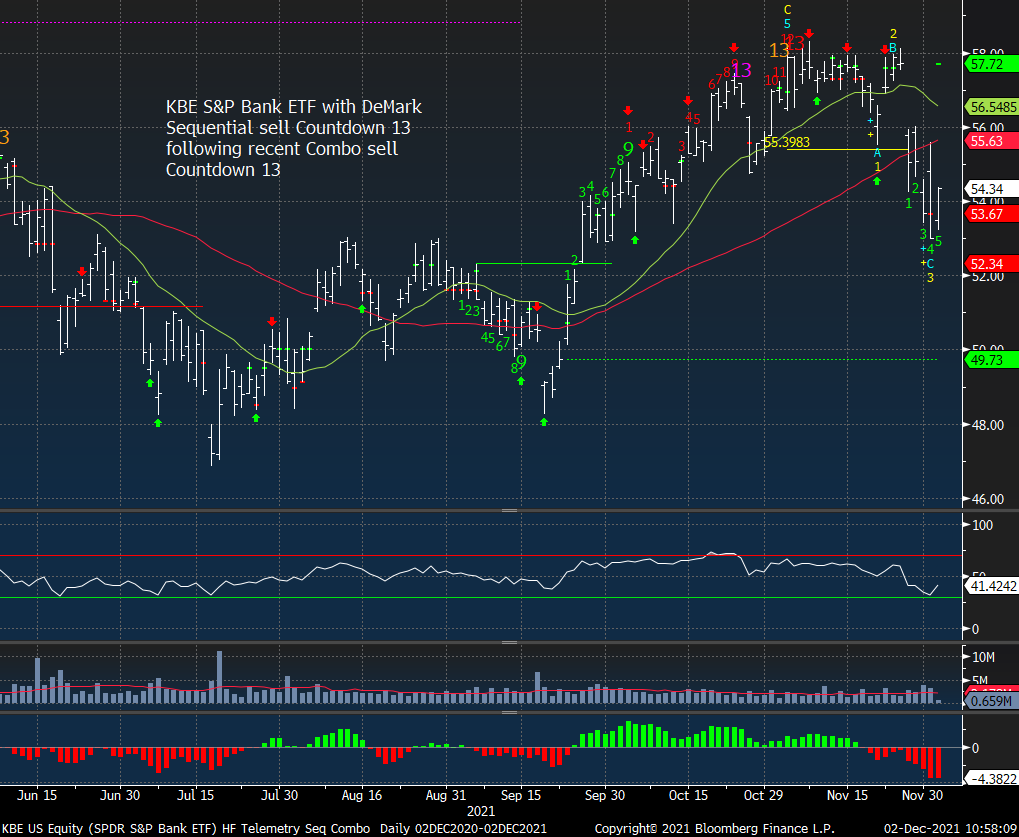
KBE S&P Banks is my preferred ETF for banks. I really want to buy banks however I’d like lower puke out levels and or rates to rise on the long end steepening the curve.
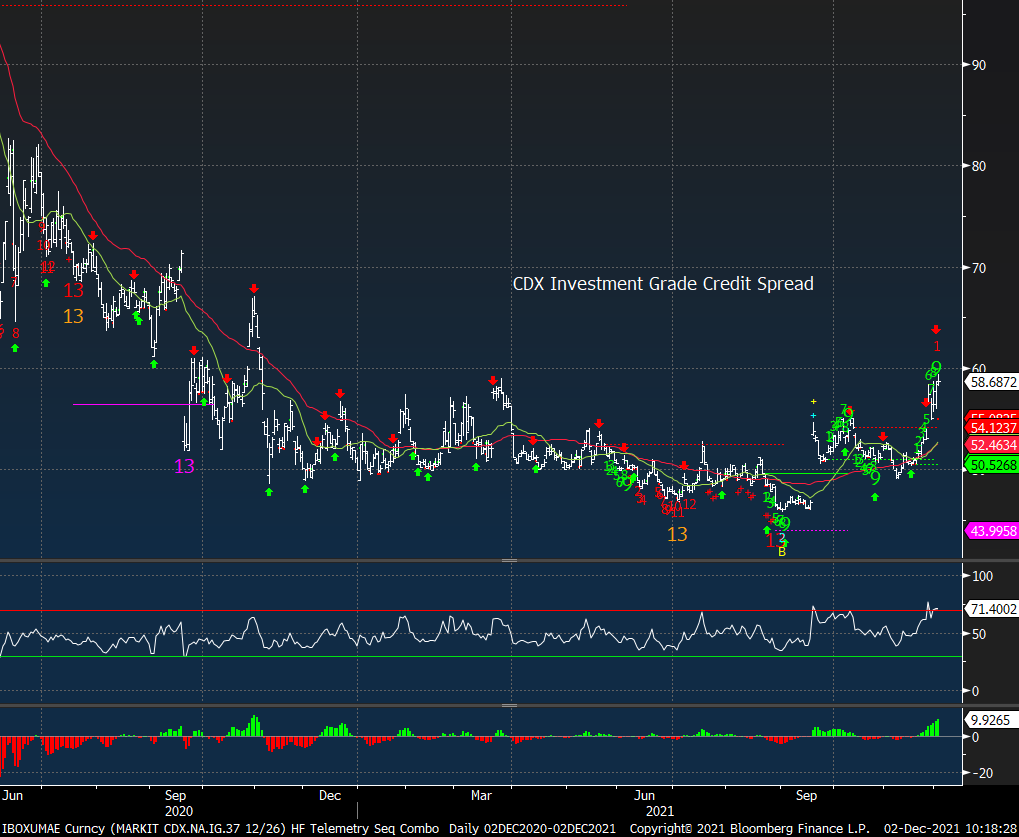
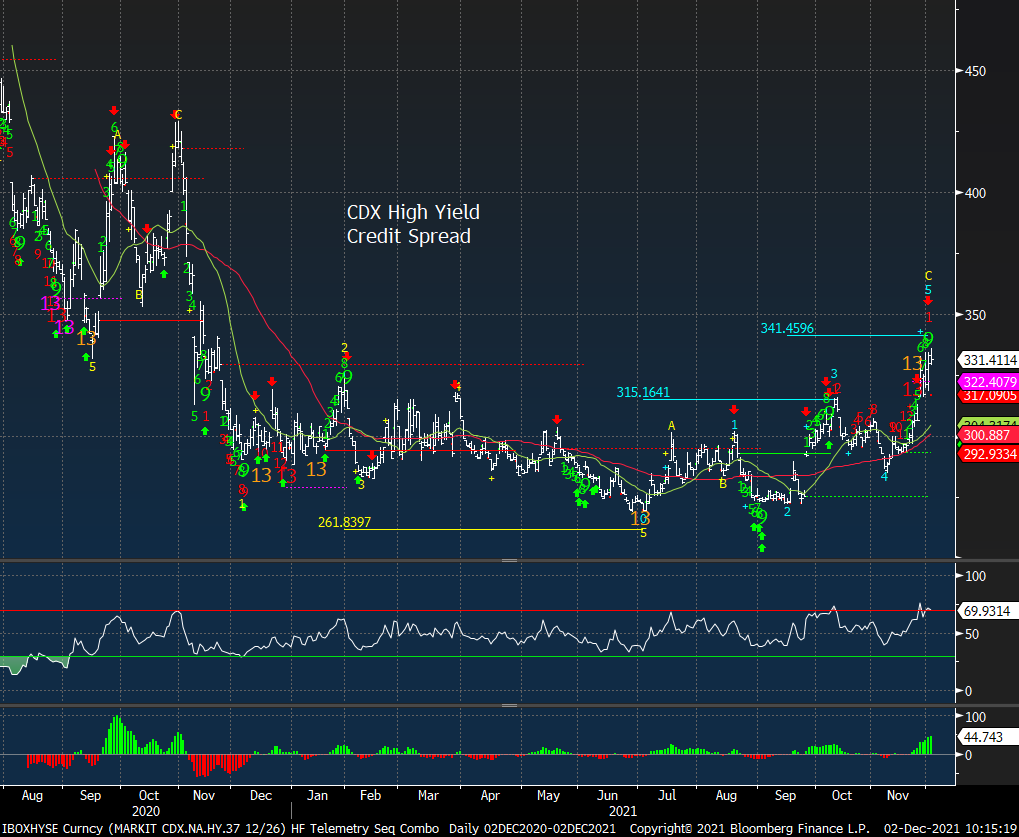
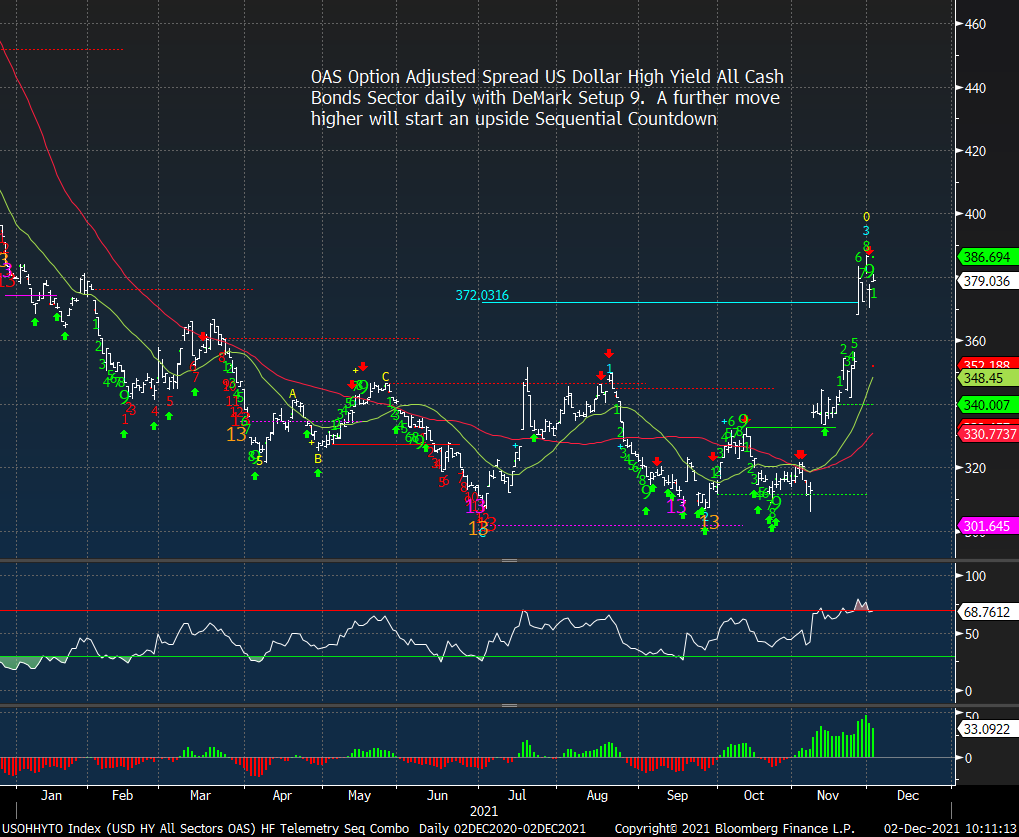
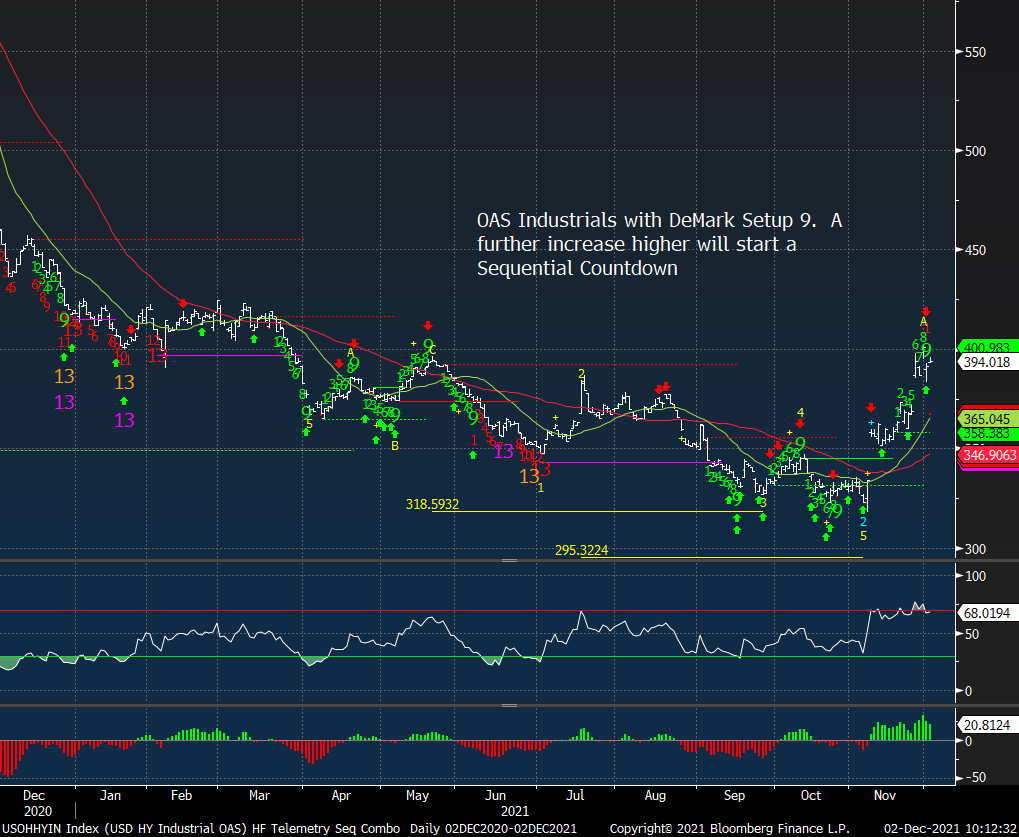
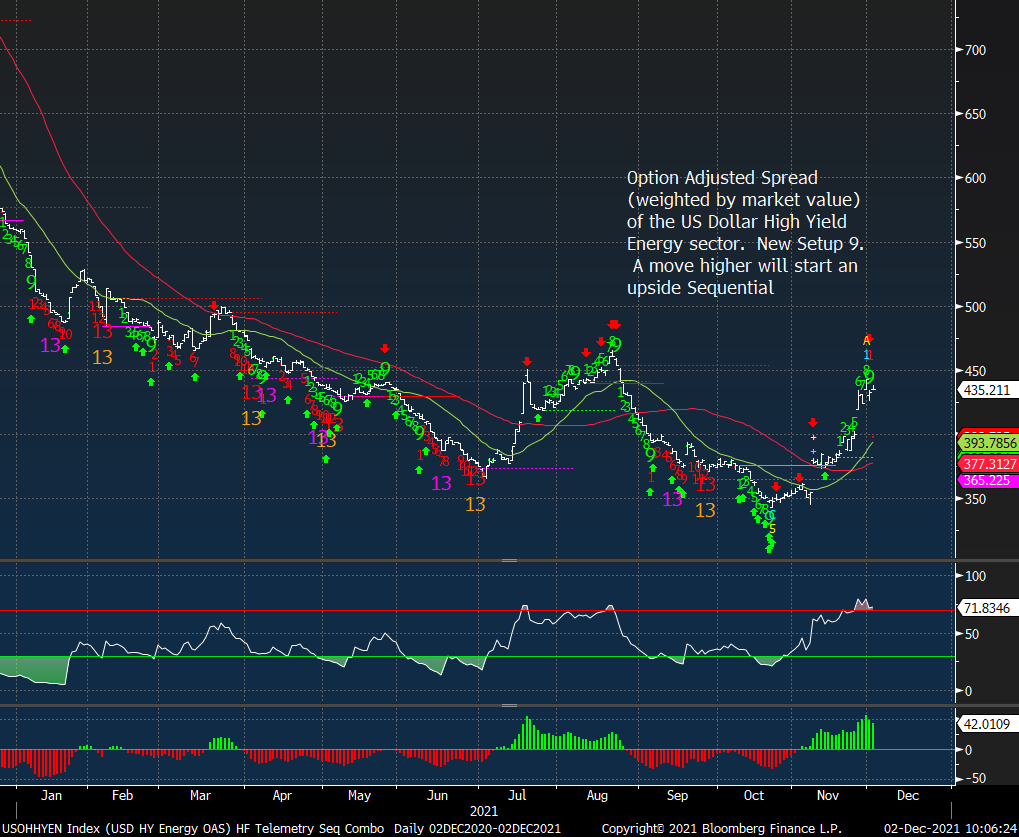
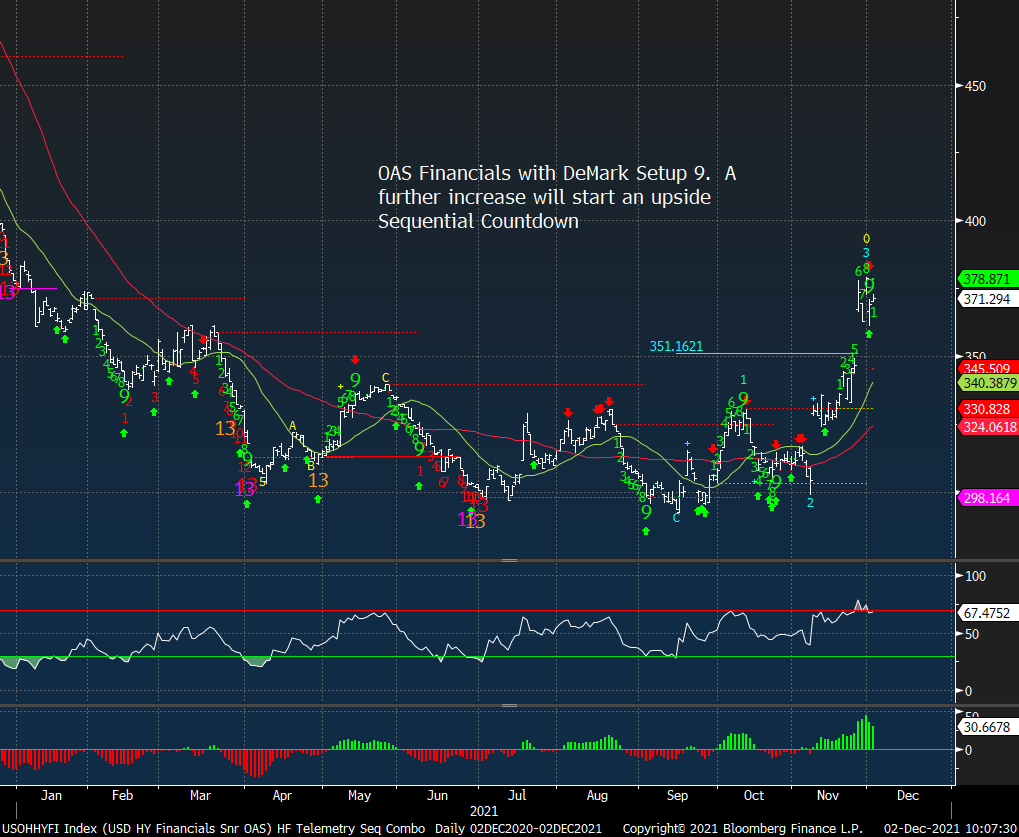
CREDit SPreads – all at very critical levels with DeMark set up 9’s that could turn into upside Sequential Countdowns with a little more upside action
CDX Investment grade credit spread
CDX high yield credit spread
OAS (option-adjusted spread) US dollar high yield all cash bonds
OAS Industrials
OAS high yield energy sector
OAS Financials
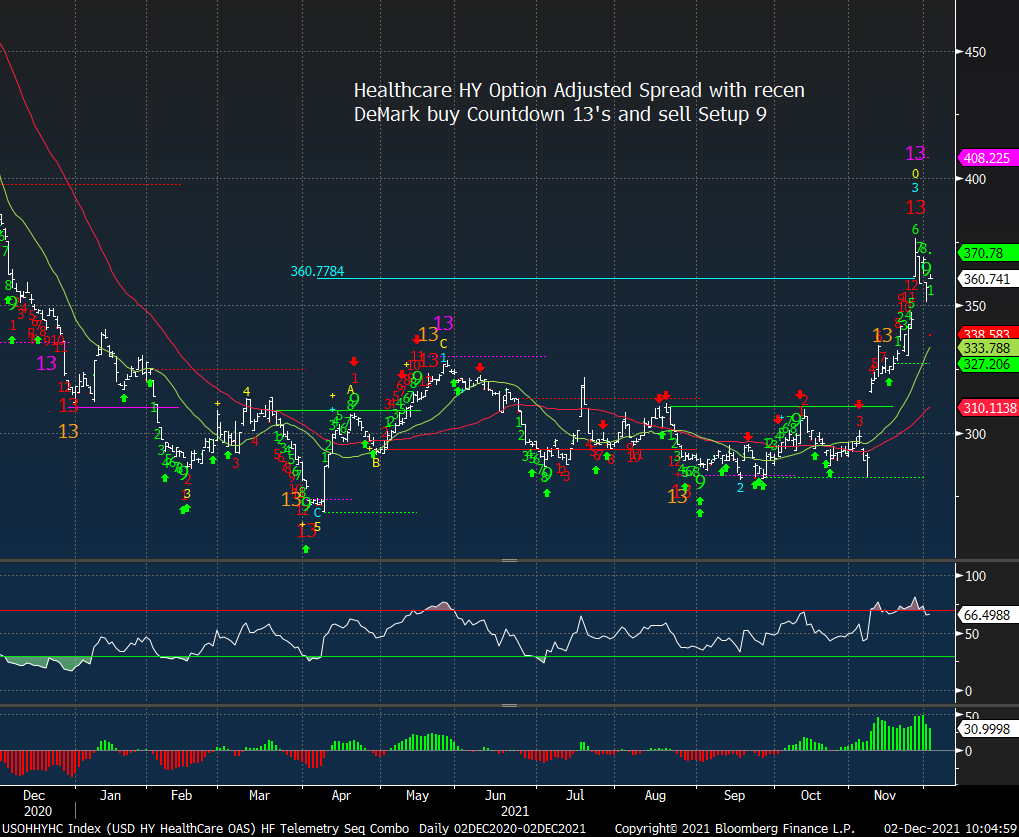
OAS high yield healthcare did get some Sequential Countdown 13’s however those started after the Setup 9 in October. There is a new Setup 9 so it’s possible a secondary Countdown could start.
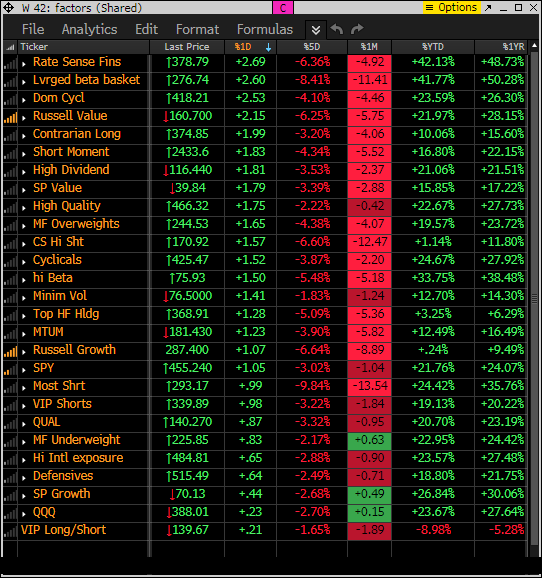
FACTOR, short baskets AND PPO MONITOR UPDATE
Factor monitor. A strong day with the backdrop weak 5 day and 1 month rolling performance. It’s going to take more than one day to stabilize this market
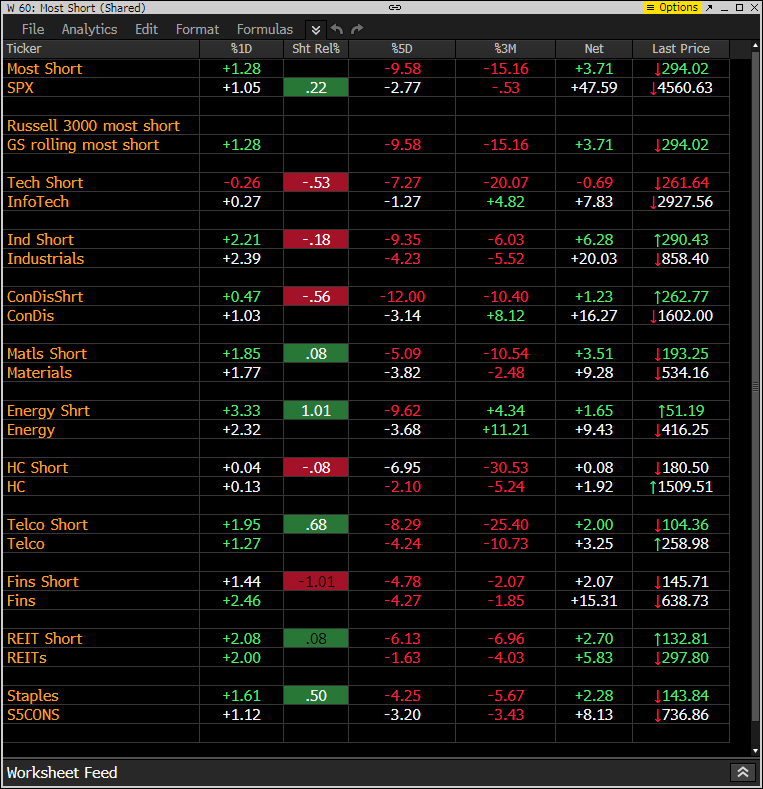
This is the monitor that has the S&P indexes and the Goldman Sachs most shorted baskets. Today the short baskets are showing upside gains which mean shorts are getting squeezed.
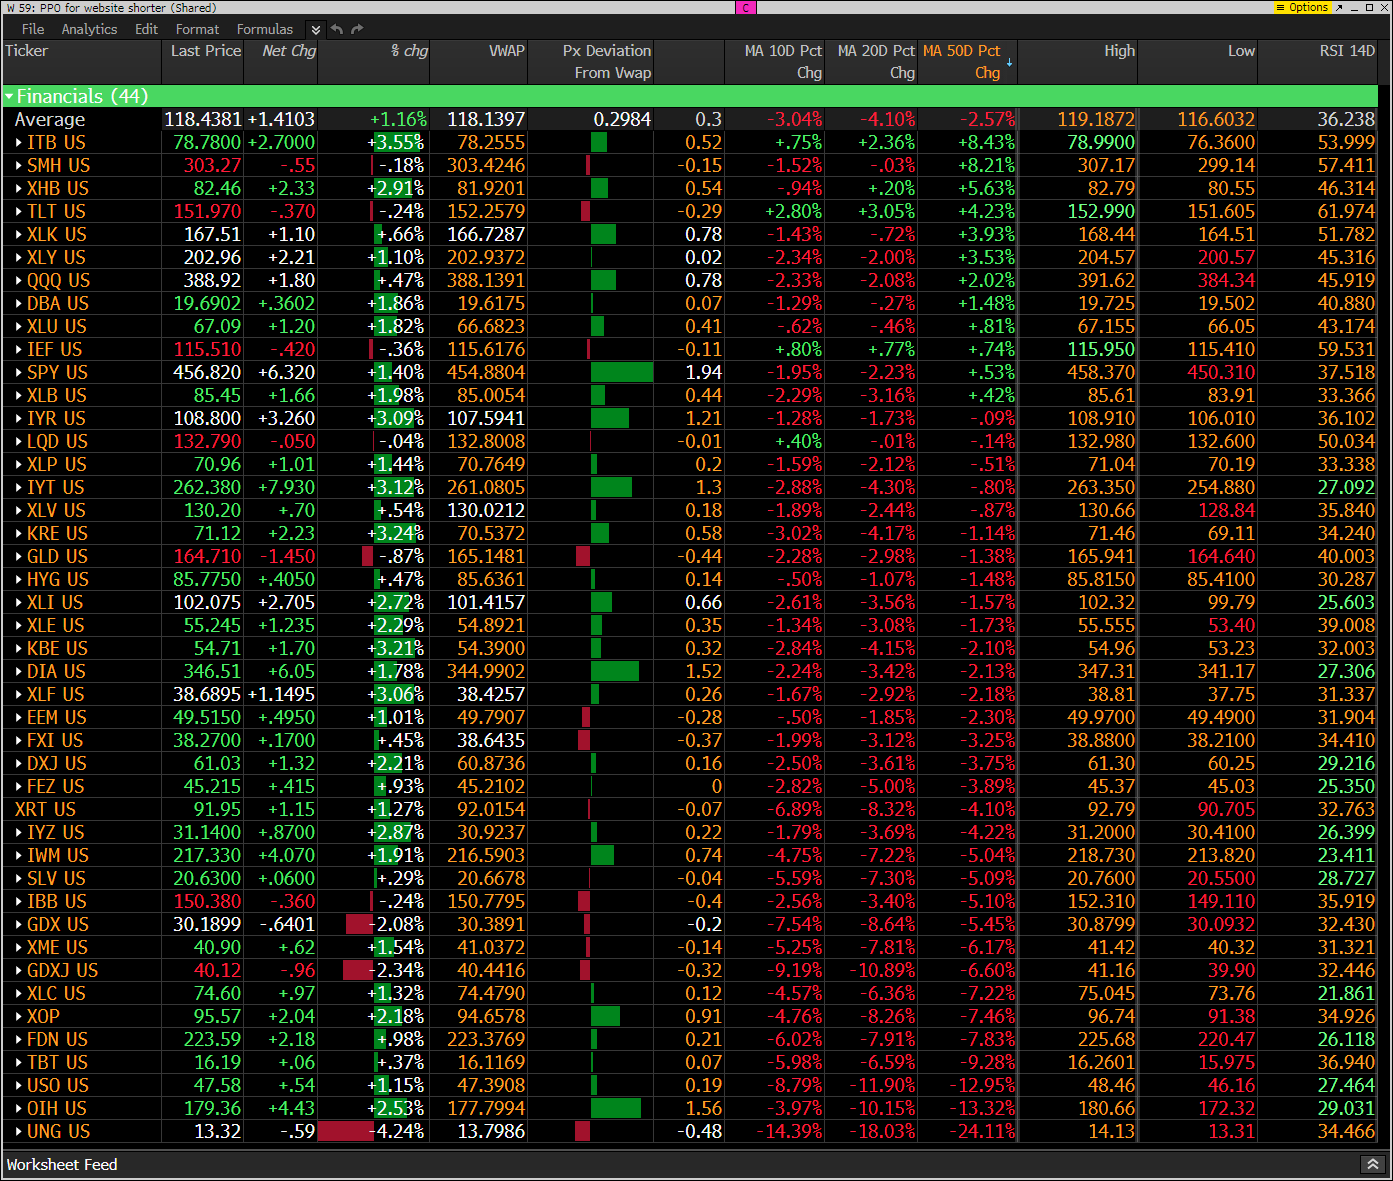
The PPO monitor (percentage price oscillator) force ranks ETF’s by percentage above/below the 50 day moving average. This monitor is offered to Hedge Fund Telemetry subscribers who are on Bloomberg. So far a positive day with most ETFs above today’s VWAP. Keep in mind the majority of ETFs are all under the 10, 20, and 50 day. More new 20-day lows. RSI’s are getting under 30 so that’s an oversold sign.
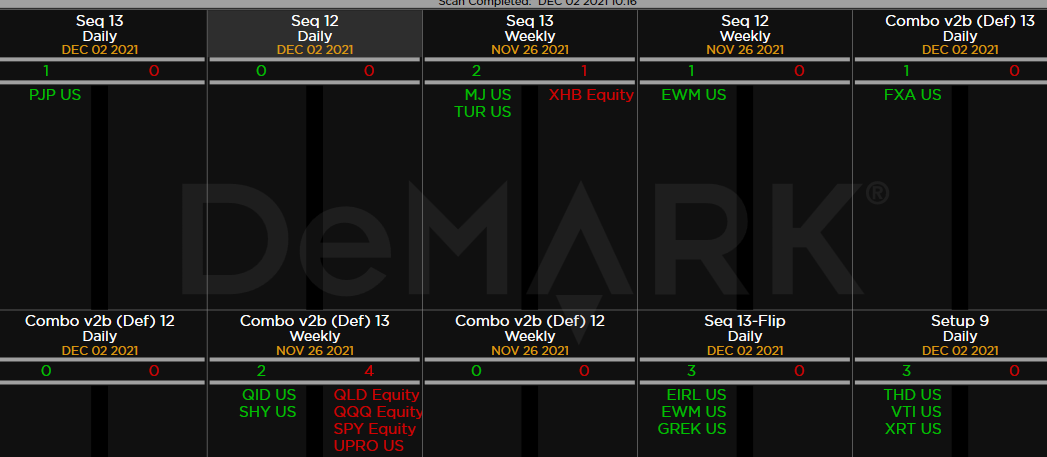
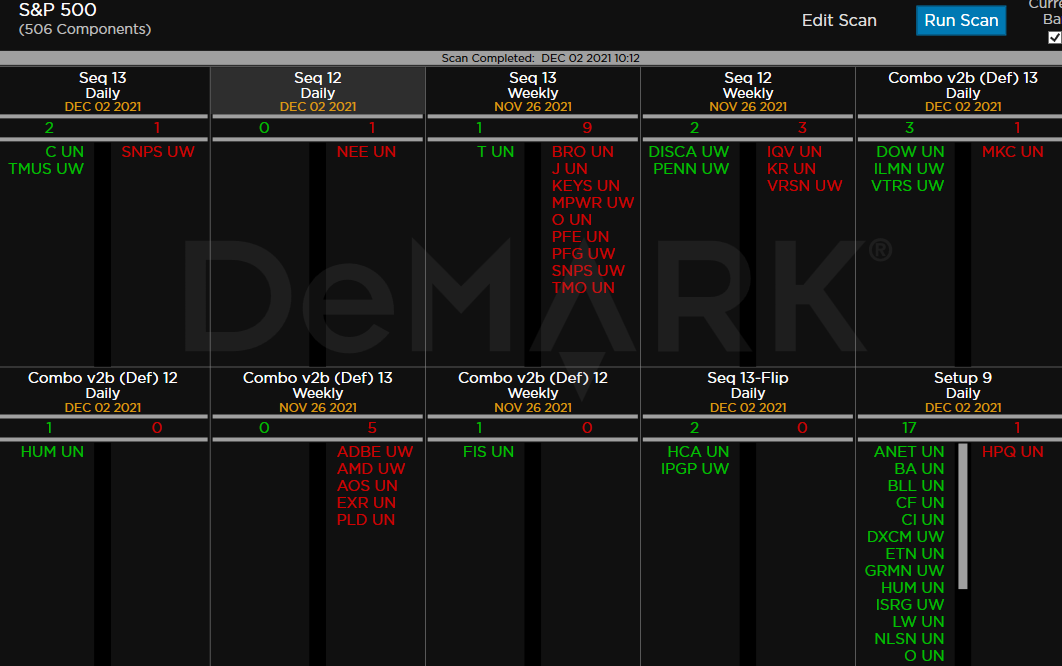
demark observations
Within the S&P the DeMark Sequential and Combo Countdown 13’s and 12/13’s on daily and weekly time periods.
I’ve been wanting to buy Citi for a while. The last 13 didn’t have all that I wanted with RSI still moving lower. Now the RSI is oversold so I’m starting a new long idea with C 3% size.
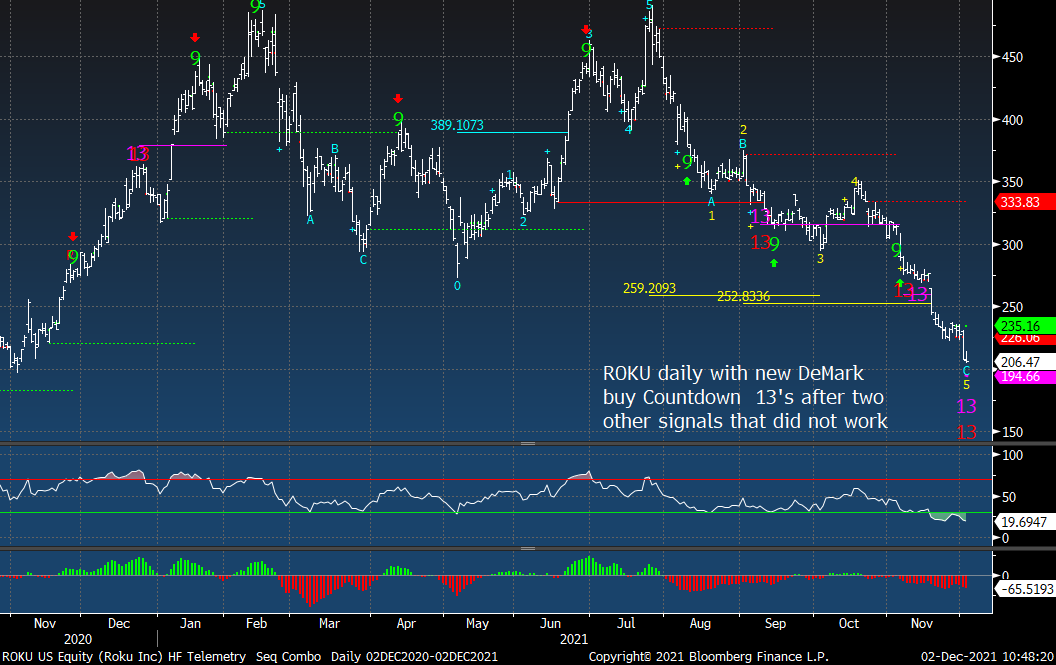
ROKU was a short idea that worked out well however I covered it too early. Now it’s getting very oversold. I’m watching it for a long entry. This will be a tax loss candidate and it might be a few more weeks of selling.
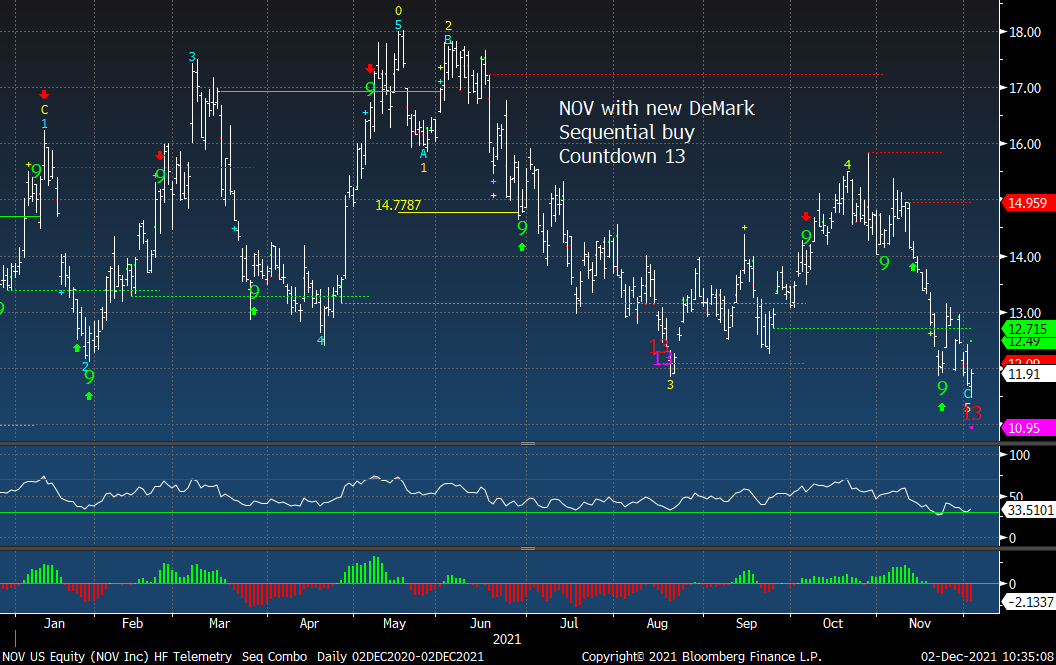
NOV has a Sequential buy Countdown 13. I’ve been long and short this over the last year. I might be a little nervous looking at the energy ETFs and knowing the seasonality is weak right now.
I’m adding a 3% short position with PFE with the daily and weekly exhaustion signals that have worked well in the past.
ETFs mostly quiet.