Today’s market action globally is ugly. It’s been ugly and it’s getting very oversold. I still do not have DeMark exhaustion signals as I would want to increase conviction that a bottom is at hand. One thing I’ve noticed is the downside wave pattern on many indexes, ETFs, and equities are in wave 3 of 5. I have discussed one of the most useful parts of Elliott Wave for me has been to identify which wave is currently in progress and if we can check off the mood and what is happening.
Wave three is usually the largest and most powerful wave in a trend (IT’S BEEN A LARGE DROP – CHECK). The news is now negative and fundamental analysts start to lower earnings estimates. (NOT QUITE THERE YET) Prices drop quickly (CHECK), corrections are short-lived and shallow (IT’S ONLY BEEN 3 WEEKS SINCE THE S&P TOPPED – CHECK). Anyone looking to “get short in bounces” will likely miss the boat. As wave three starts, the news is probably still bullish (CHECK), and most market players remain positive (CHECK); but by wave three’s midpoint, “the crowd” will often join the new bearish trend. (CHECK)
What comes after wave 3? A corrective lower high wave 4 bounce will qualify with a 13 day closing high. Then it should fail and wave 3 low will break moving into the final wave 5 low.
The overwhelming sentiment I have heard and seen is everyone wants to buy the low. People are anxious about missing the low and not as much with the potential losses they currently have.
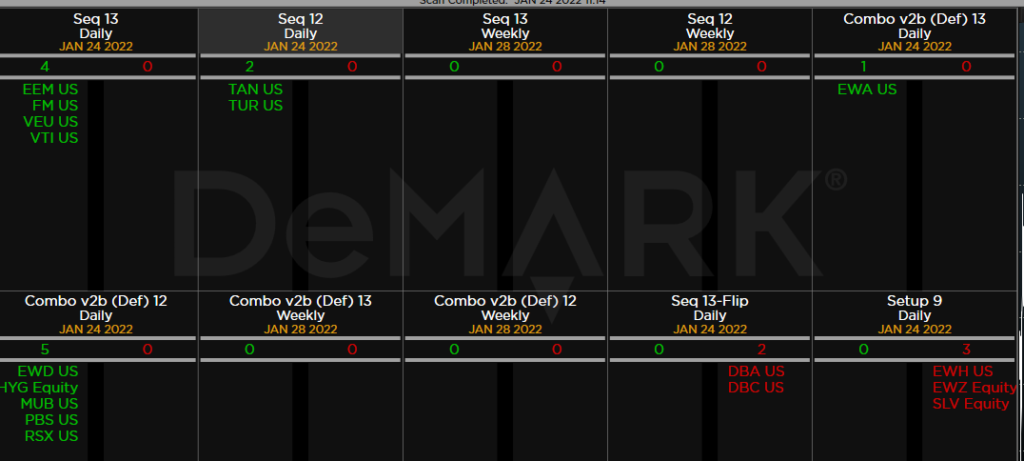
Breadth today is horrible, I mean dreadful. It can be a sign of capitulation. Volume is high. I have more internals with some starting to show clear oversold readings. And on the DeMark Screens, we are seeing more buy Countdown 13’s for a change. It’s still early but start your buy list.
I think tomorrow the market will bounce. For no reason. We’re in a catalyst-rich environment with Russia – Ukraine, Earnings, and the Fed. If someone feels they know what one of these catalysts will do with any certainty they are making a guess. Risk remains and face ripper bounces might be the next risk.
TRADE IDEAS
I’m taking off a lot of my short exposure. First, an update on the Feb 18 SPY and QQQ put spreads I recently recommended. SPY 450-425 put spread paid $4.70 now trading at $9.50 and QQQ 365-350 put spread paid $3.95 now trading at $13.50. I took off half last week with gains. These are now well under the lower strike and you can hold these with the hope for decay in premium with the lower strike or take profits now. I’m talking profits now.
Cover half TSLA with a 7.1% gain. (2.5% will stay on the sheet) Cover half XLY with a 7.3% gain (2.5% will stay on the sheet). Cover XLK with a 2.1% gain. Cover half SMH with a 5.2% gain (2.5% will stay on the sheet) Cover half of both HD +9.5% (2.5% will stay on the sheet) and PFE with a 9% gain (2% will remain on the sheet). Cover ANTM with a 3.3% gain.
I am adding SPY, QQQ, IWM trading longs with 5% sized positions. Keep in mind I will be taking these off ASAP if this market breaks again.
Tomorrow and in the next few days I will likely be adding back short exposure and perhaps more put spread ideas.
US MARKET SENTIMENT
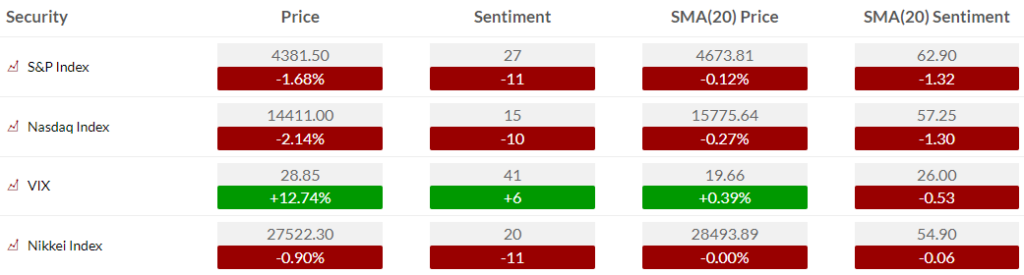
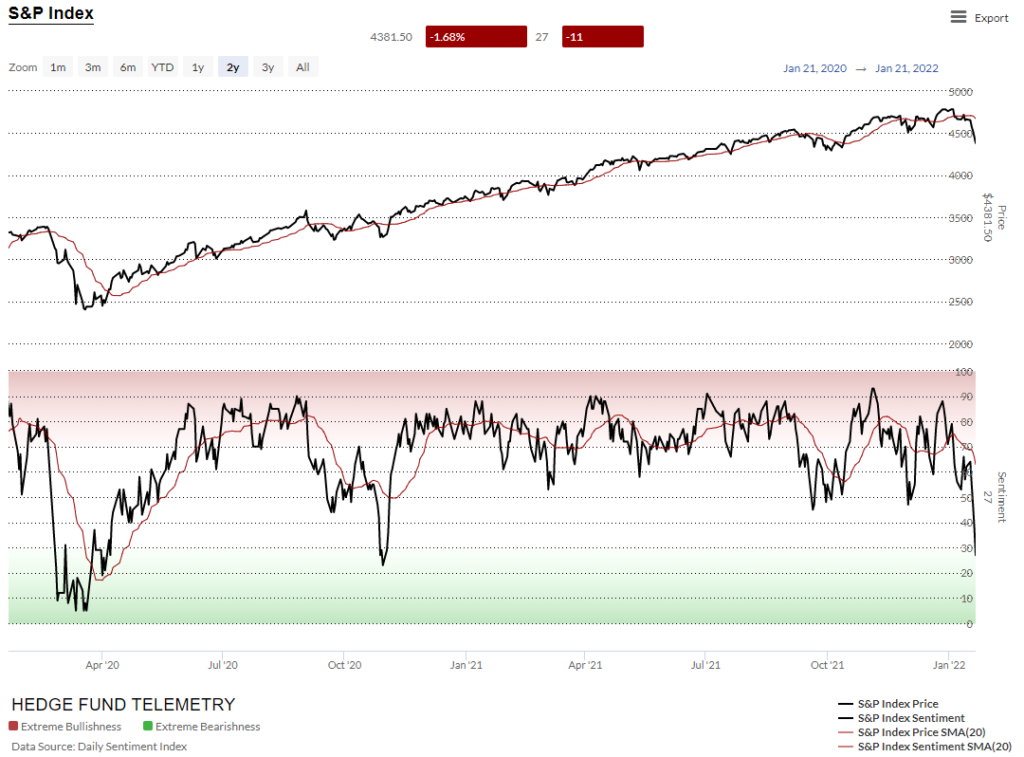
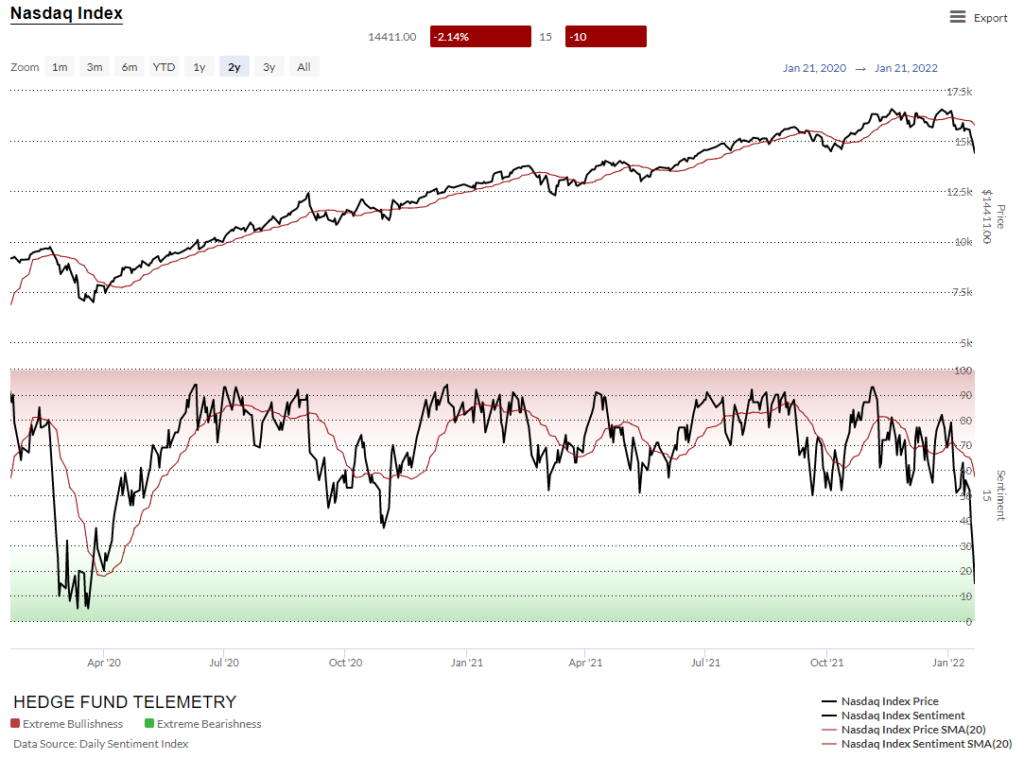
Here is a primer on how we use Daily Sentiment Index charts. S&P bullish sentiment and Nasdaq bullish sentiment should have interesting readings later today. Getting oversold
Bond bullish sentiment
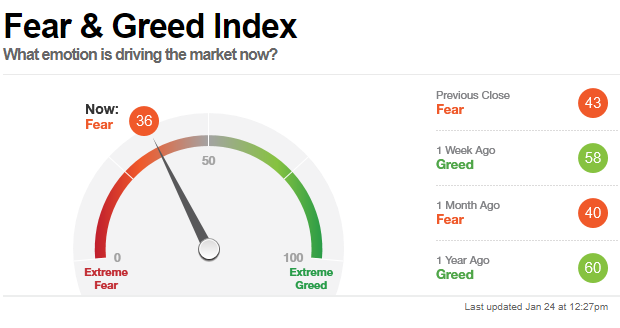
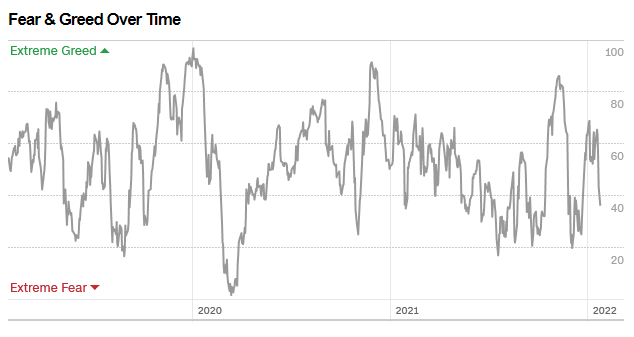
CNN Fear and Greed index is not oversold. I like this because it shows what traders are doing rather than what they are saying
US MARKETS
Here is a primer on the basics of the DeMark Setup and Sequential indicators.
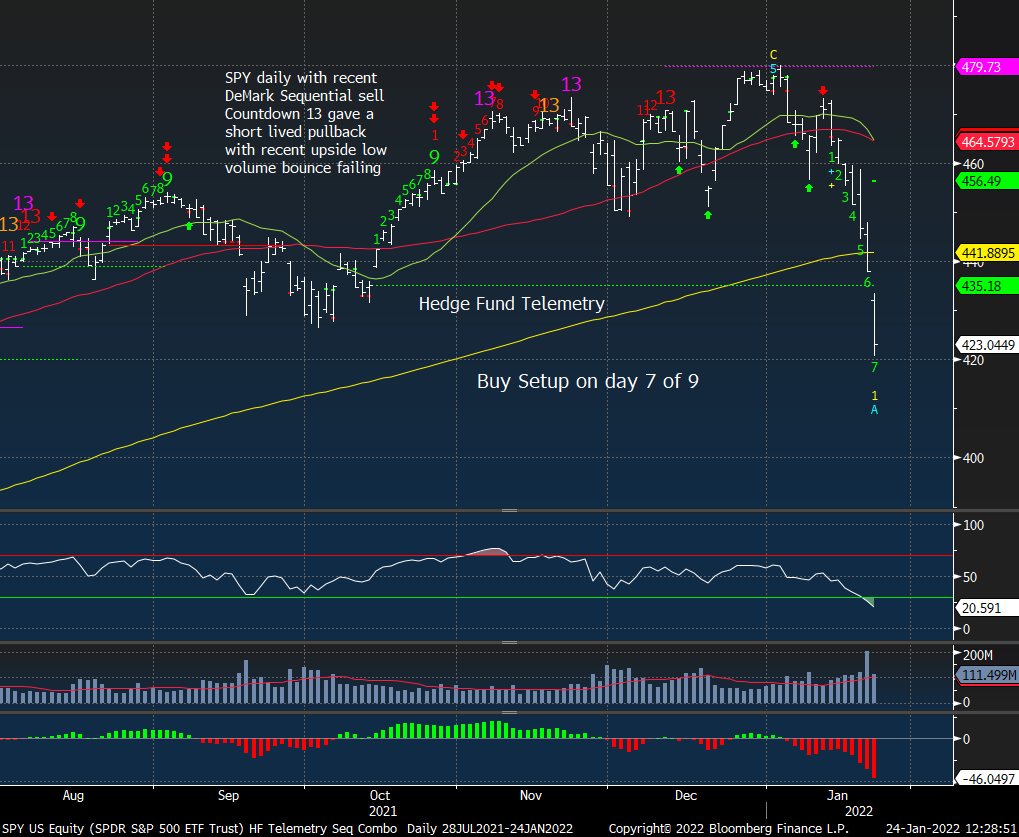
S&P 500 daily gapped down again and typically that’s very bad which leads to continuation there is that potential. 22 RSI is very oversold.
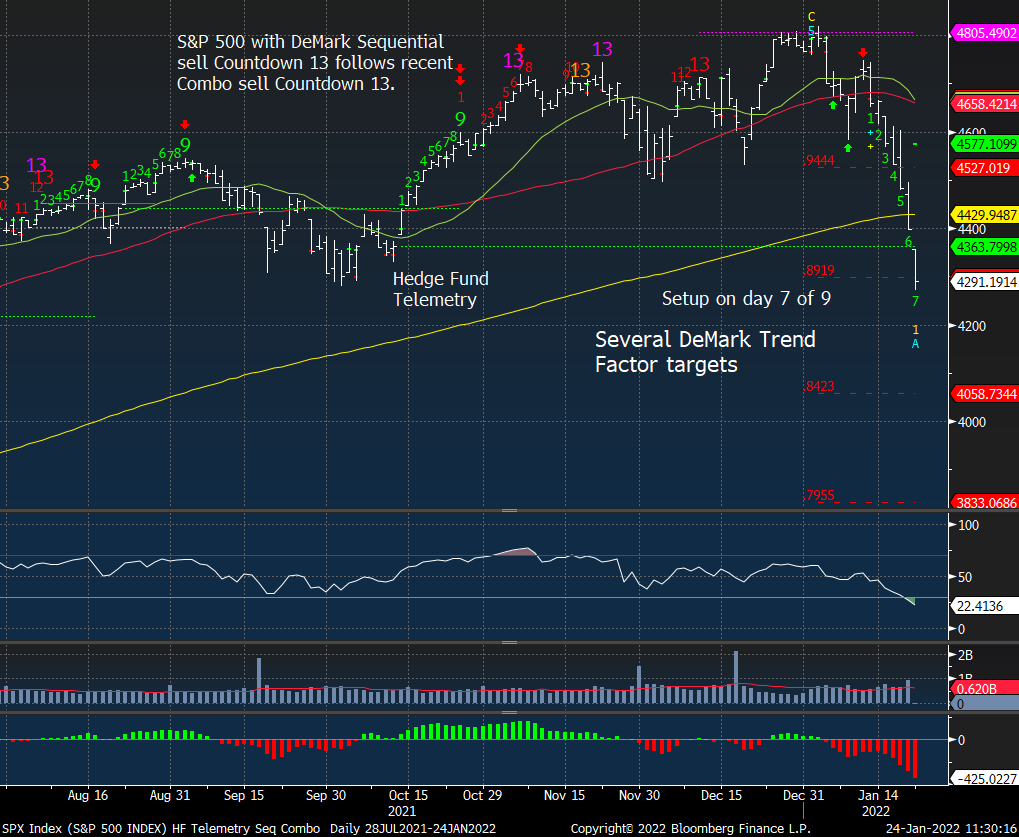
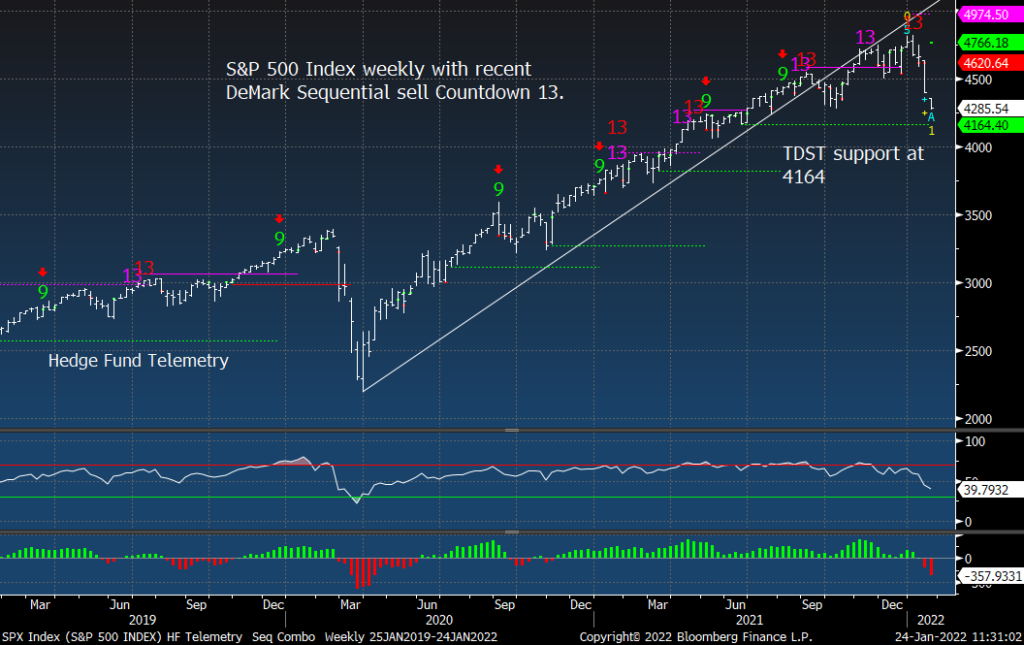
S&P 500 weekly did have a recent DeMark Sequential sell Countdown 13
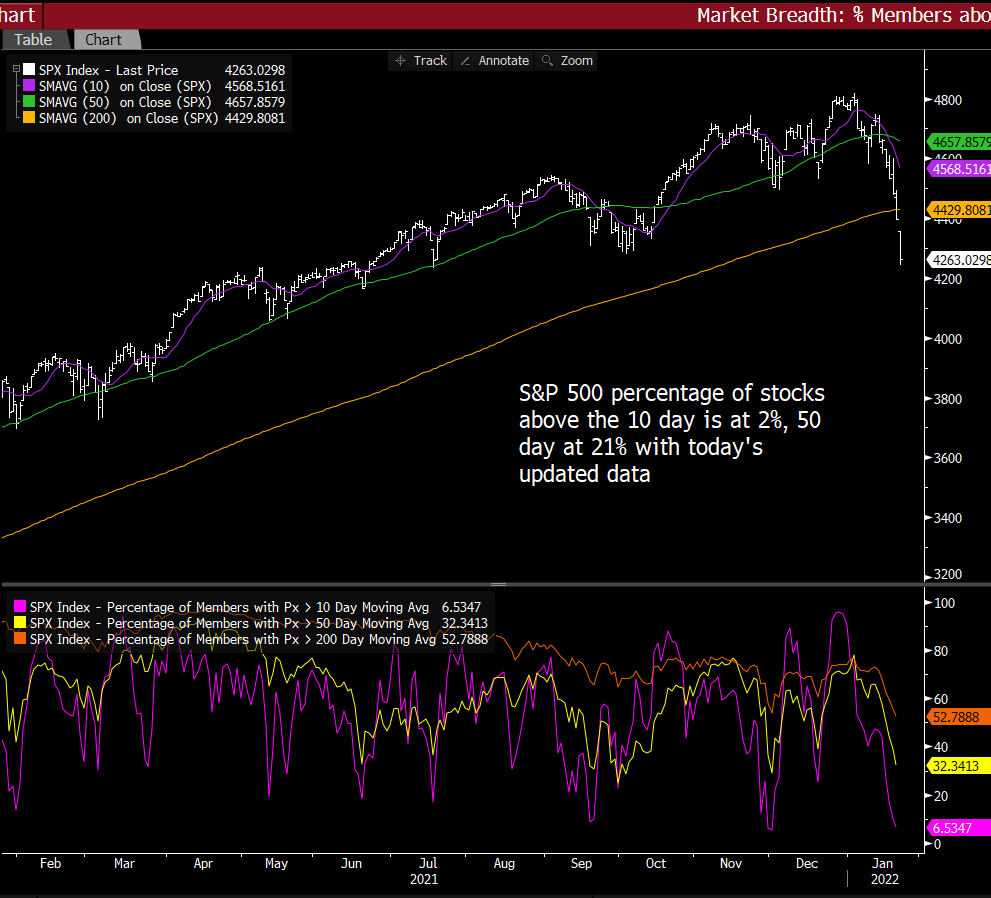
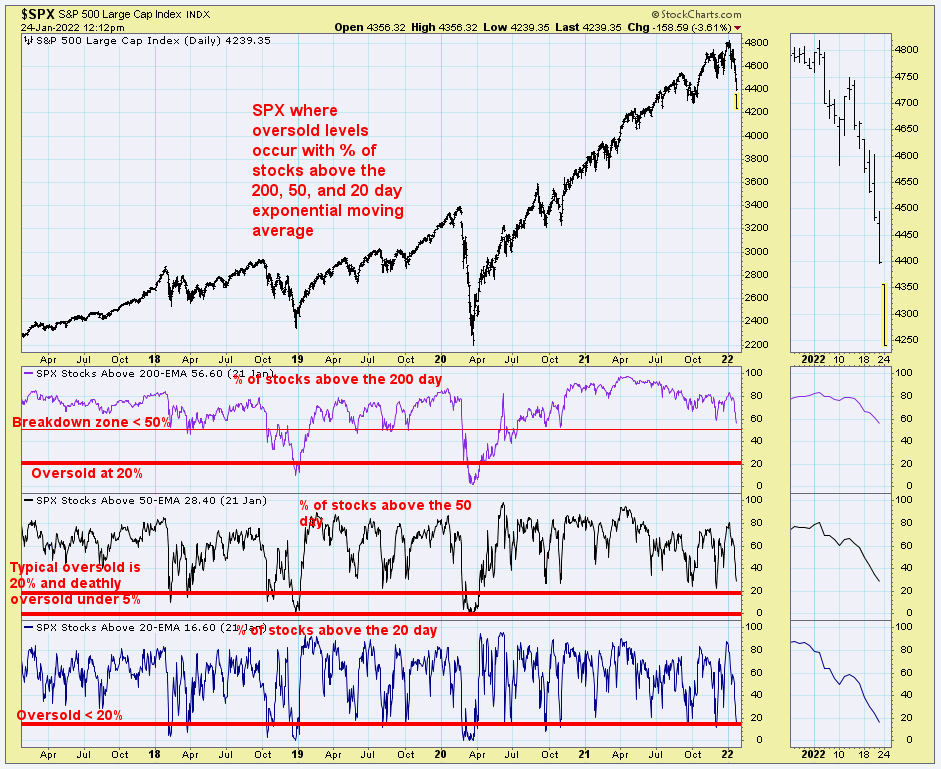
The percentage of stocks above the 10 and 50 day moving average is at oversold levels.
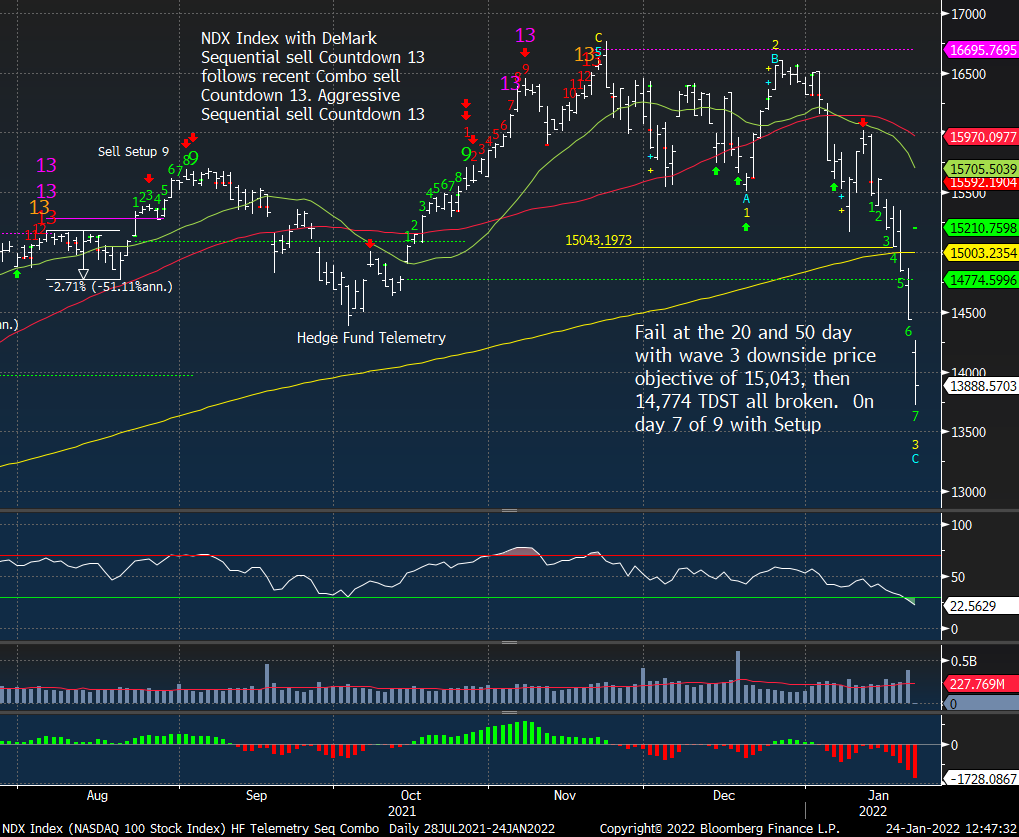
NDX index also with a very steep move. 22 RSI. Oversold but stability will take time
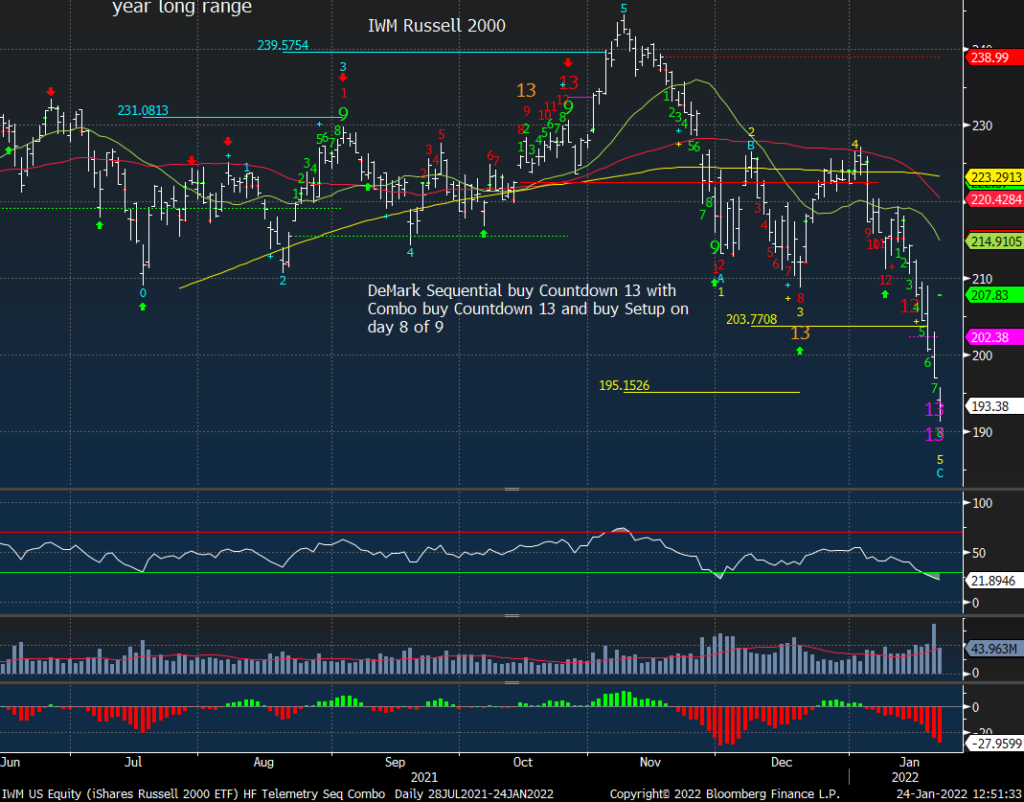
Russell 2000 IWM daily has several Combo buy Countdown 13’s
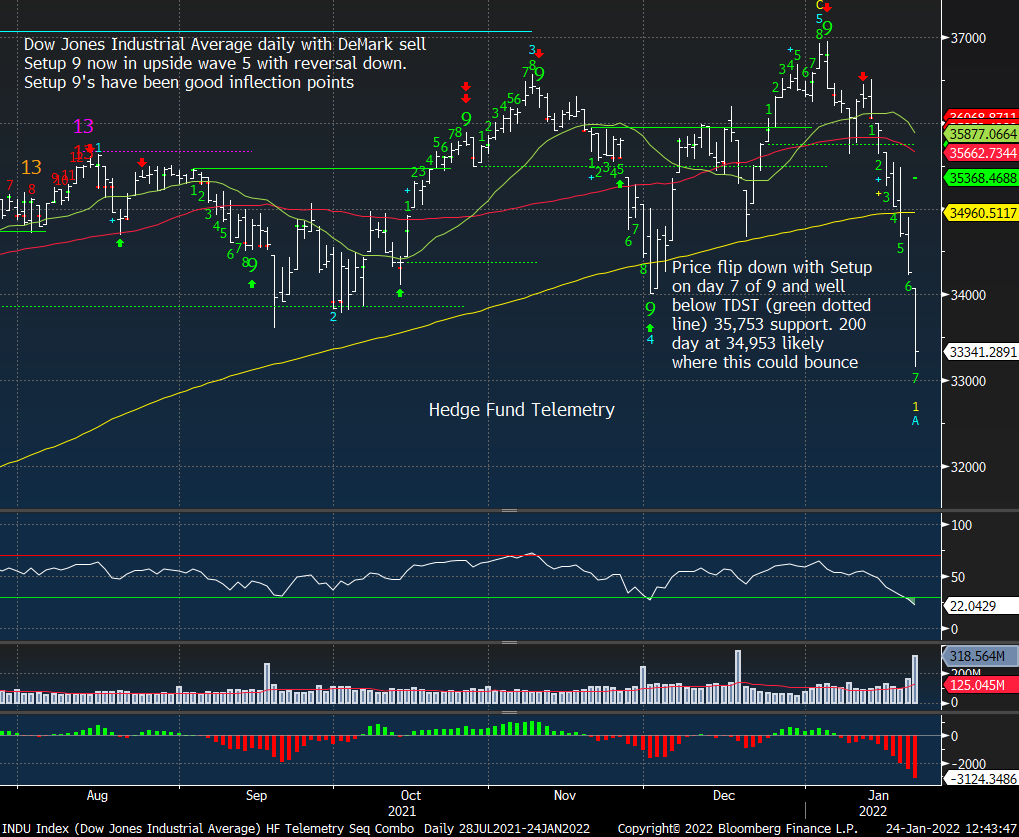
Dow Jones same as the others on day 7 of 9
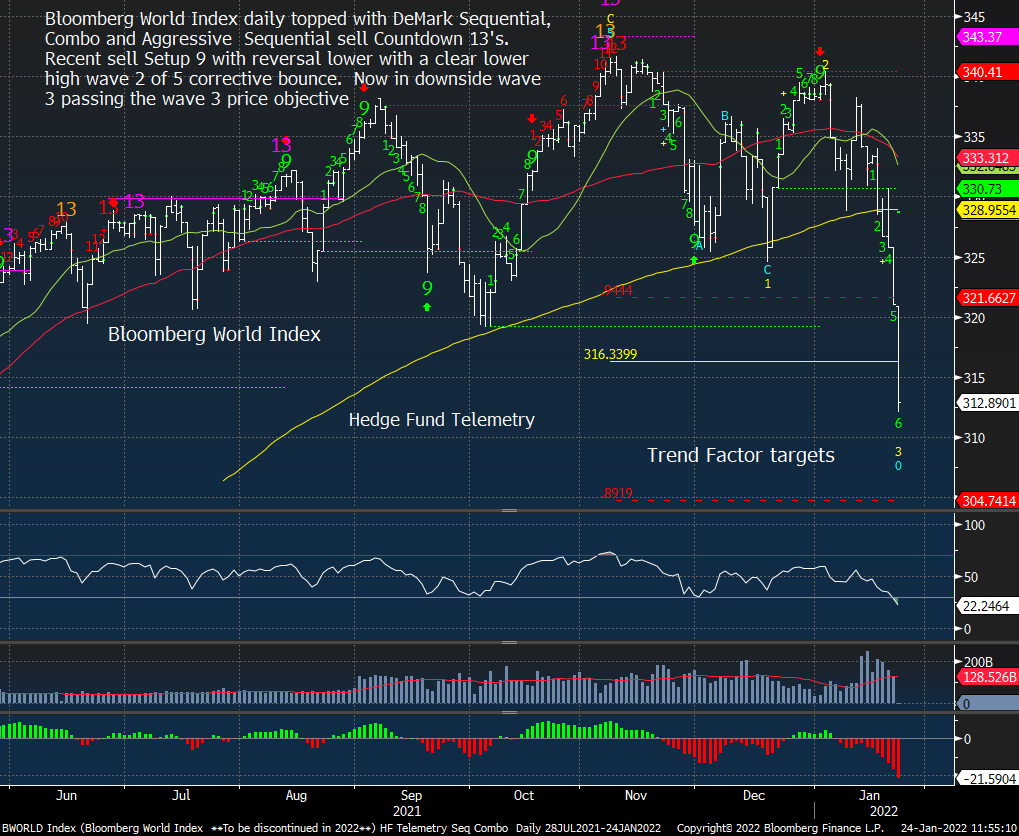
Bloomberg World Index – brutal
TODAY’S FOCUS – internals
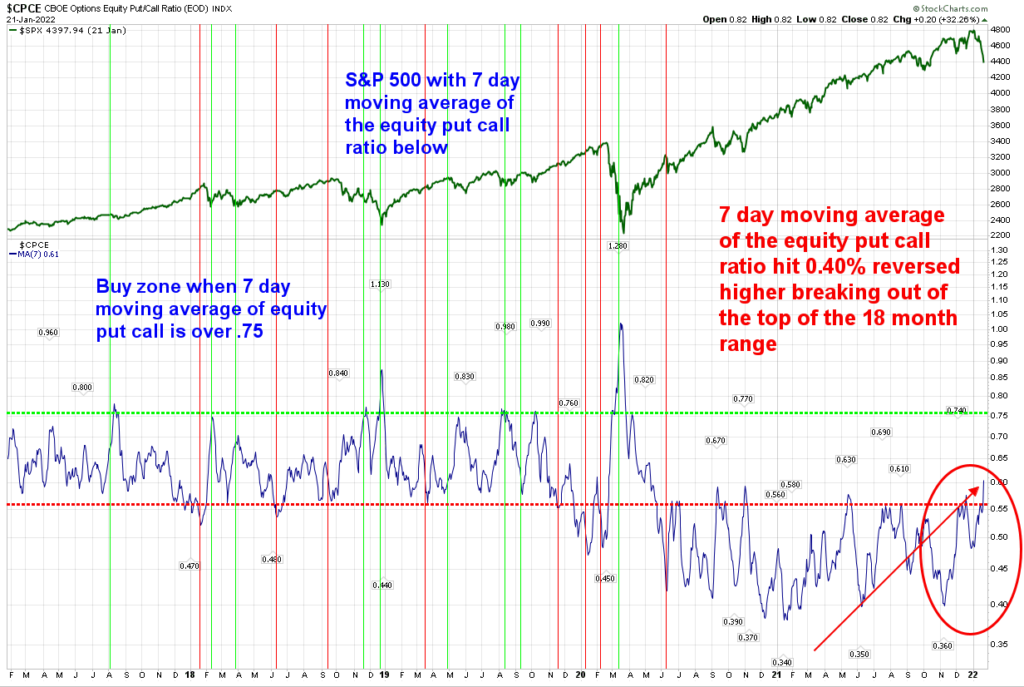
The 7 day moving average of the equity put-call ratio is lifting and made a higher high out of the 18 month range. Expect this to continue higher with the 7 day moving average. When this is rising put buying is increasing. It’s has been in a lowered range for the past 20 months. I have said “A significant move above the range would have the markets crashing” Well it’s above so partially right
This shows the 20 and 50 day on the bottom and these are oversold. Friday’s readings.
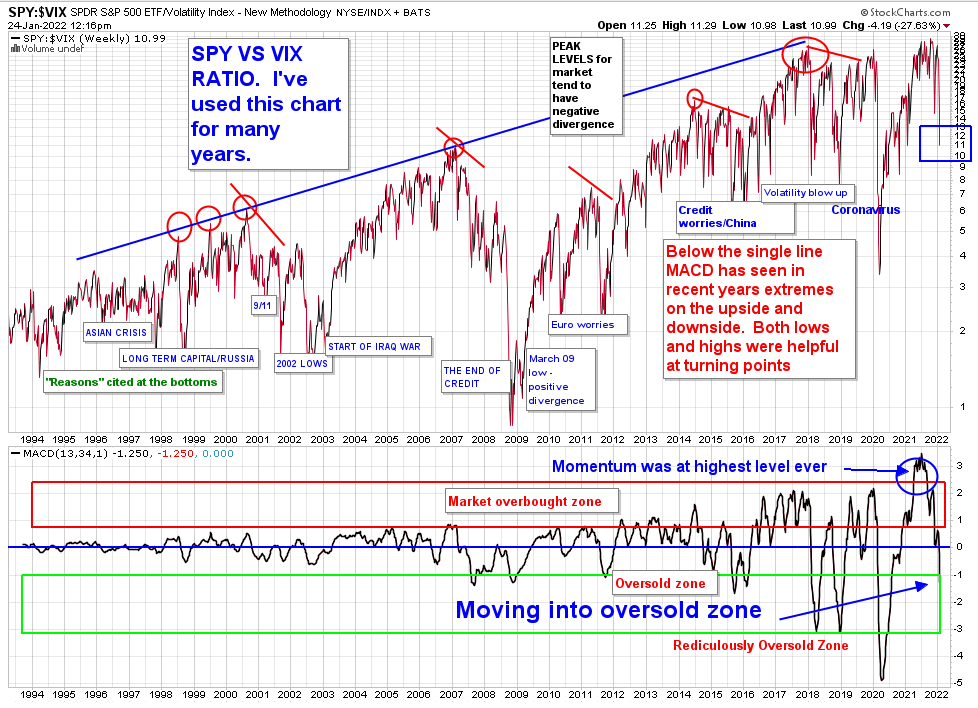
SPY vs VIX weekly is a chart I created 20 years ago. This move is far from Covid days however the momentum was at the highest level ever in late 2021. It’s coming into the oversold zone
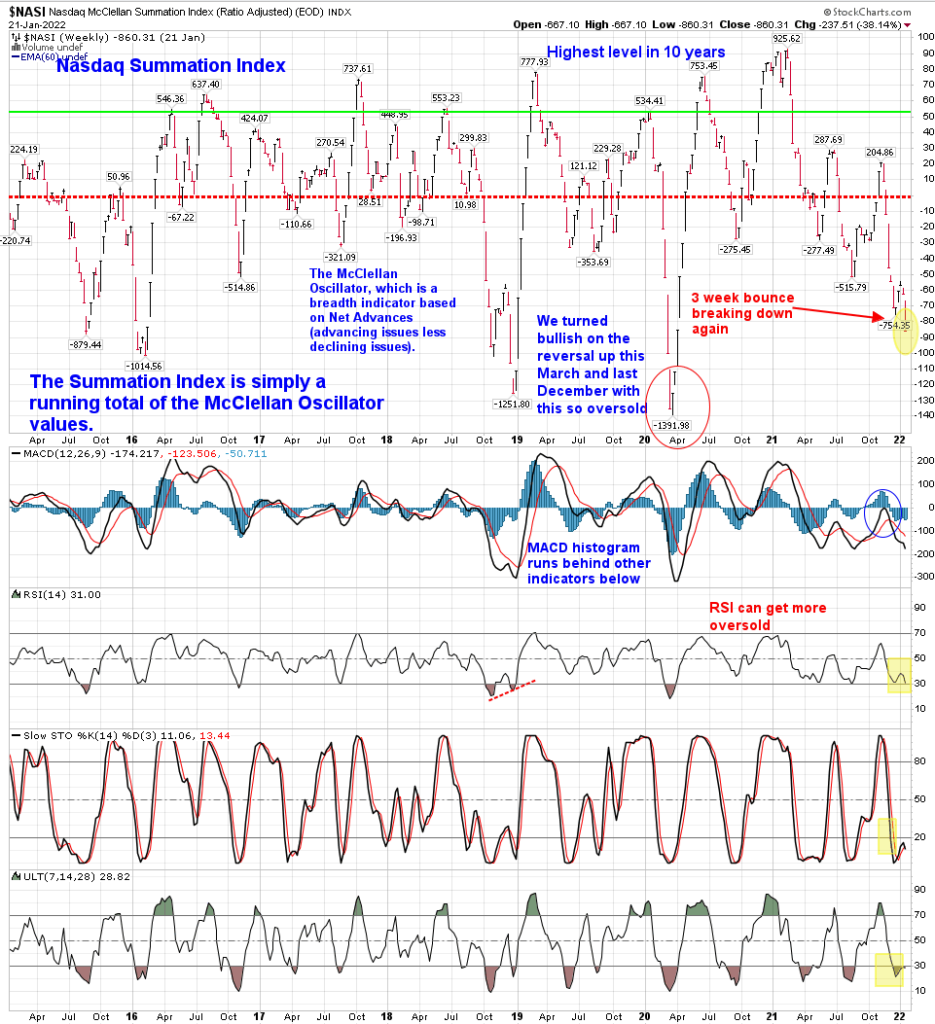
Nasdaq Summation Index weekly is oversold however it can and probably will go lower. When this turns it usually is very fast and steep.
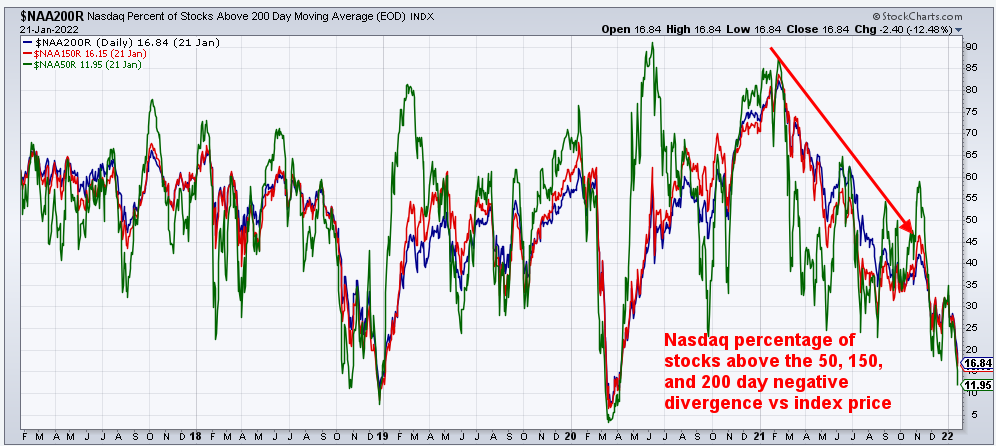
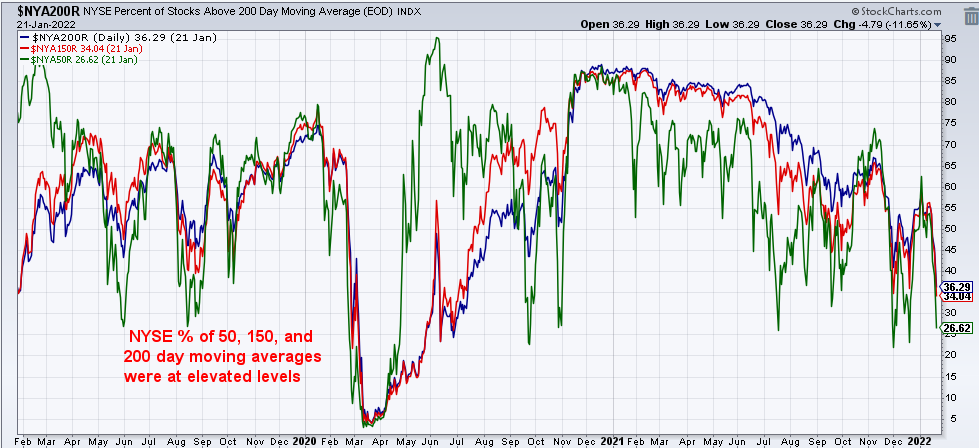
Both the Nasdaq Composite and NYSE percent of stocks above several moving averages is oversold
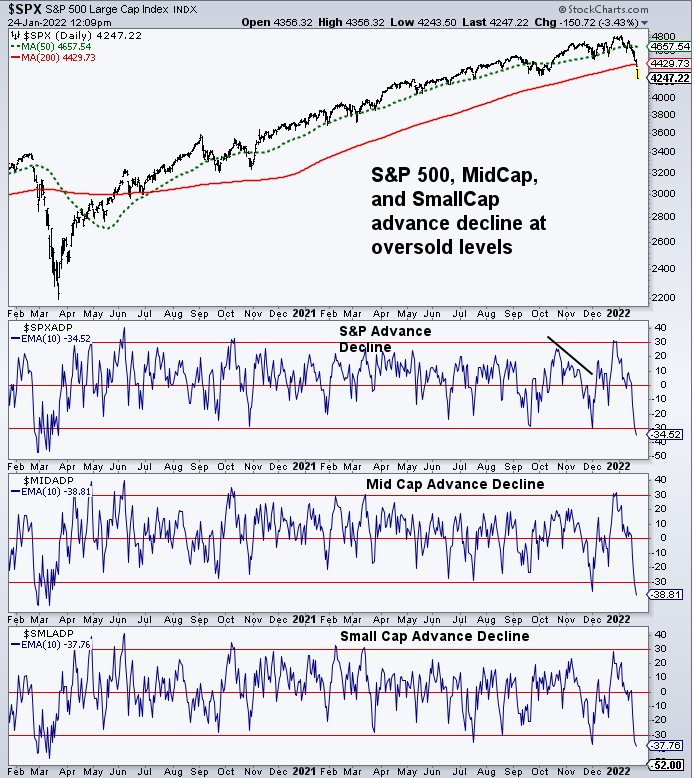
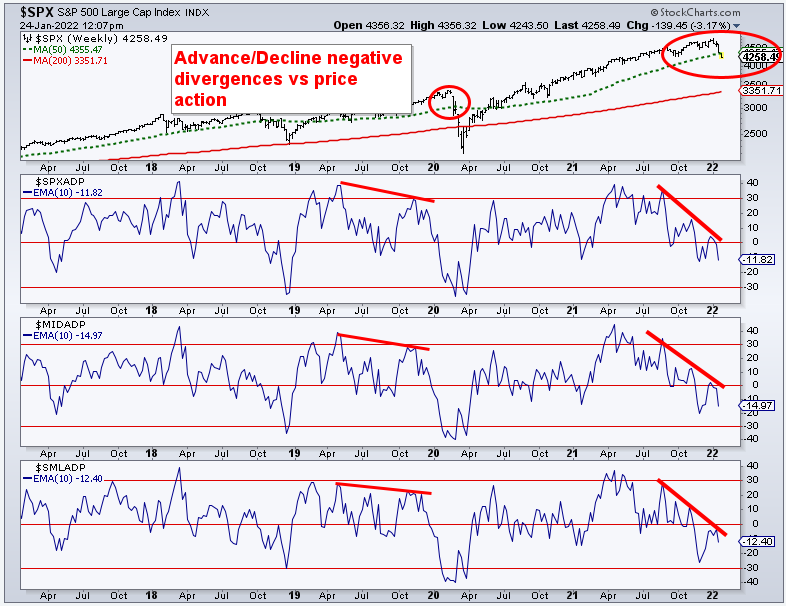
S&P, MidCap, and SmallCap advance decline on a daily time frame is oversold. The weekly below is not oversold enough.
bitcoin and ethereum update
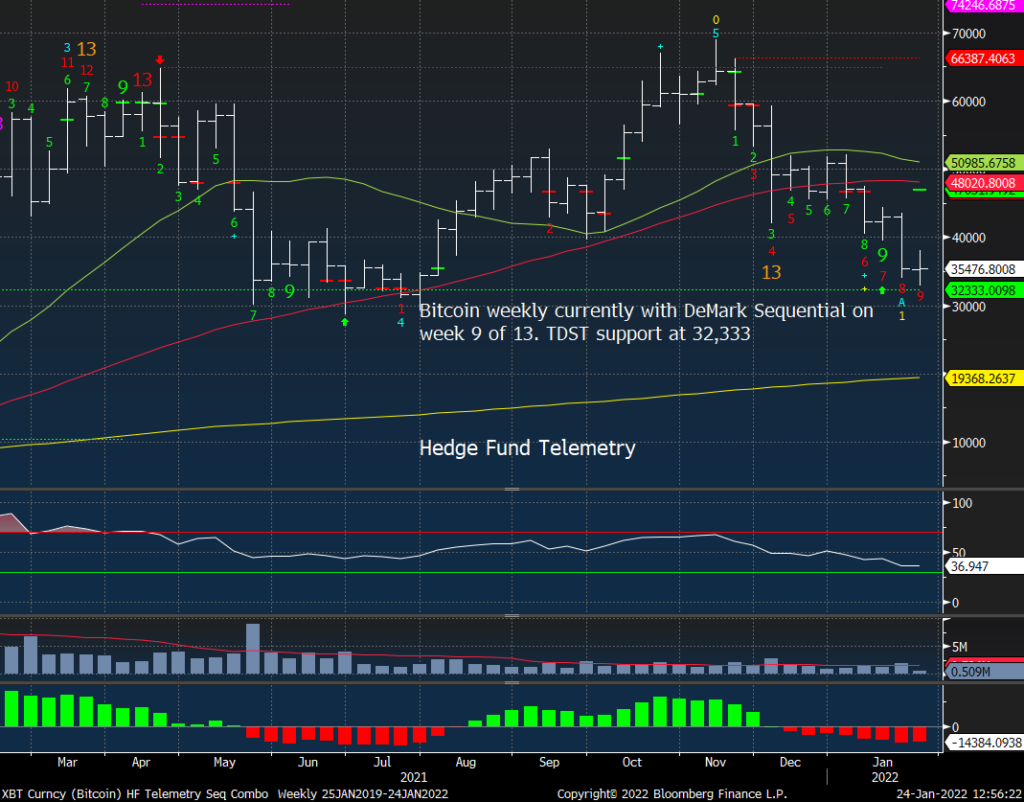
Bitcoin has a buy Setup 9 today and Combo buy Countdown 13 with a Sequential that remains in progress. A bounce from here is possible however the weekly below still has risk with a Sequential in progress. A lower low below 30k is likely just can’t say if that’s happening this week.
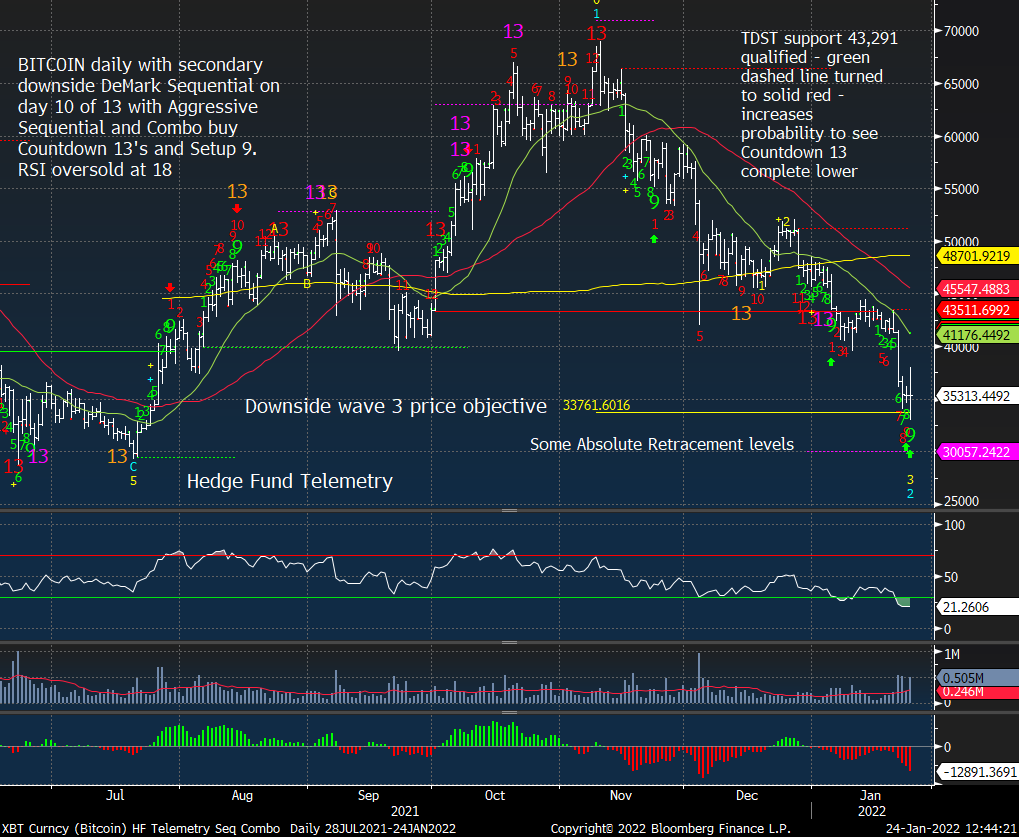
BTC Weekly
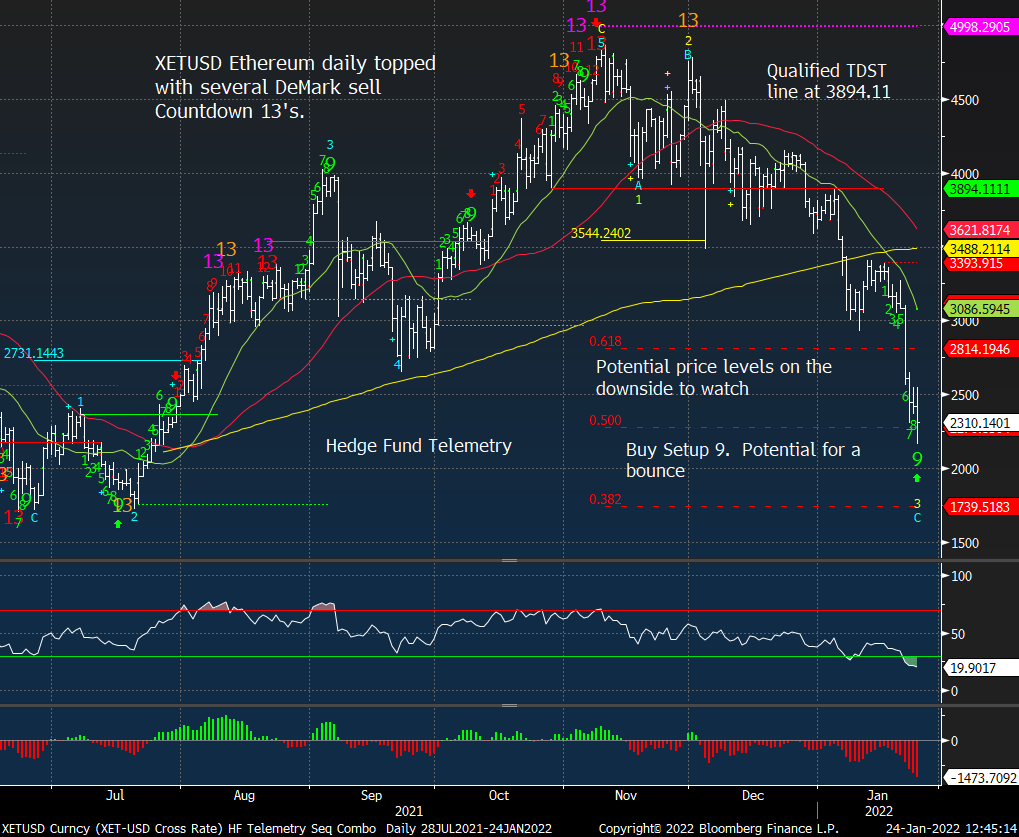
Ethereum has a buy Setup 9 and is very oversold. The risk is if this drops more and a new downside Sequential Countdown starts. A bounce from here is probable
US DOLLAR UPDATE
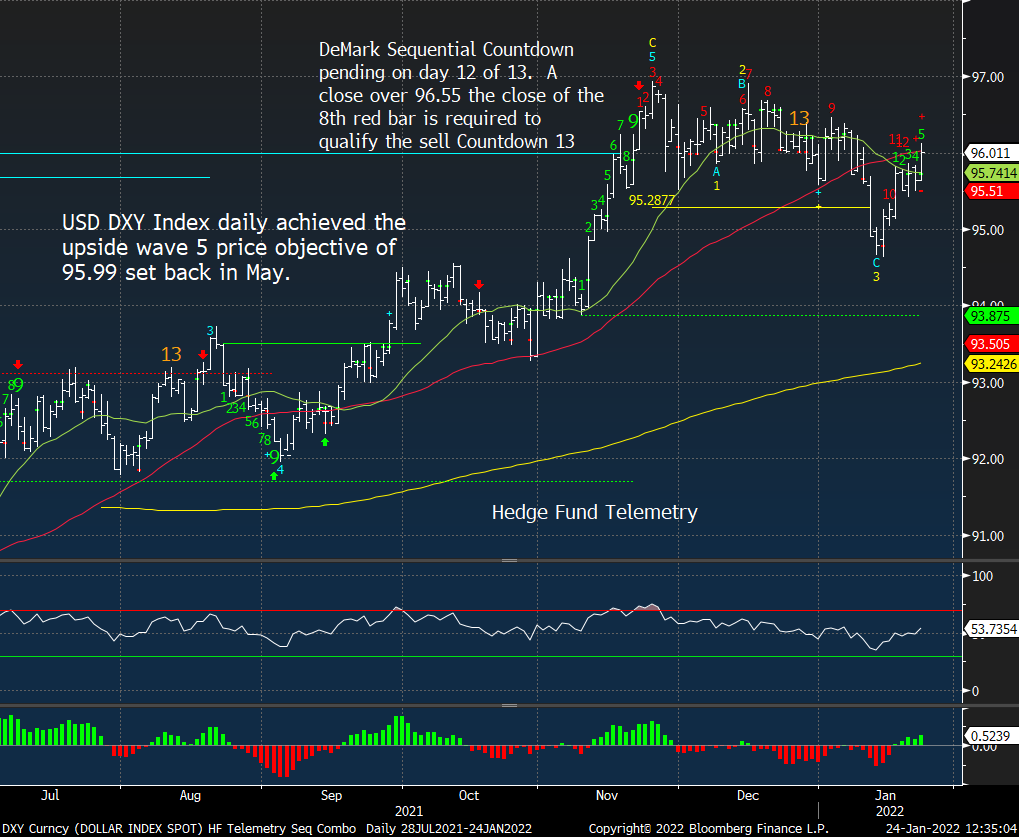
US Dollar Index needs a little more upside for both Sequential 13 and wave 4. Safe haven.
BOND UPDATE
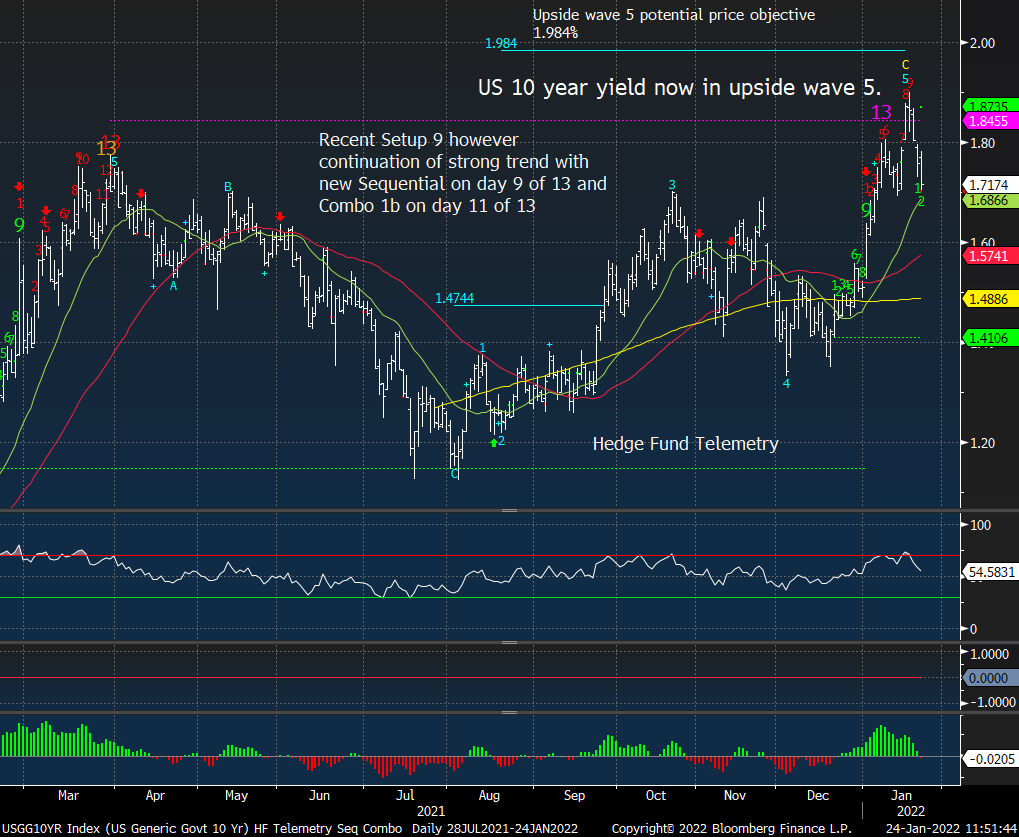
The US 10 year yield has backed off with equities under pressure. I am little surprised rates are not down more with the magnitude of the equity slam. It did get qualified into wave 5. There is a pending Sequential
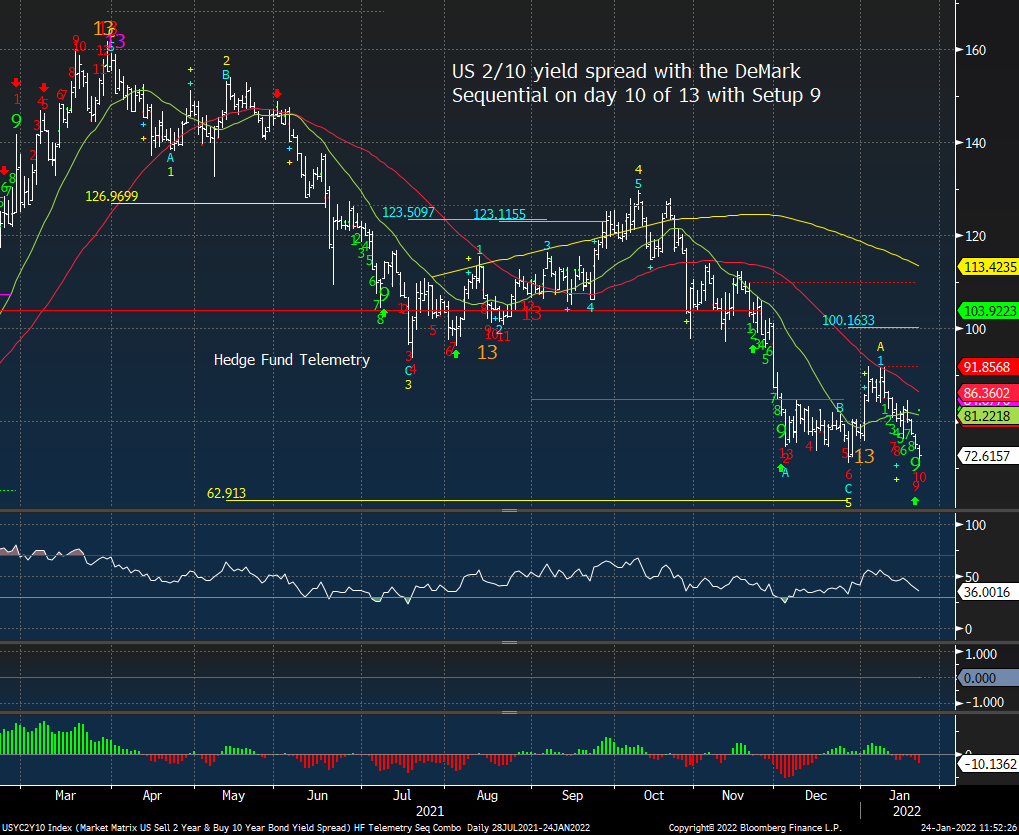
The 2/10 yield spread is flattening and is on day 10 of 13 with the Sequential. The 13 could be a big signal for the markets.
FACTORS, GOLDMAN SACHS SHORT BASKETS AND PPO MONITOR UPDATE
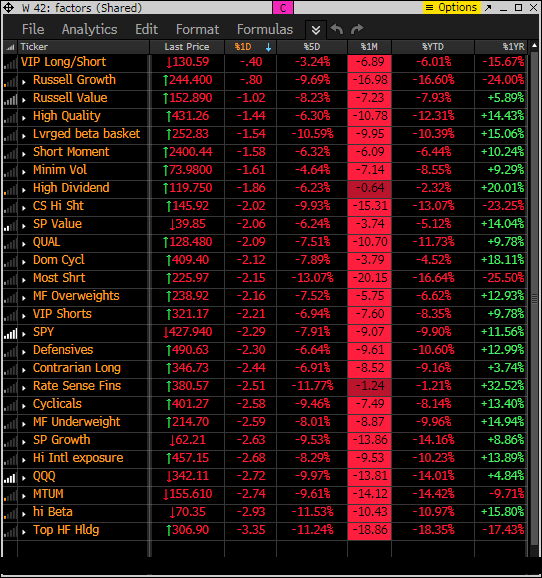
Factor monitor now has a reset YTD performance column. Factor monitor now has a reset YTD performance column. Everything is down today, 5 day, 1 month rolling, YTD. This is oversold.
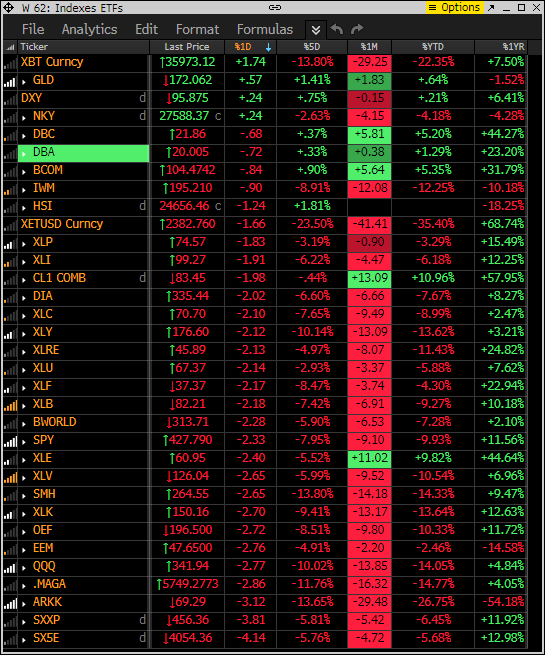
This is similar to the above monitor with various ETFs other indexes as I wanted to show the same 5 day, 1 month rolling as well the YTD and 1 year. They are clearly buying what is up recently and selling what has been down the most on the bottom.
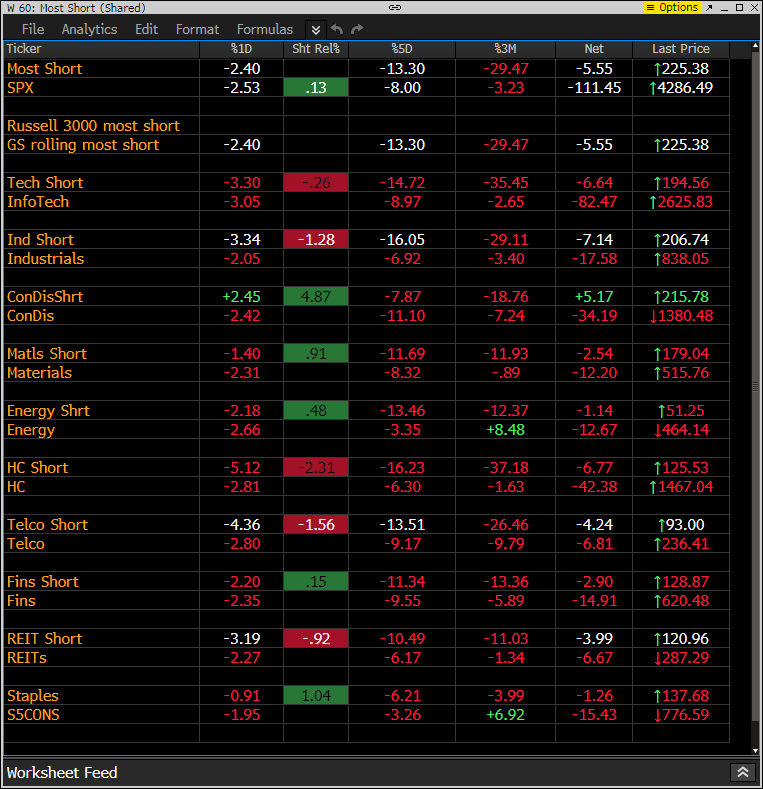
This is the monitor that has the S&P indexes and the Goldman Sachs most shorted baskets. Today the shorts are
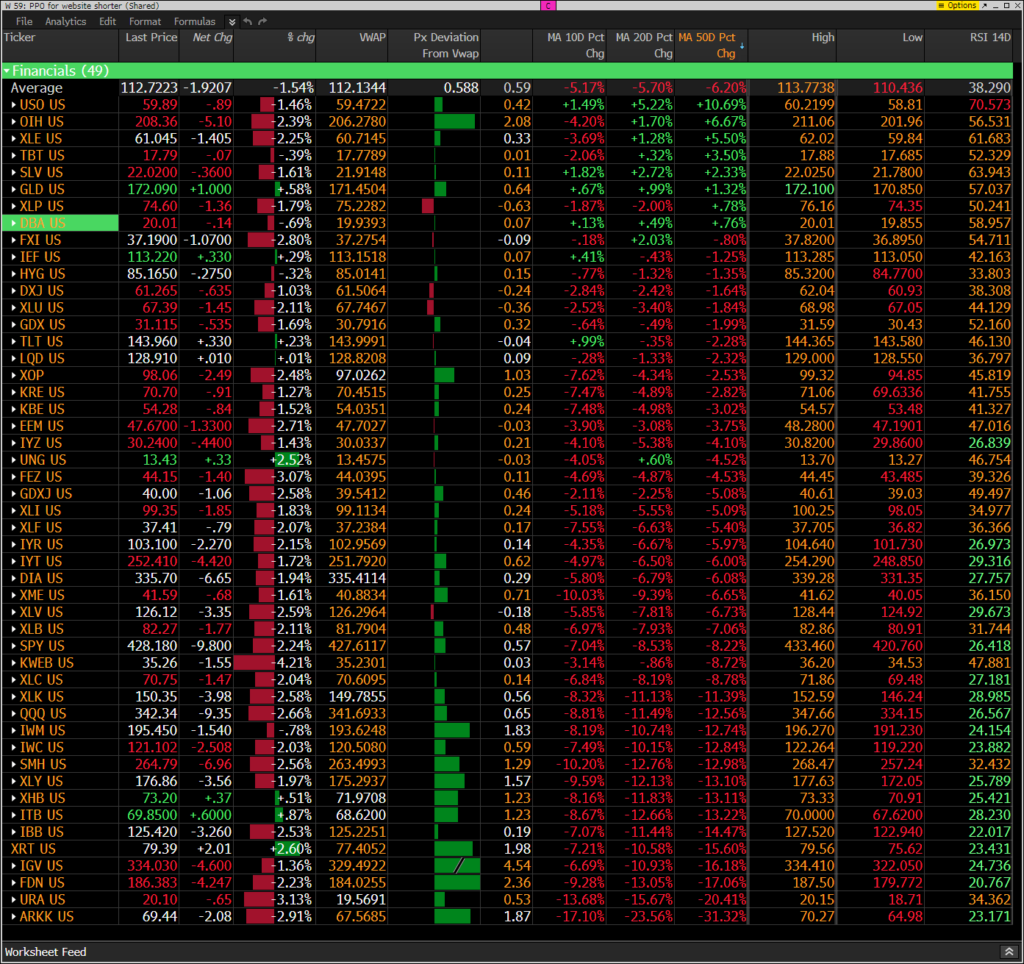
The PPO monitor (percentage price oscillator) force ranks ETF’s by percentage above/below the 50 day moving average. For information on this monitor please refer to this primer. This monitor is offered to Hedge Fund Telemetry subscribers who are on Bloomberg.
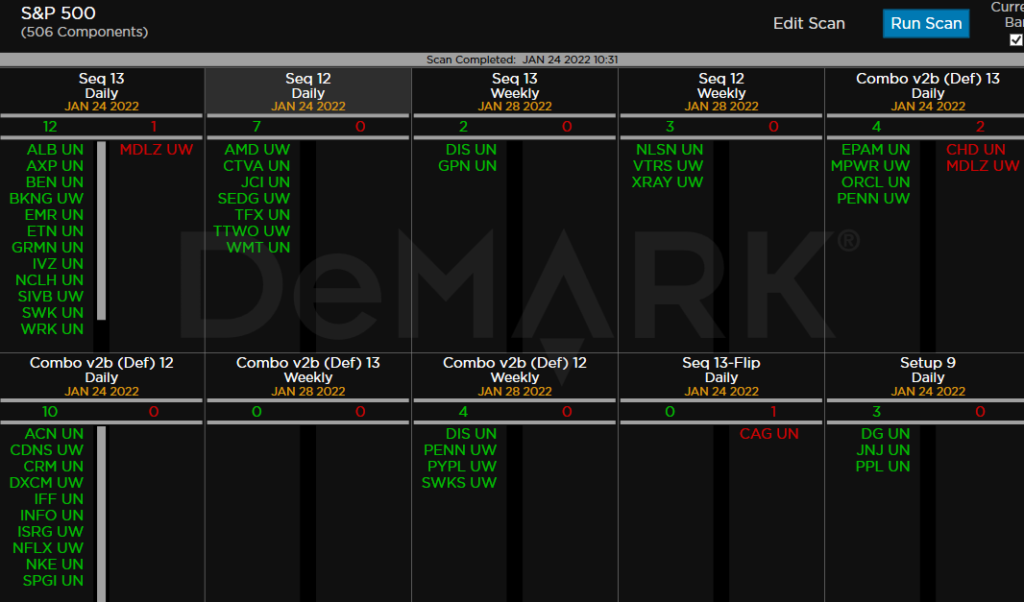
DEMARK OBSERVATIONS
Within the S&P the DeMark Sequential and Combo Countdown 13’s and 12/13’s on daily and weekly time periods. For information on how to use the DeMark Observations please refer to this primer. Worth noting: Hey look at this! We are now starting to see new buy Countdown 13’s developing. Put these on your buy list
ETFs among a 160+ ETF universe. Seeing a few buy signals starting to develop. Wait for price flips up for more confirmation. A “price flip” is defined as a contra-trend move identified by a close that is higher/lower than the close four price bars earlier.