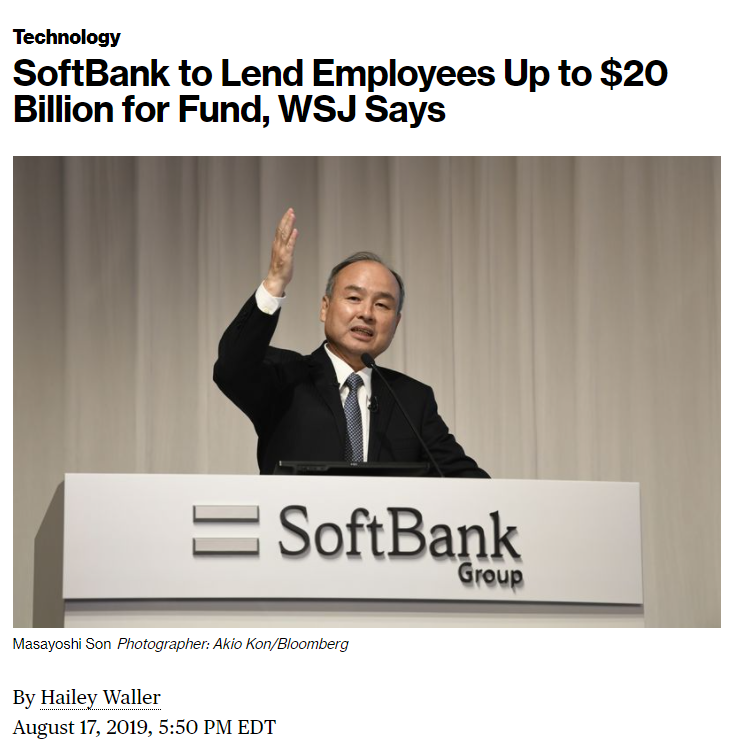
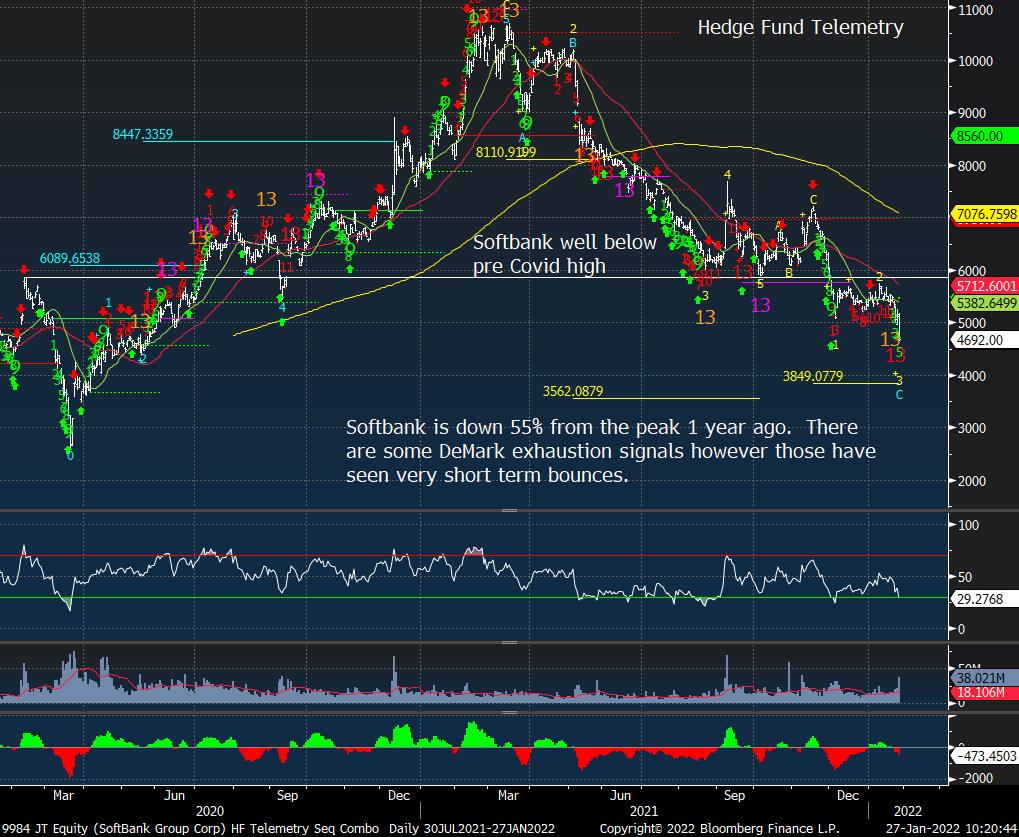
Softbank in Japan looks like it’s imploding and has been diving for all of 2021. The stock is down 55% from the highs while markets have soared including the Nikkei. From Wikipedia: SoftBank Group Corp. is a Japanese multinational conglomerate holding company headquartered in Minato, Tokyo, and focuses on investment management. The Group primarily invests in companies operating in technology, energy, and financial sectors. It also runs the Vision Fund, the world’s largest technology-focused venture capital fund, with over $100 billion in capital. Fund investors include sovereign wealth funds from countries in the Middle East.
How do you think the sovereign wealth funds are feeling after backing Masa and Softbank? Sovereign wealth funds are sticky investors with nearly unlimited funds but there comes a point when even they can start to sweat over a big investment.
My friend Dave Lutz at Jones Trading has been watching this and today I thought I write about it. Softbank was founded in 1981 by Masayoshi Son as a software company and turned into a publishing company and then invested in internet companies notably Yahoo then Ali Baba. Masa still leads the company today. Today the holding company and the Vision Fund holds positions in hundreds of companies – many public and who knows how many private. The formula has worked through many turbulent times as a big winner lifted the stock higher. In boom economies with disruptive companies going public Softbank thrived. So why is the stock down 55% off the highs a year ago when the markets have been so strong?
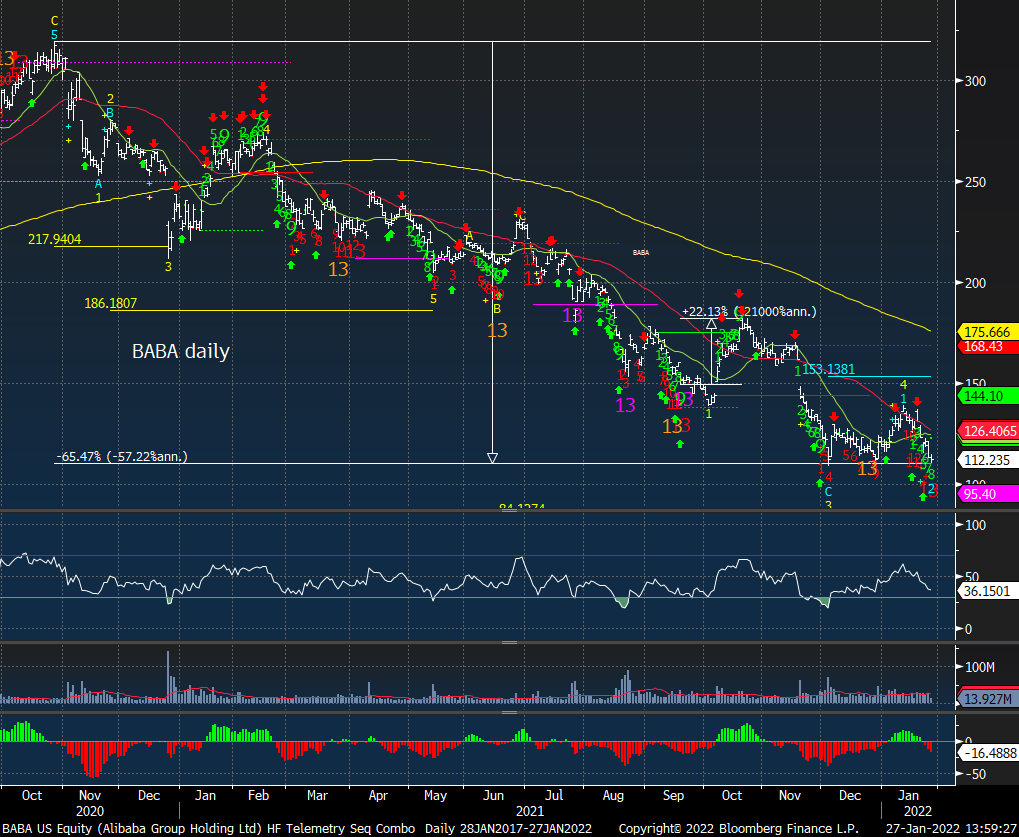
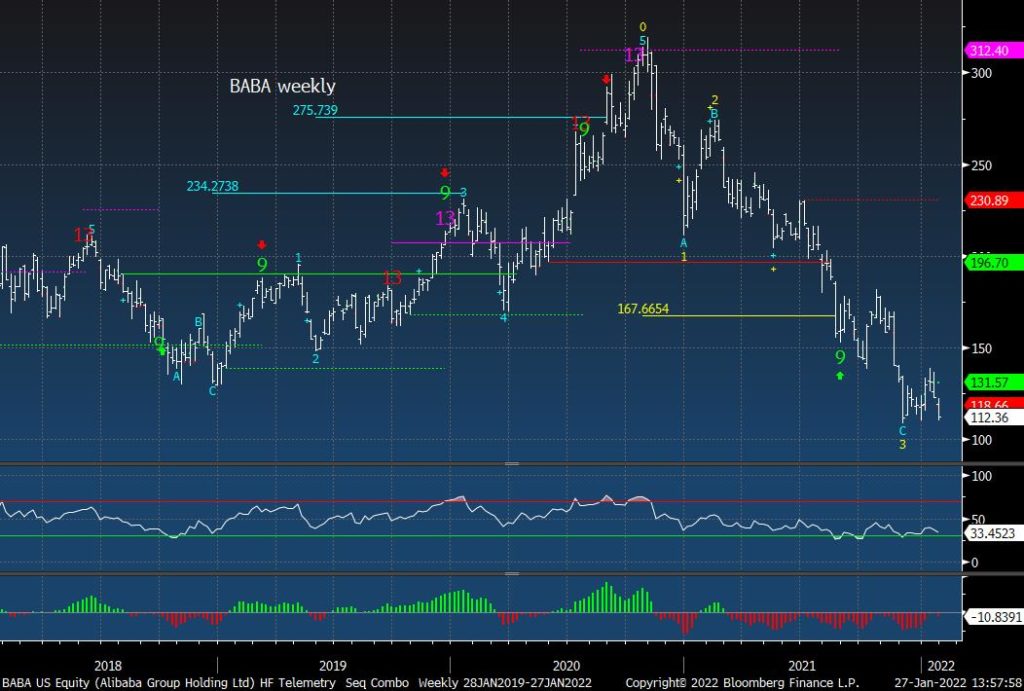
Softbank has a mega 25% sized position in Ali Baba and large percentage weights in other companies throughout the world that all have similar downward patterns. Ali Baba is down 65% from the highs in late 2020. It still has a $325 billion market cap. We know the war China’s government has waged against Ali Baba and other tech giants so no need to rehash. To have a 65% drawdown it’s over a $100 billion paper loss from the highs. The amount of other companies within the Softbank portfolio has seen drawdowns that would be incredibly tough to calculate. Let’s just say to put it simply – it’s a shit ton of losses.
Softbank also has debt and leverage among the insiders. The total debt to total assets is 42.7% and the debt to common equity is at 201% according to a quick glance on Bloomberg. Then there’s this:
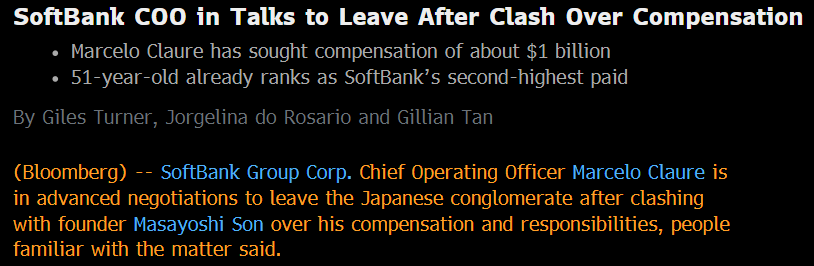
The COO is threatening to leave unless he’s compensated $1 billion and it’s rumored he asked for $2 billion the last time he threatened to leave. He sold his telecom company to Softbank years ago and stayed on to integrate all of the mergers of telecom companies and oversees the Vision Fund. It was reported under Claure’s leadership that has backed 48 companies it generated an internal rate of return of 85% in dollar terms. The company said this last September. Those that understand IRR with private equity know-how marks can be valued at elevated ambitious levels and also those that have been in a PE fund when things turn down the IRR can collapse. I can’t imagine the current IRR or if they would ever divulge realistic valuations.
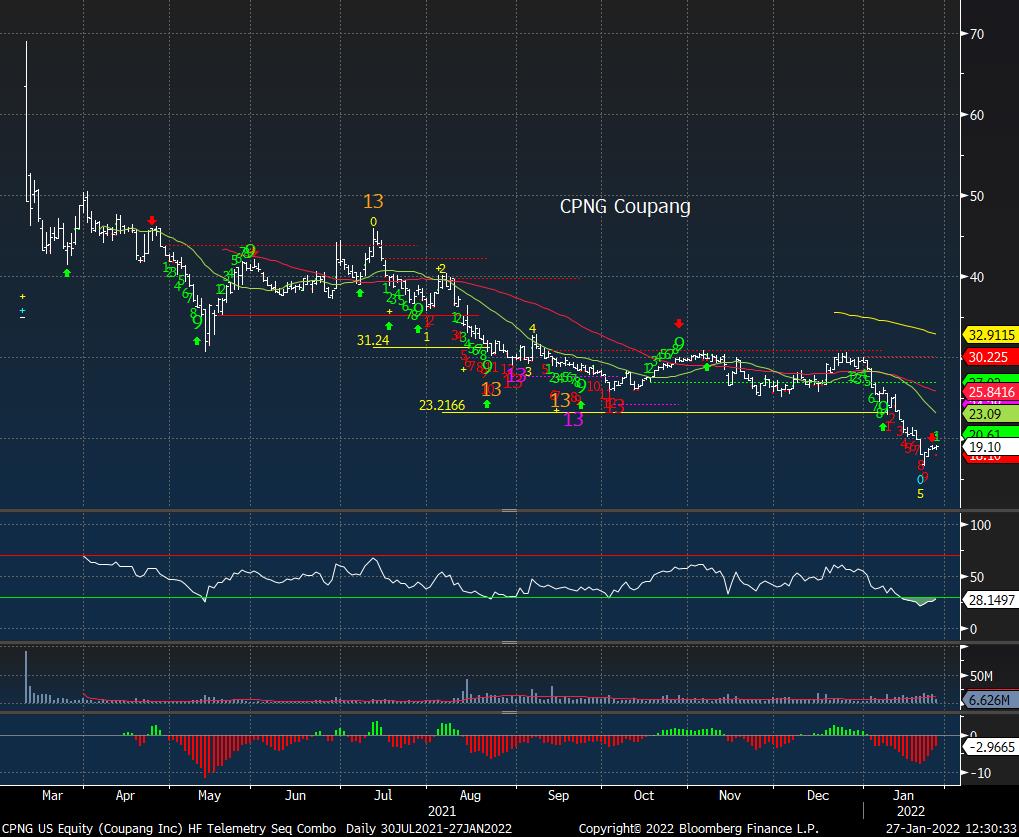
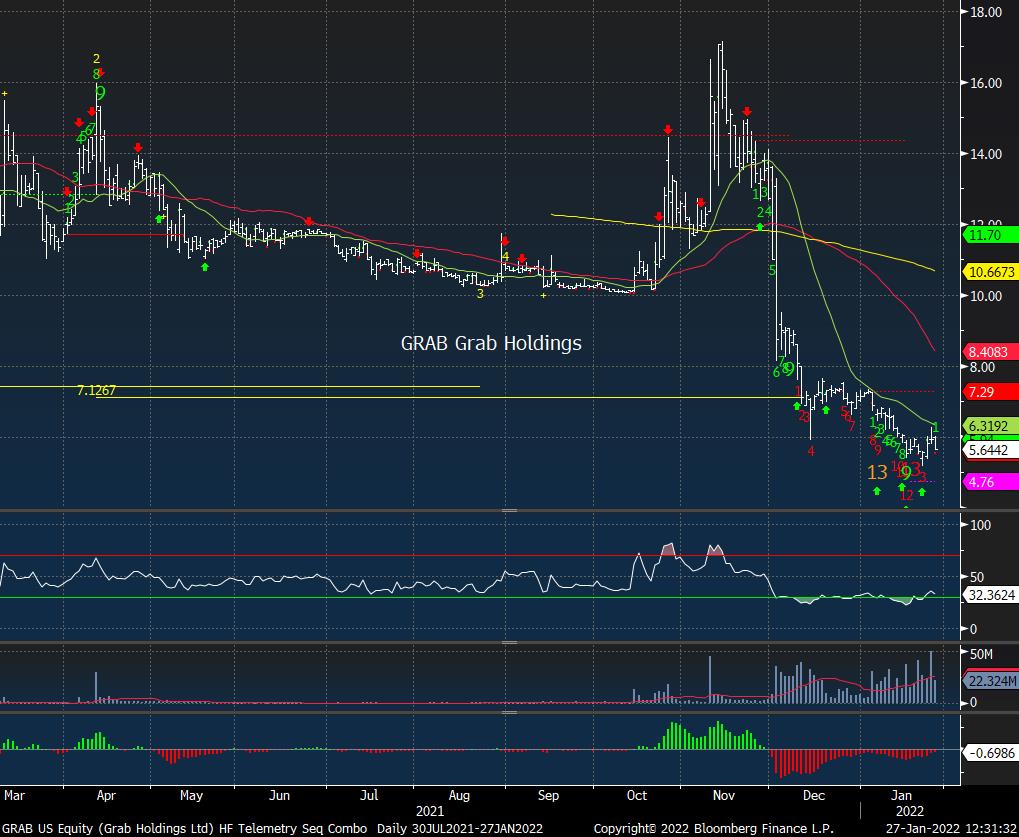
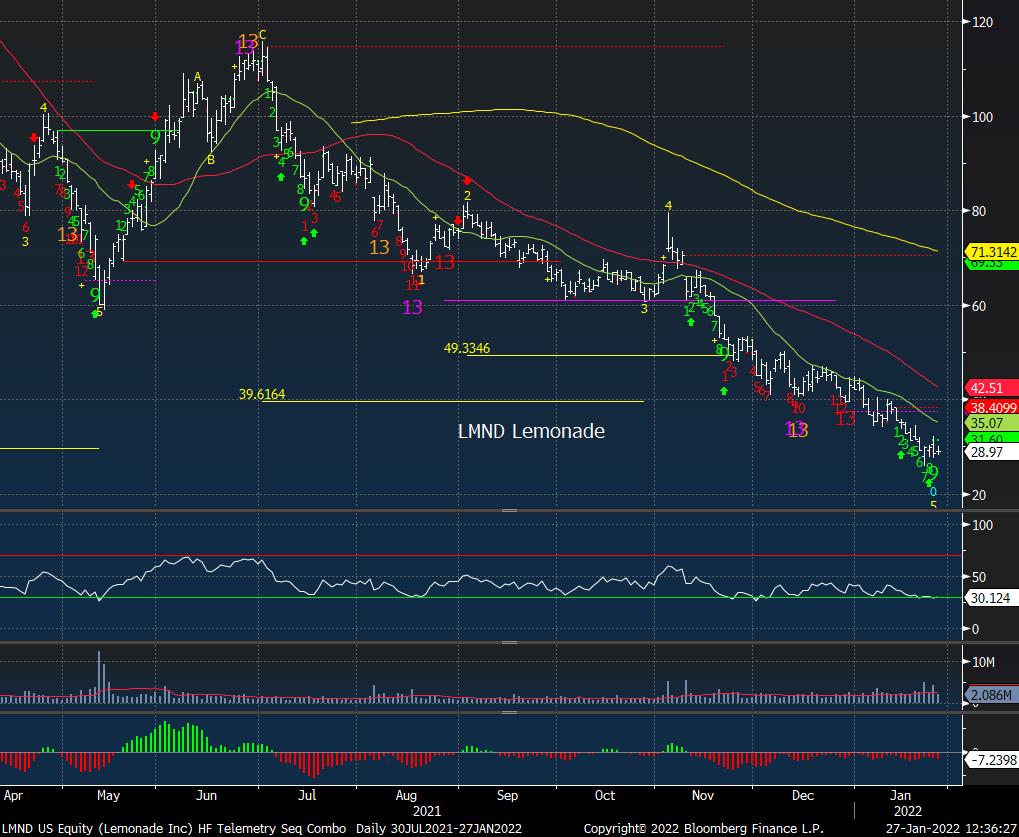
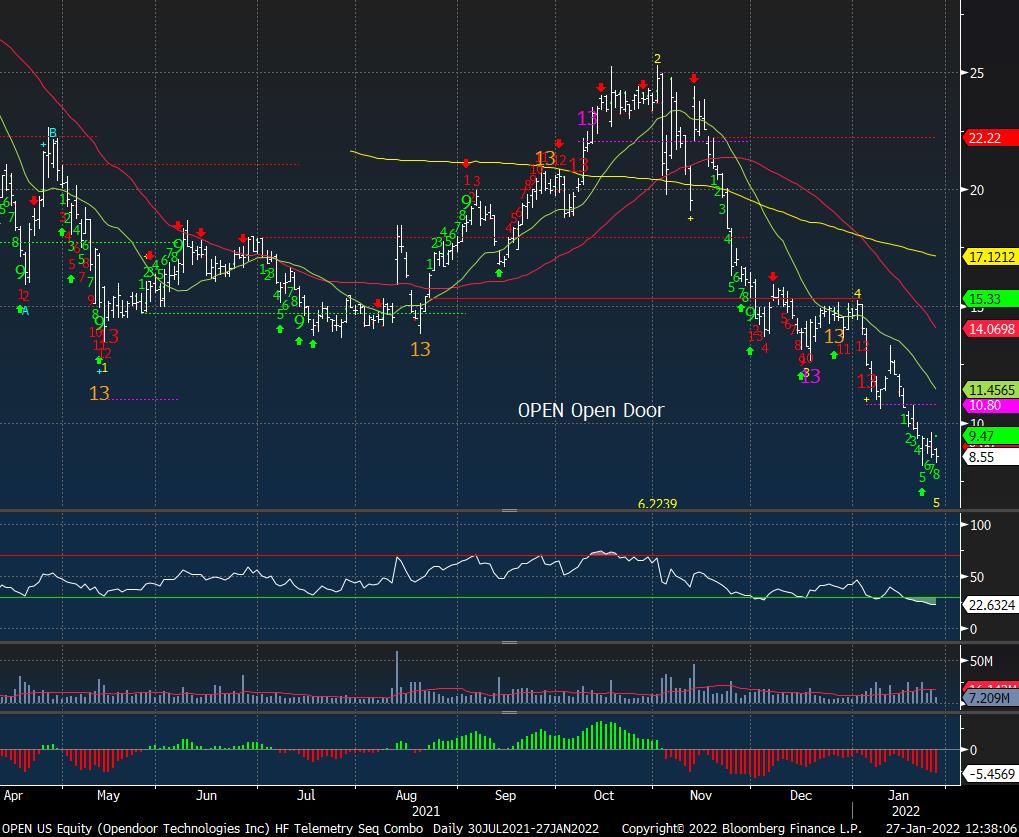
What we can value and see very clearly are the public companies and the performance in the last year. Almost all of them are on the lows and the risk is Softbank needs to liquidate some if not all. That seems inevitable and might be happening already. The Japanese culture is very proud and death before defeat or shame is a long-standing value. Is Masa going to give up and capitulate or is this thing going down for good? If he allows this to go down there will be a lot of collateral damage.
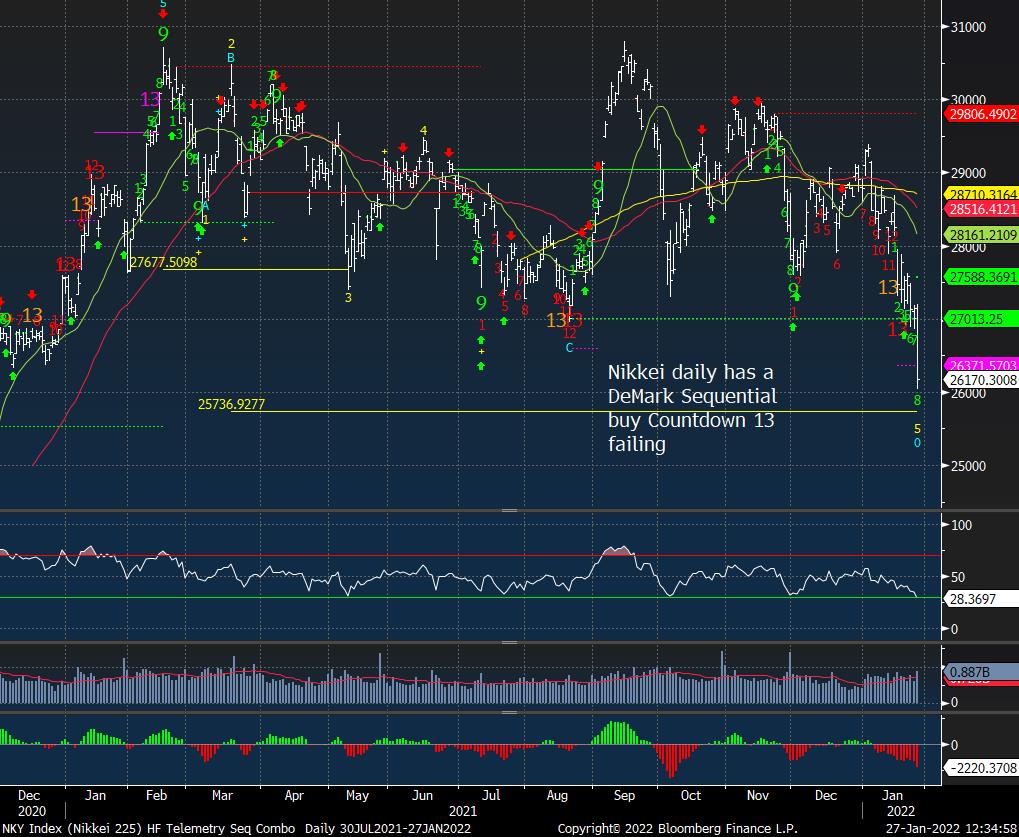
Right now the markets are under pressure again after an early bounce lead by the mega-caps which were up over 2%. Breadth was up strong and now down significantly – a pattern we’ve seen a lot lately. The buy the dip people are getting hit once again. My big concern overall in the market is that down 10% got the market’s oversold, sentiment down near extreme levels, and some DeMark buy Setup 9’s which typically can see bounces BUT if those bounces do not happen downside DeMark Sequential countdowns can start continuing the downside trend. It’s a little early to see if the Countdowns will take hold and tractor beam this market lower.
It all depends on Apple later today when they report. I’m on Real Vision’s Daily Briefing today at the market close at 4 pm ET. It’s live on YouTube. I like these as they are pretty informal and we can go over a lot of different market topics.
Tomorrow we are hosting are twice a month review of the latest Short Interest data with Geoff Garbacz of Erlanger Research. Here’s the link to register. I will get the video posted on the Hedge Fund Telemetry YouTube page later tomorrow.
TRADE IDEAS
I am cutting long exposure today. Bounces did not happen and I’d rather be wrong now and live another day. I am selling IBB and XBI biotech ETFs. Massively oversold but no turn so I’m out. I’ll wait for stability to reenter. I am selling FXI, KBE, C, GS, JPM all down about 1%. I’m giving up on TWTR. I did take off half a few weeks ago with the intention to buy back. I have some good gains I’ve taken this year so far so it offsets some of the sting. I hate taking losses like everyone but it comes with the job. I’m holding the Cannabis dogs as I bought them down 55% off the highs and I expect some positive news in February. The metals are also trading off today and that is a US dollar issue as you saw on First Call I highlighted the US Dollar charts with some upside DeMark exhaustion combined with sentiment extreme. The dollar is up in risk off positioning. Tesla could be in store for even lower levels.
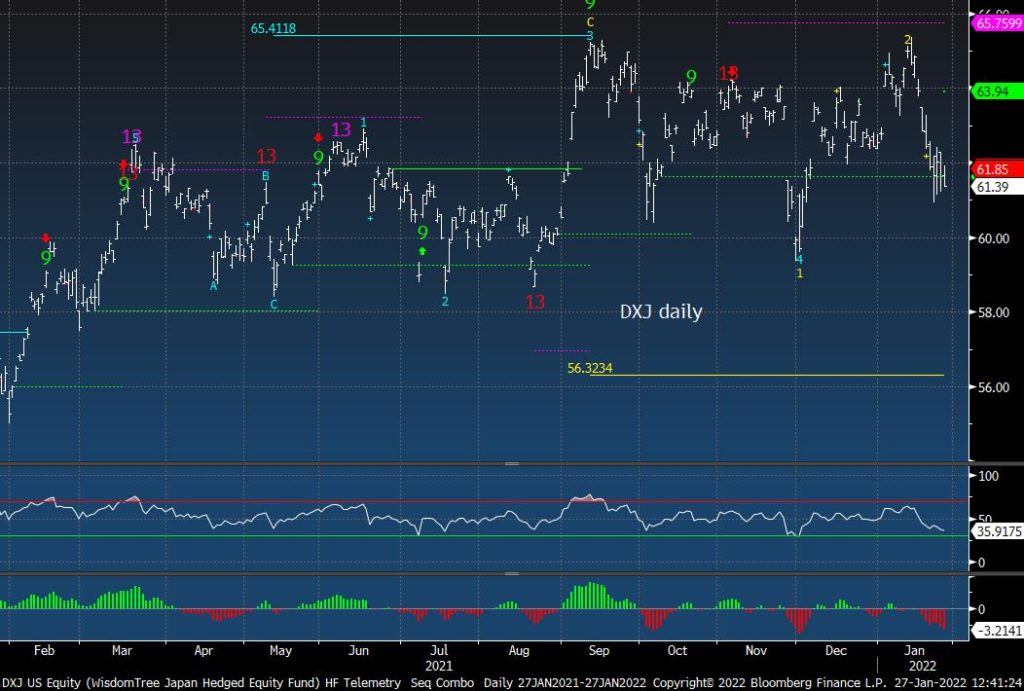
I am adding DXJ Japan ETF as a new short idea with a 5% sized position.
US MARKET SENTIMENT
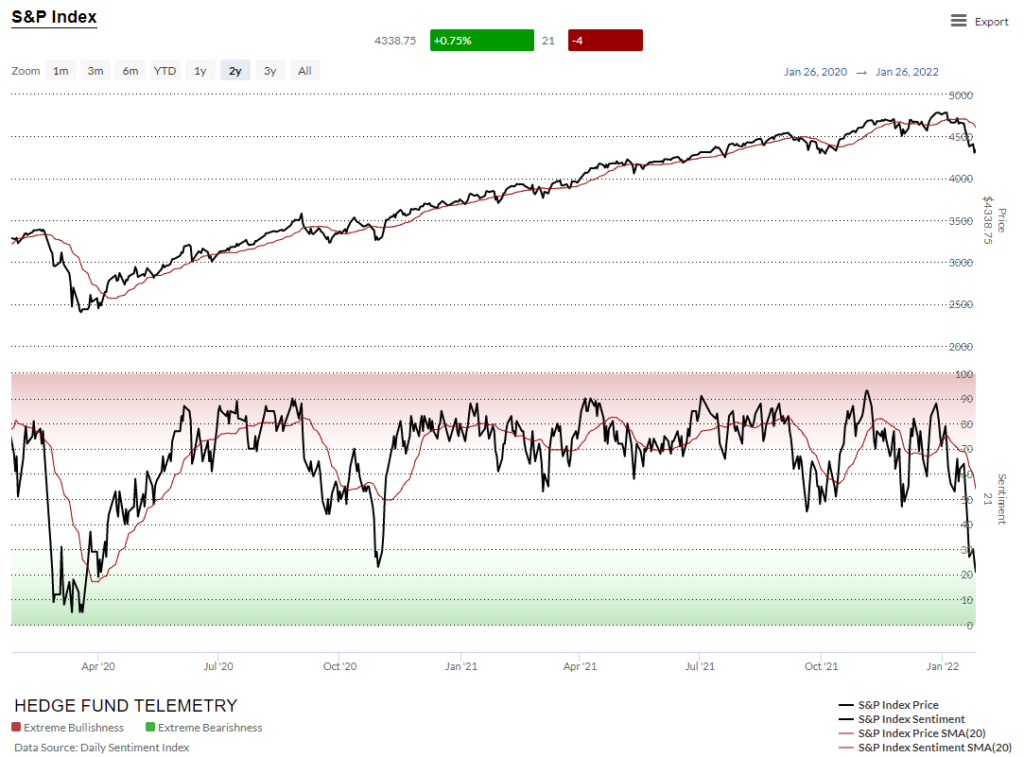
Here is a primer on how we use Daily Sentiment Index charts. S&P bullish sentiment and Nasdaq bullish sentiment dropped again. Nothing matters under 50% breaks. We’ve seen bounces at 50%
US MARKETS
Here is a primer on the basics of the DeMark Setup and Sequential indicators.
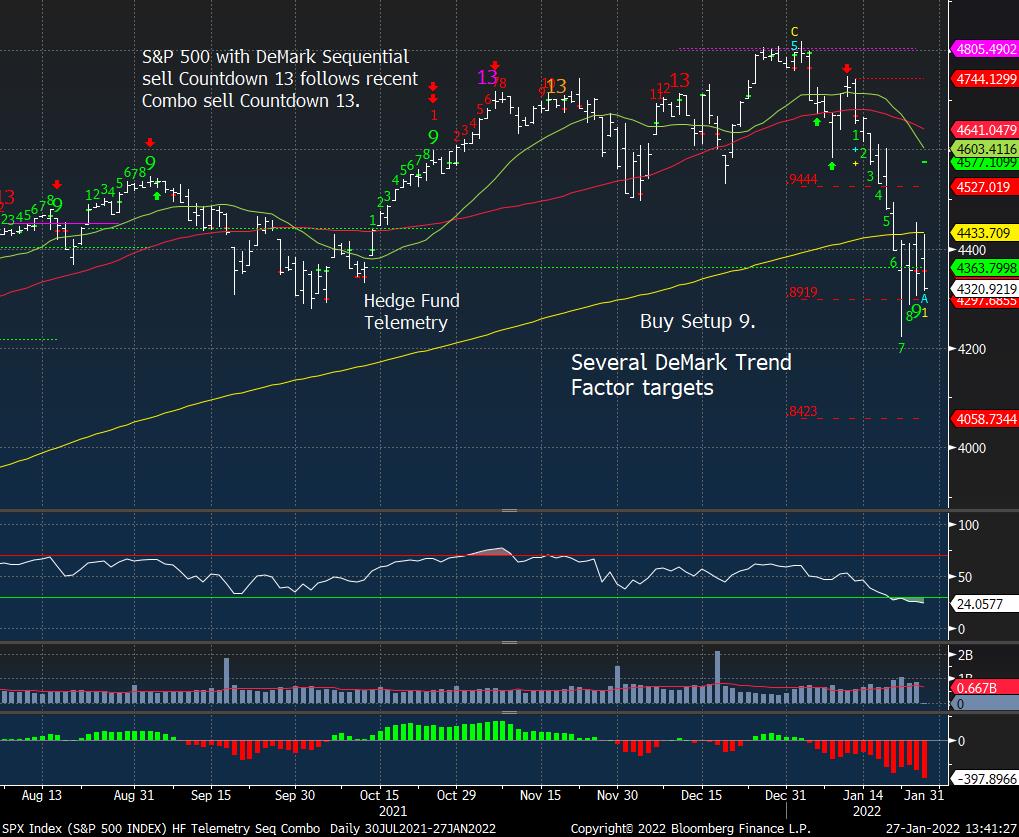
S&P 500 daily looks bad today and could start new downside DeMark Sequential Countdown’s continuing the downside trend. Here are the details on the Sequential Countdown:
Once a Setup 9 completes the Sequential Countdown process begins. Sequential (red 1-13 numbers) measure the depletion of buyers/sellers in the market after the Setup phase has determined the direction of the trend. The Countdown is calculated by comparing the close of the current bar to the high/low of two bars earlier. Each fulfilled comparison produces a number, which helps to describe the stage of the current trend. Unlike the Setup, the Countdown doesn’t have to be an uninterrupted sequence of qualifying price bars; the Countdown process simply stops when markets are trading sideways, resumes when prices start trending in the current trend direction again
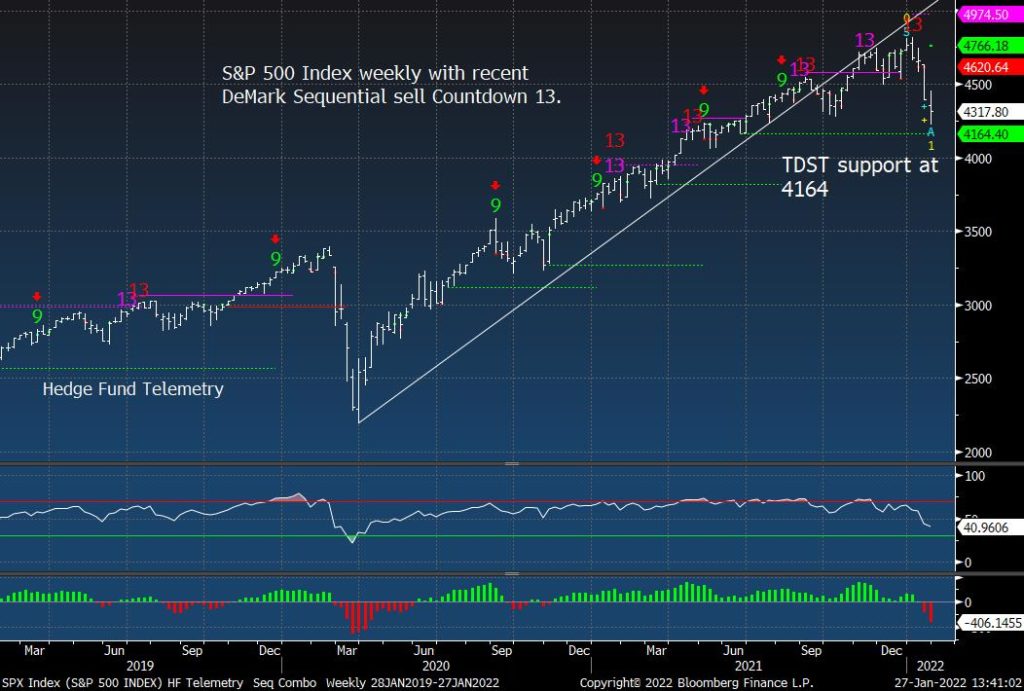
S&P weekly
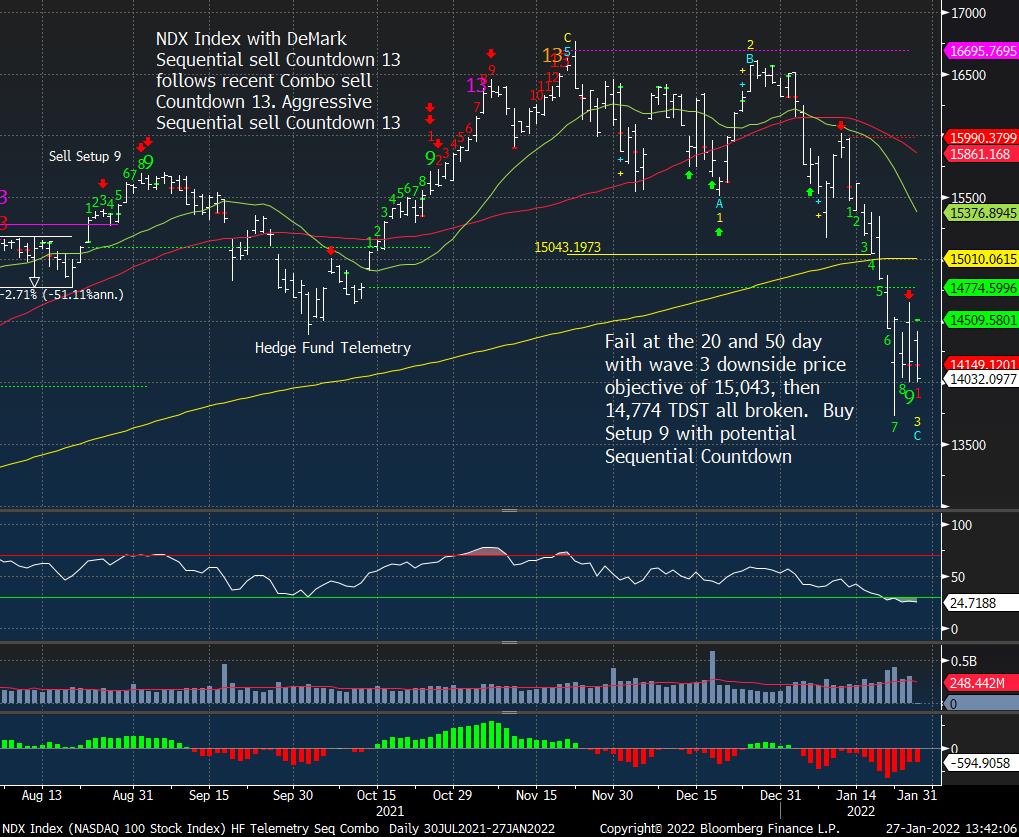
NDX index might have the Sequential Countdown starting and we will know probably tomorrow after Apple if this continues
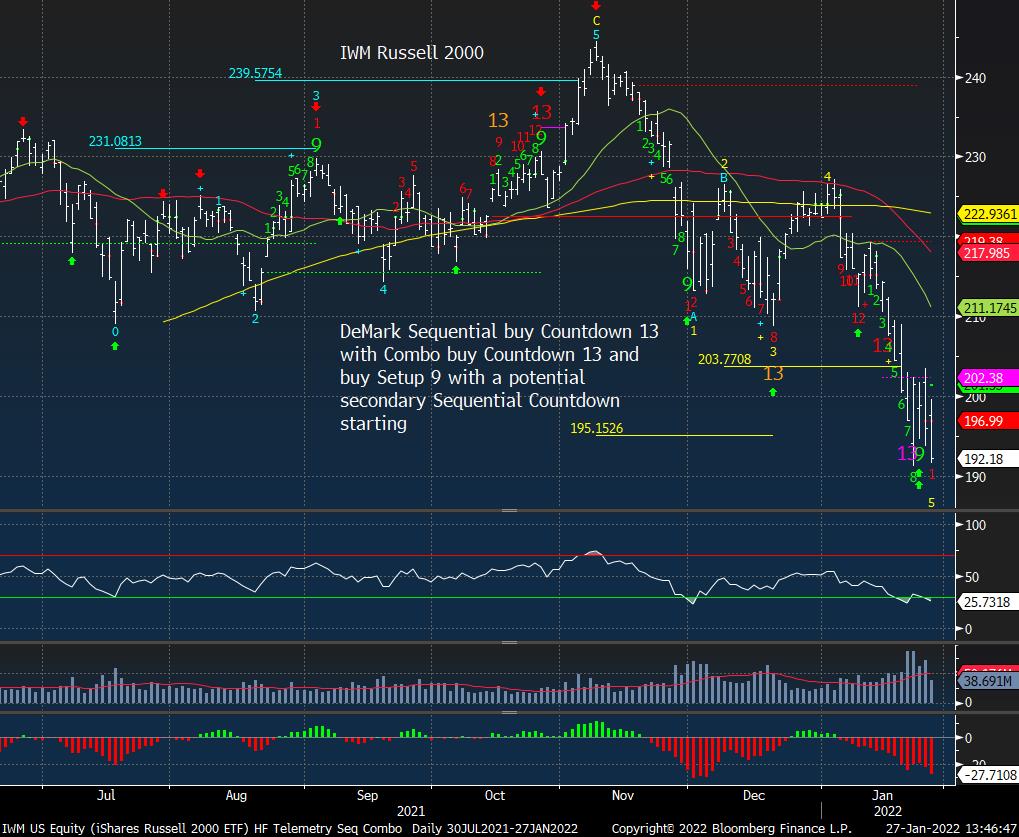
Russell 2000 IWM daily has had some recent DeMark buy Countdown 13’s and also a second Setup 9 which might start a secondary Sequential Countdown.
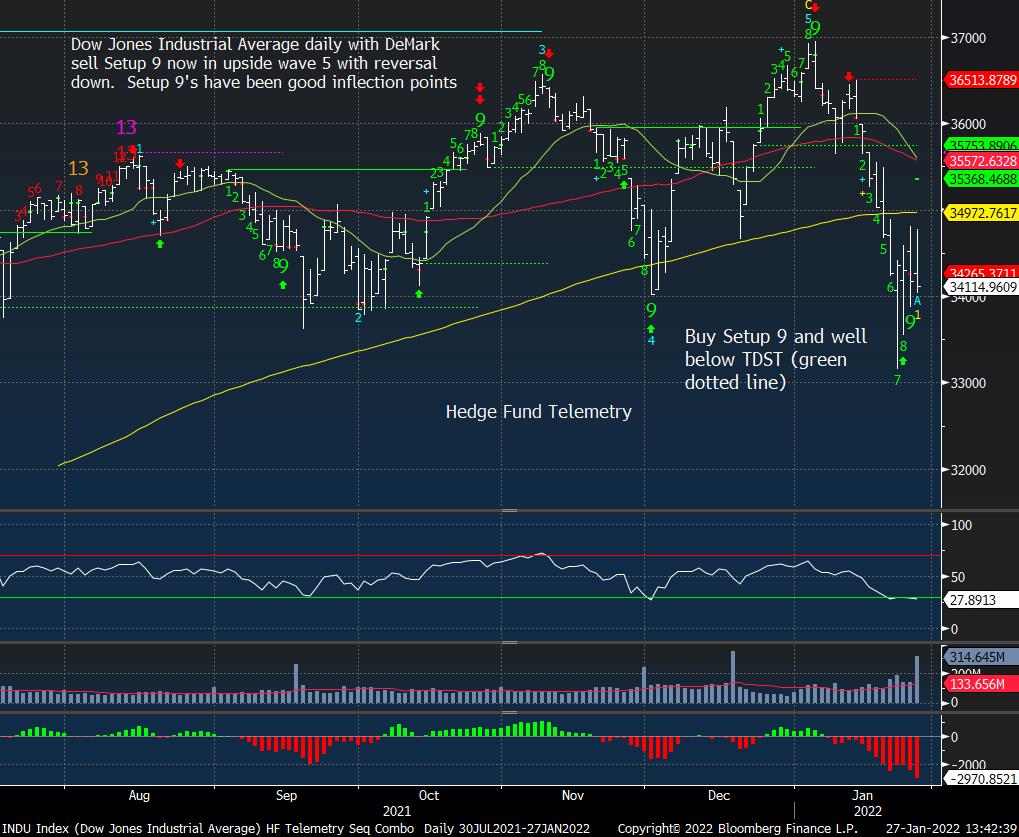
Dow Jones also could see a new Sequential with a little further drop
did you see natural gas today? holy Sh*t
Only up 72% at the high today. Liquidity? I don’t think so
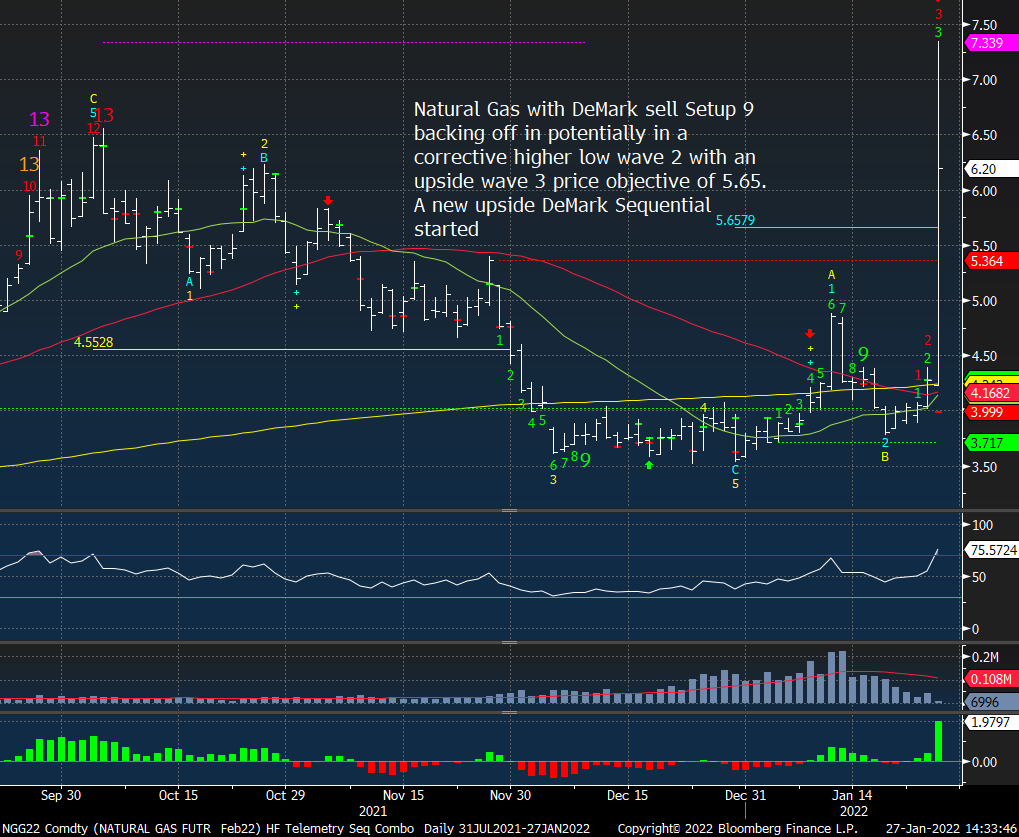
Remember this guy? The option seller guy who blew up his clients being short nat gas calls. Wouldn’t it be incredible if he did it again?

TODAY’S FOCUS – softbank and collateral risk
First up is the Nikkei index now down YoY 7%
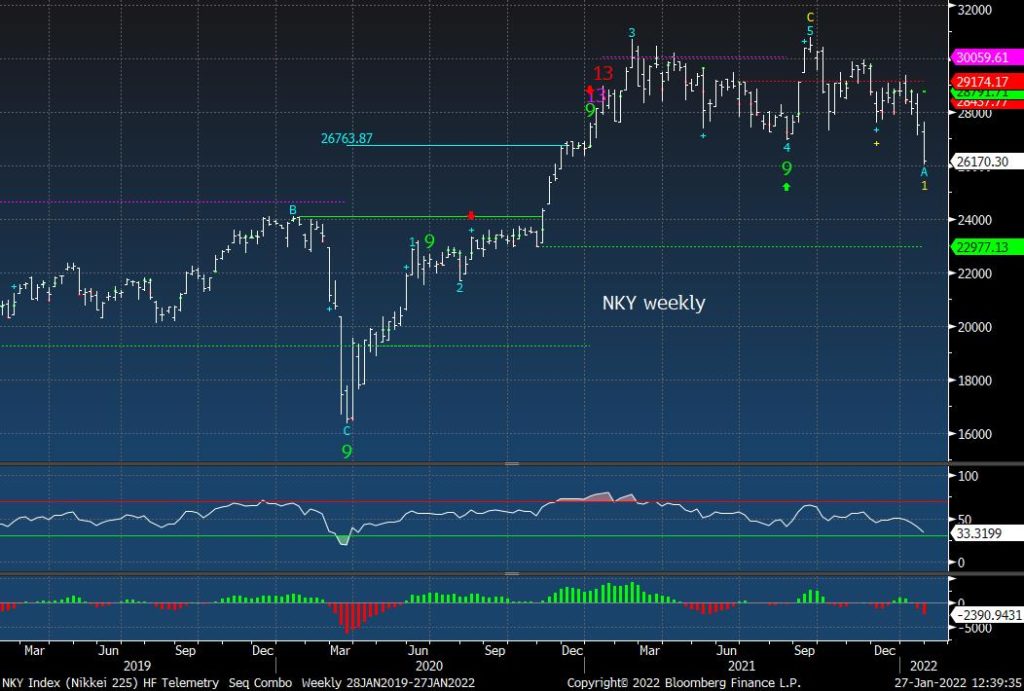
The weekly chart looks more like a major top. With very little support near
DXJ Japan ETF daily still has some support. This is the currency hedge ETF and I’m shorting a 5% sized position today.
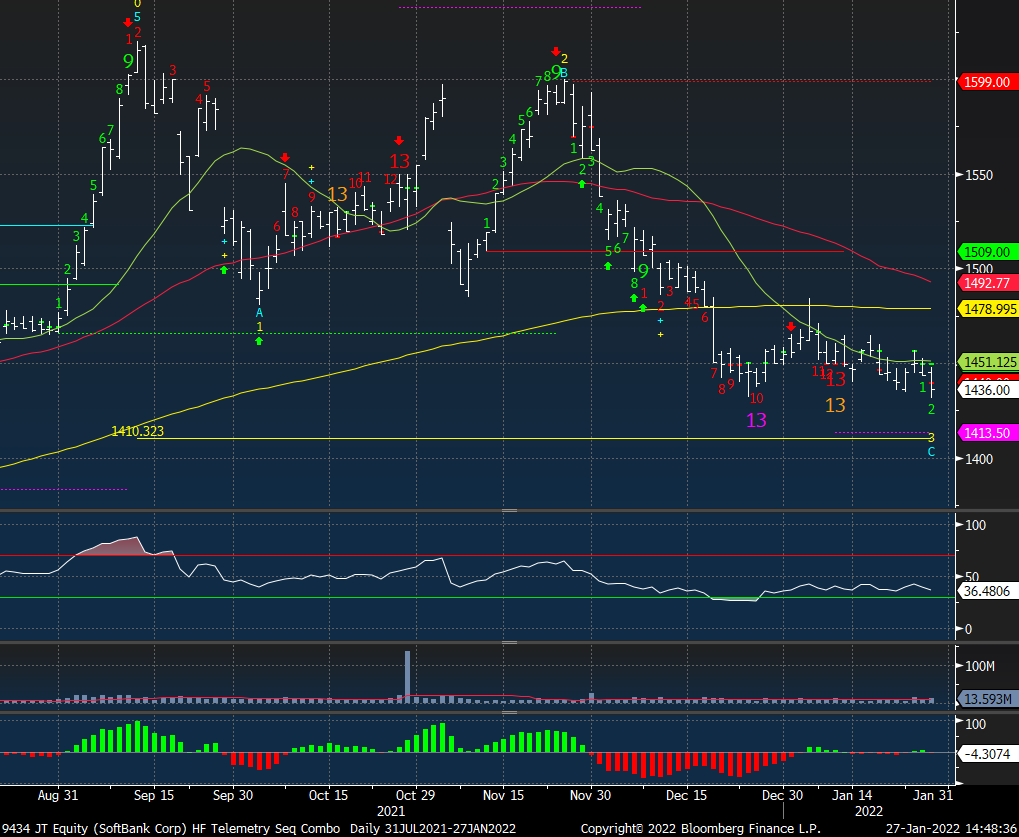
Softbank chart looks dangerous despite some DeMark Countdown 13’s which have seen short term bounces and then lower levels.
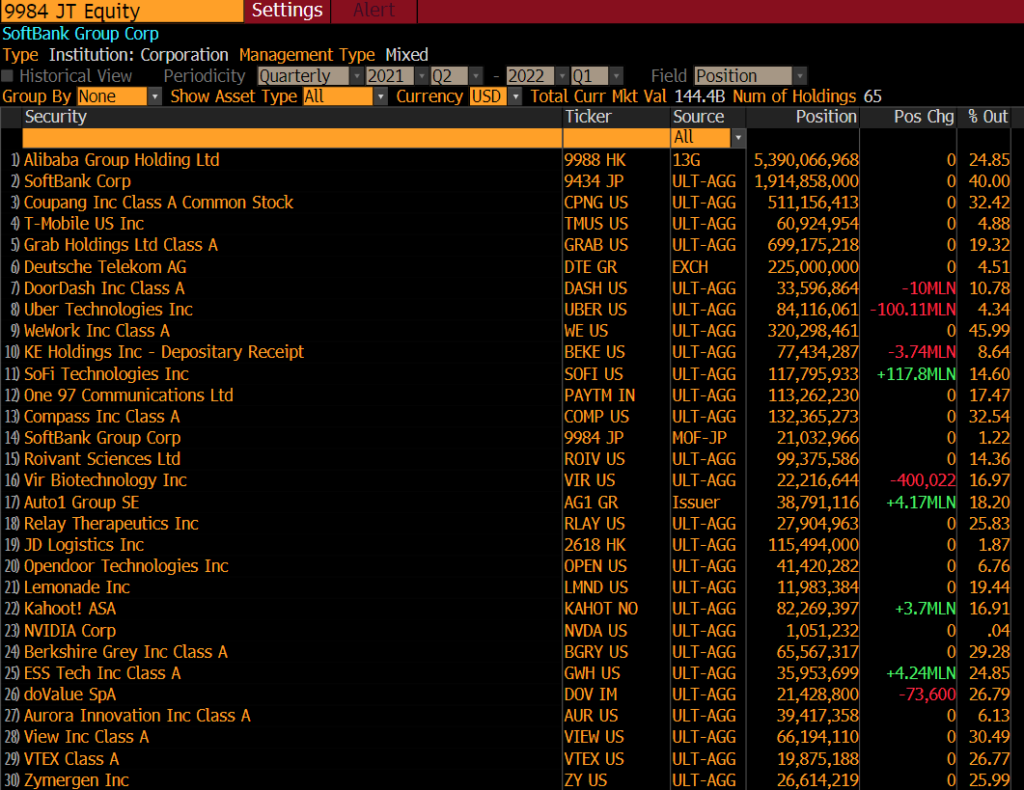
Here are some of Softbank’s largest holdings. Note the percentage of what they own of these companies. BABA 24.85% is a lot if they need to sell. Also, their number two holding is their own telecom stock. Softbank telecom stock at 40% weight.
Softbank telecom wireless stock also dragging on the lows
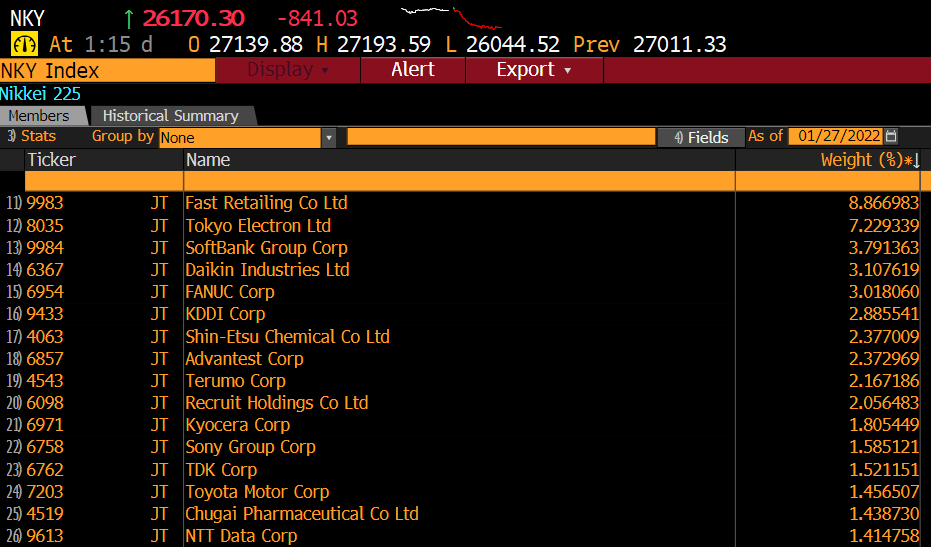
Here are the largest weights in the Nikkei. Softbank is the third-largest weight.
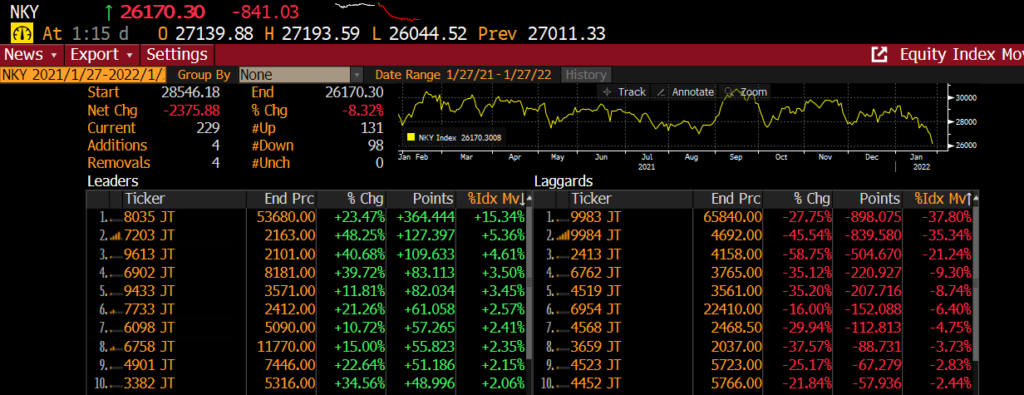
Here is the attribution in the last year in the NKY. Notice Fast Retailing nearly 9% of the NKY is down the most followed by Softbank. Imagine if two of the largest weights in the S&P started to drop like this?
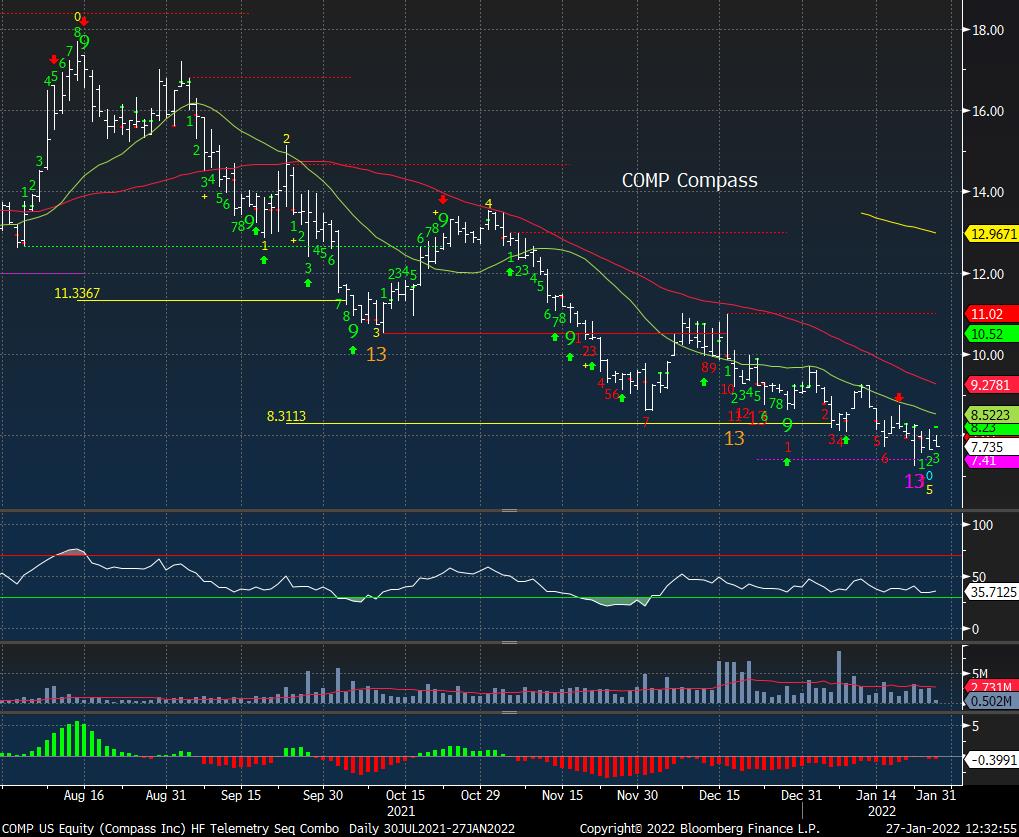
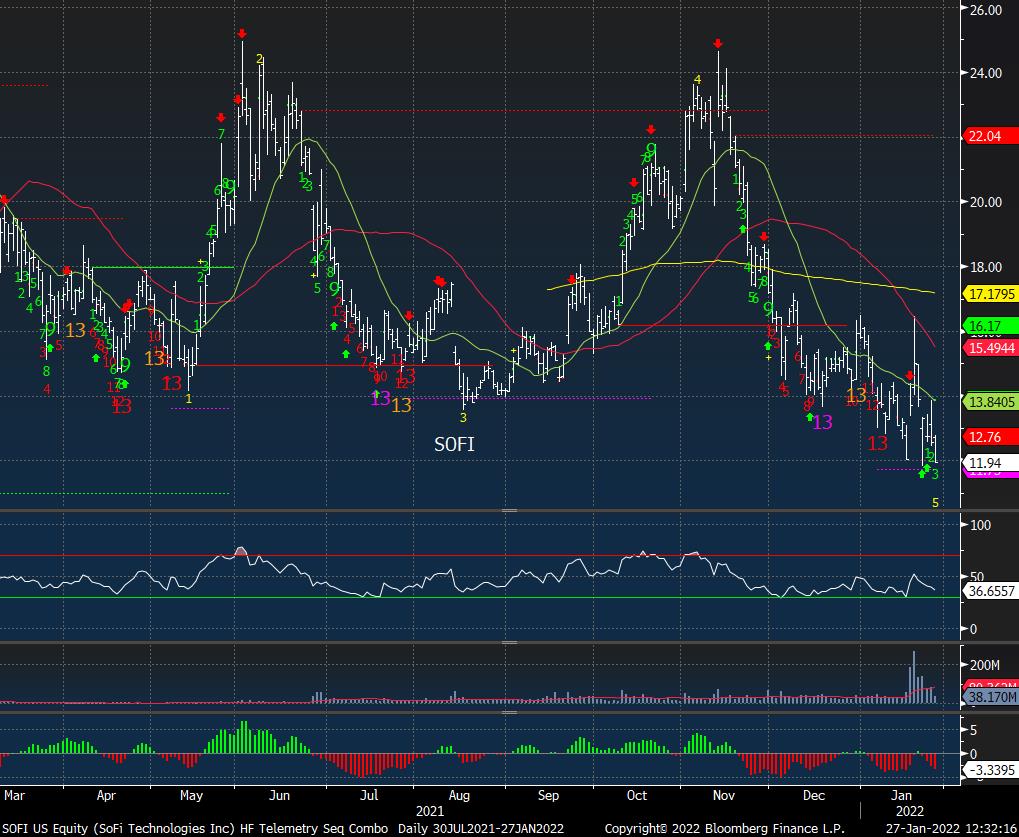
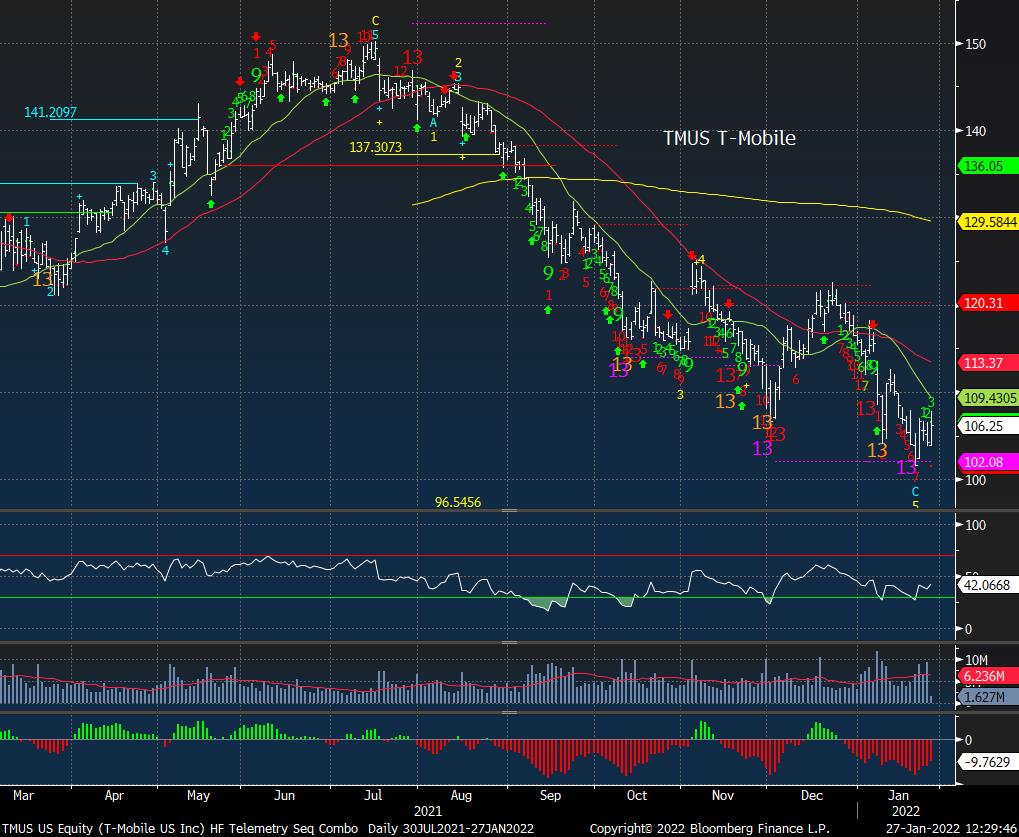
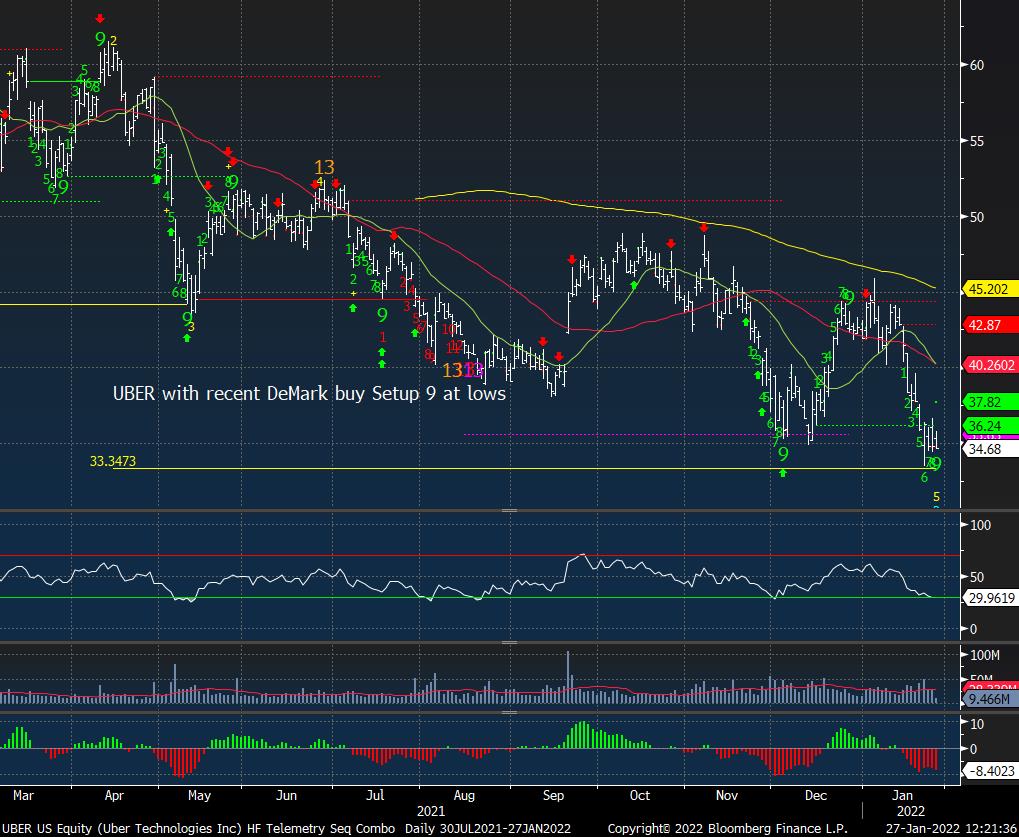
Here’s a bunch of holdings. The story is similar with all of them. Trading on the lows.
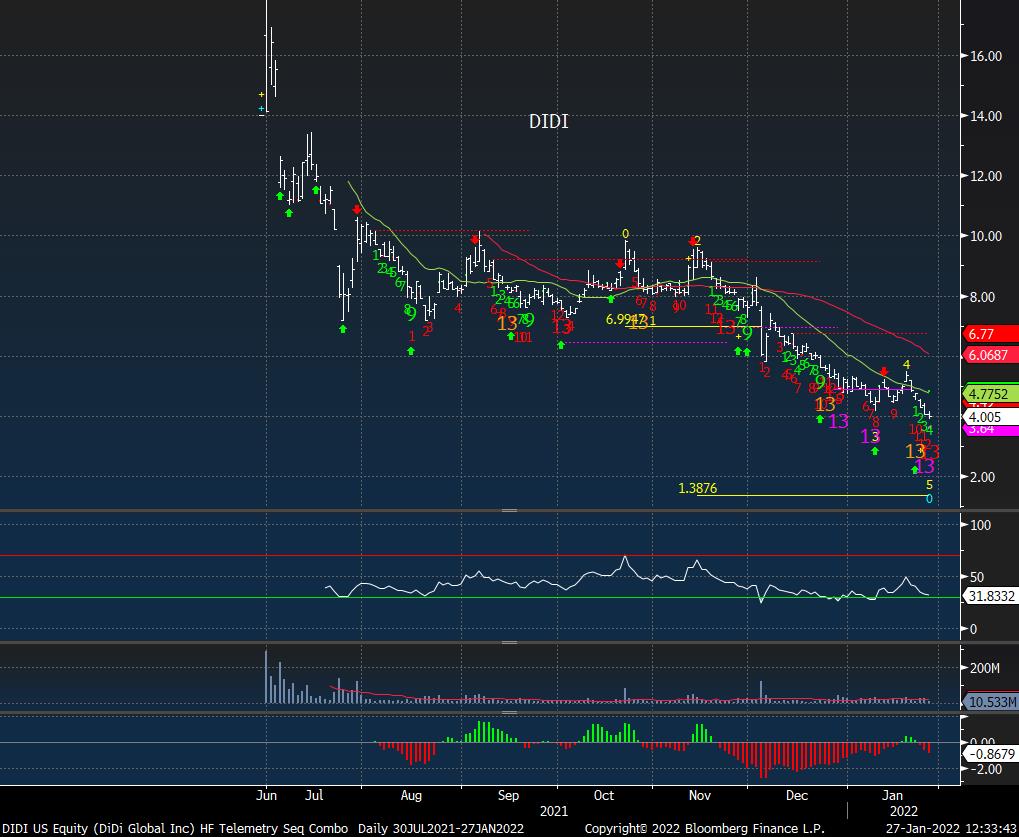
DIDI never had a chance
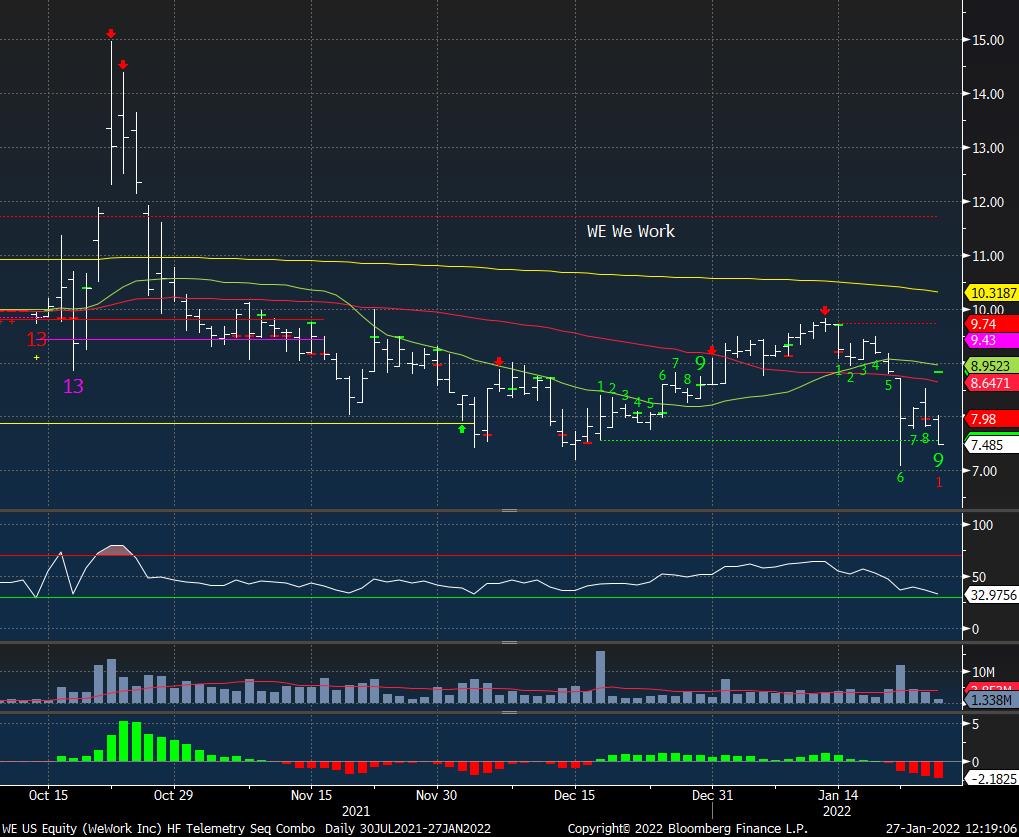
WeWork went public finally with a SPAC. It currently has a $5 billion market cap. Softbank was marking We Work at one point at $47 billion. If they marked this at $47 billion what did they mark everything else that is private?
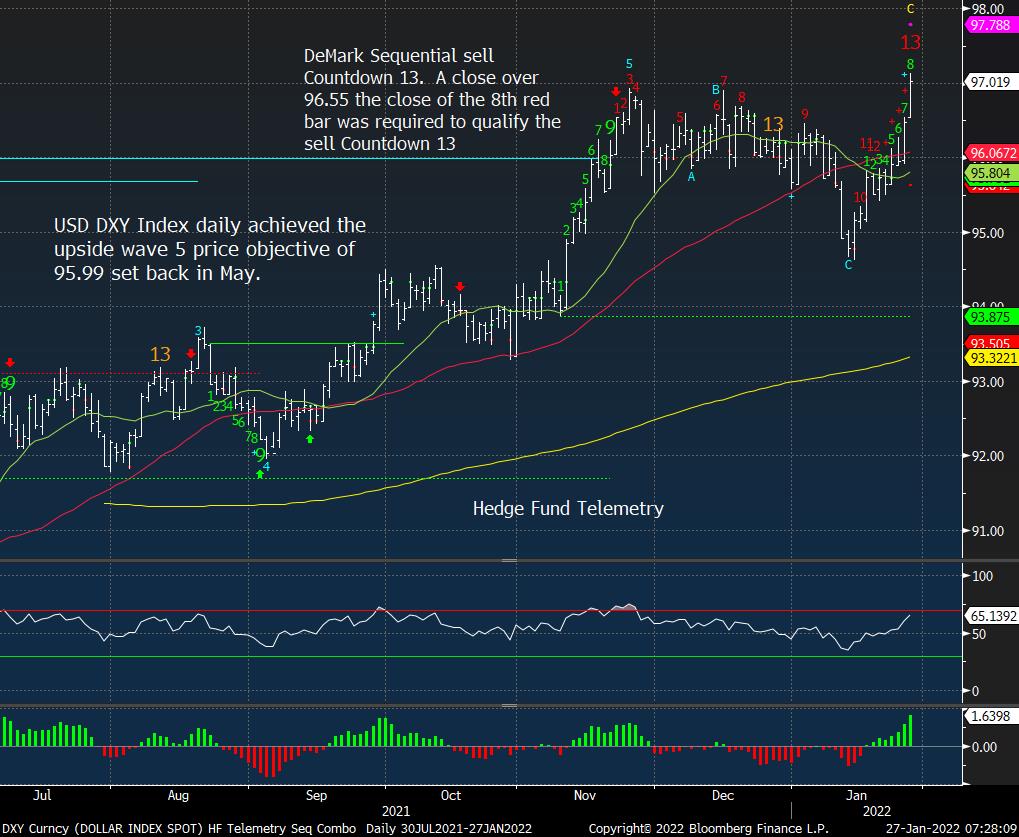
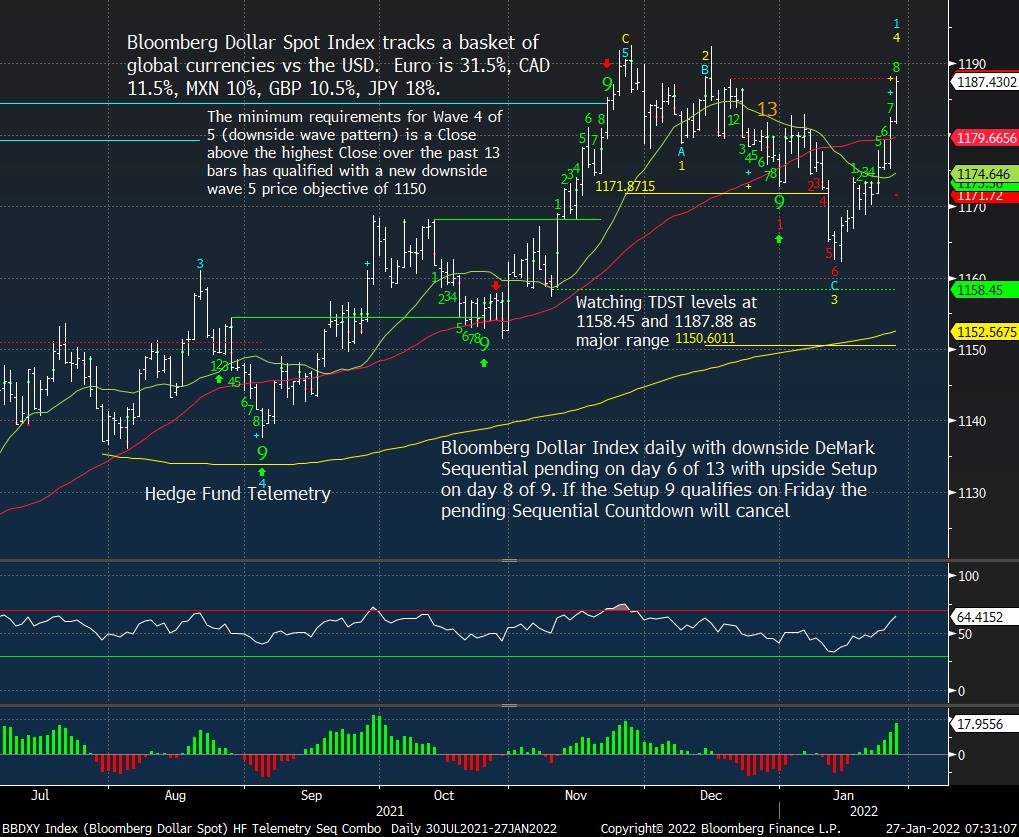
US DOLLAR UPDATE
DXY Index with a Sequential sell Countdown 13. A pullback is likely in the next few days.
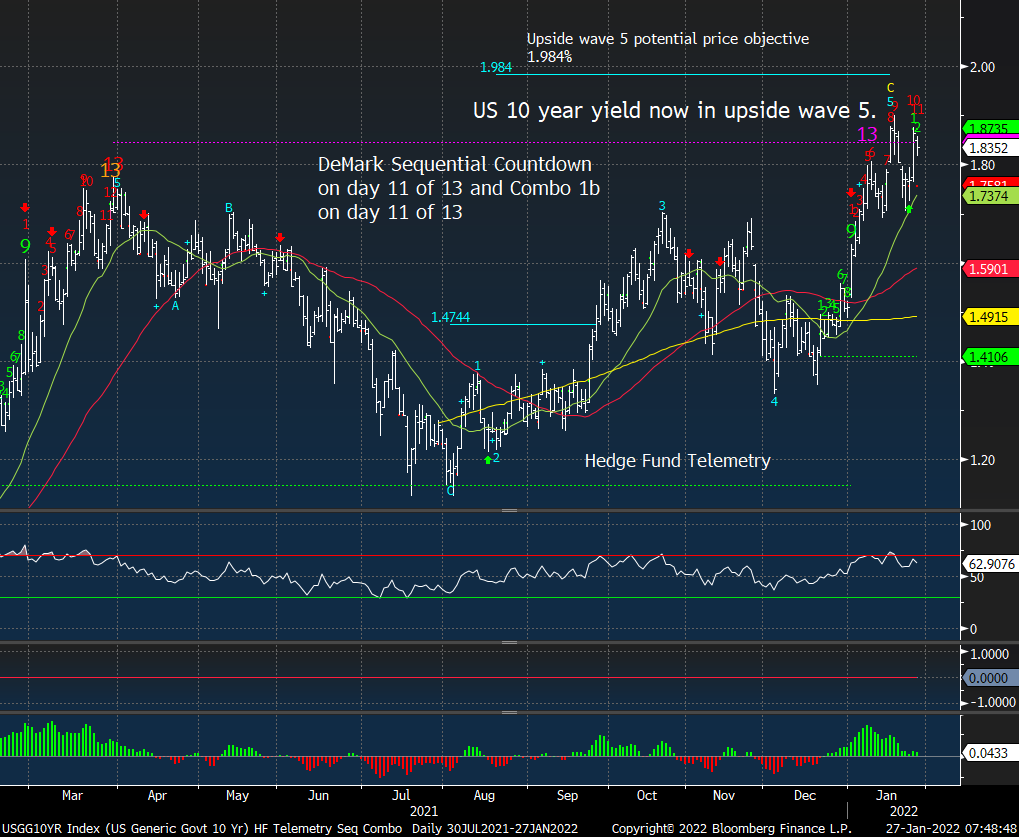
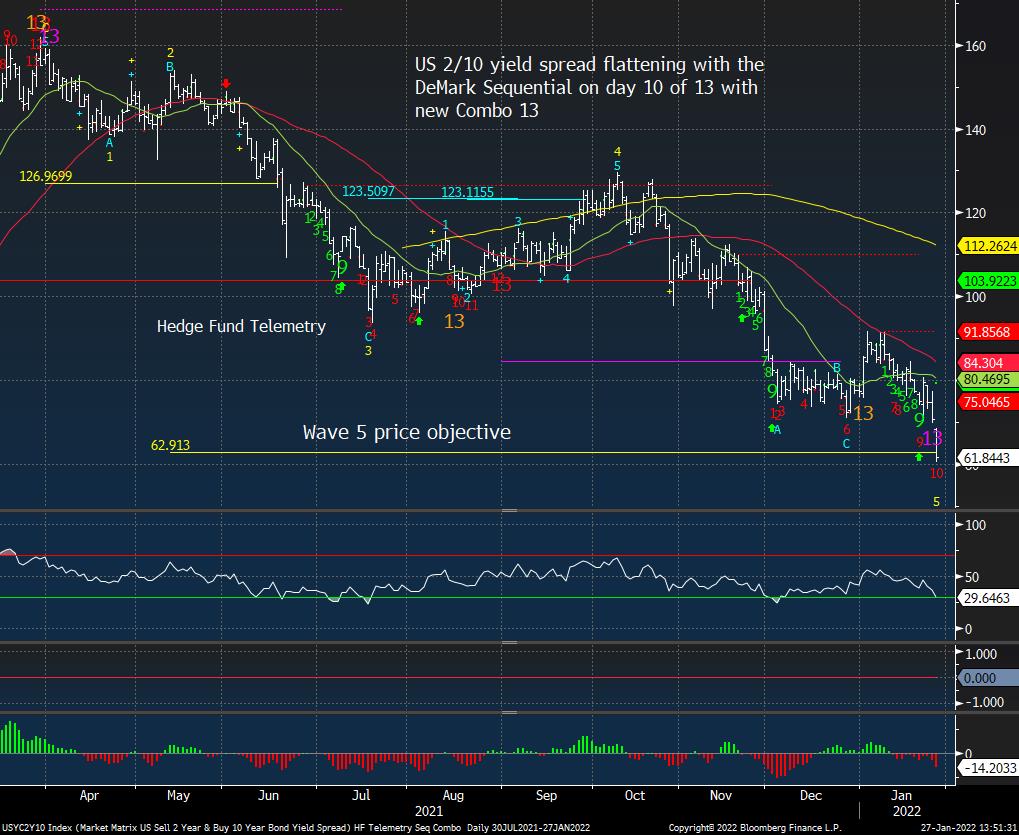
BOND UPDATE – 2/10 in focus
US 10 year yield is nearing upside exhaustion
The 2/10 yield spread is also nearing exhaustion.
FACTORS, GOLDMAN SACHS SHORT BASKETS AND PPO MONITOR UPDATE
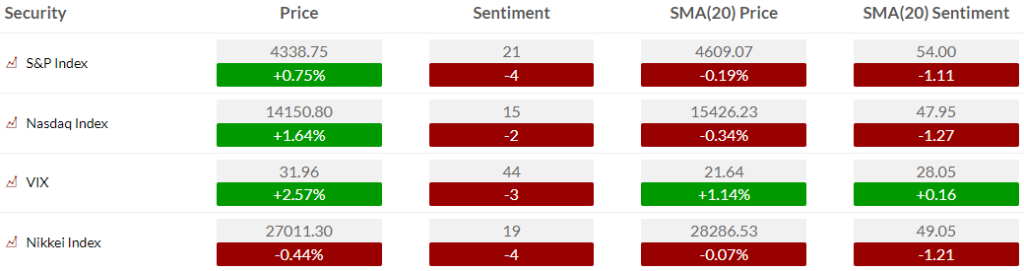
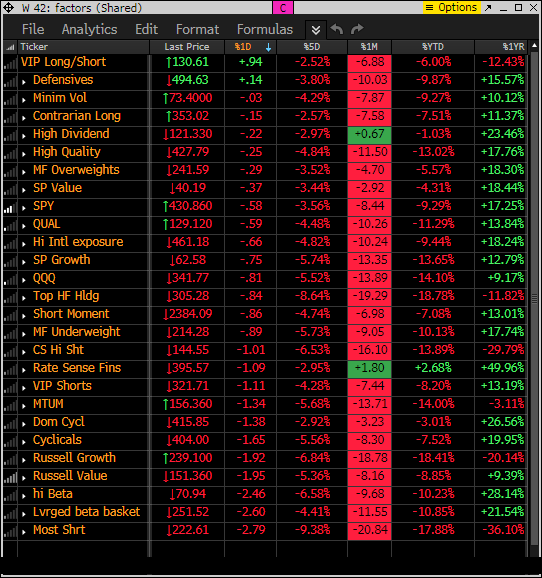
Factor monitor now has a reset YTD performance column. Factor monitor now has a reset YTD performance column. Nearly everything is down YTD and down big.
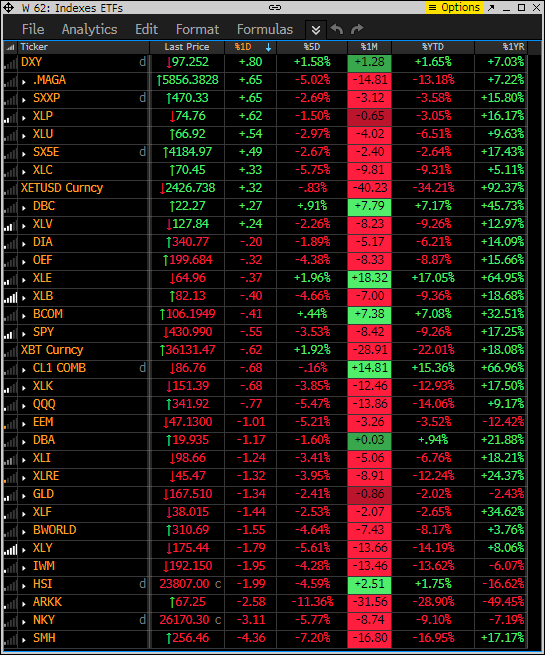
This is similar to the above monitor with various ETFs other indexes as I wanted to show the same 5 day, 1 month rolling as well the YTD and 1 year.
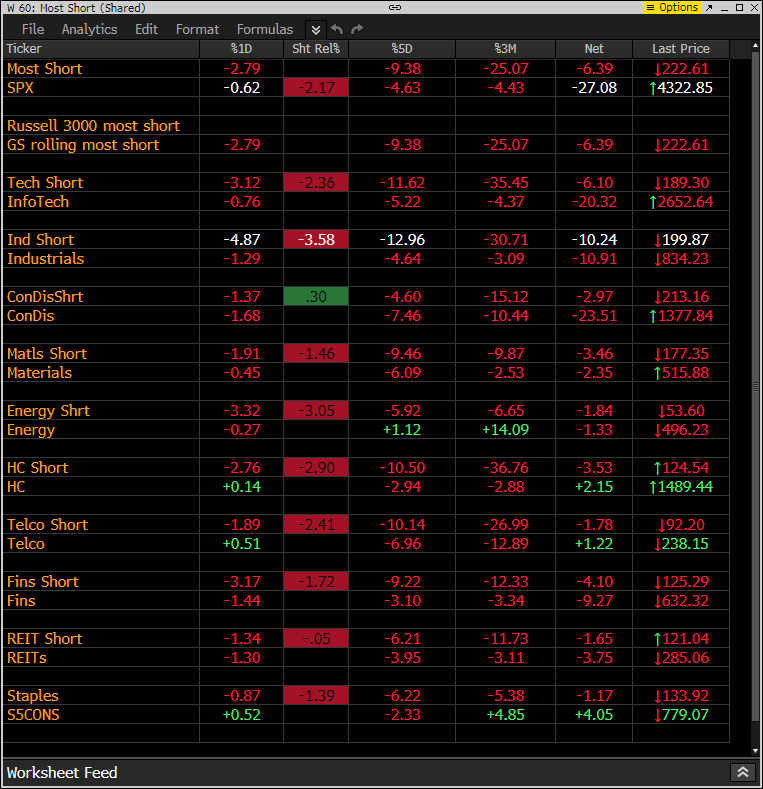
This is the monitor that has the S&P indexes and the Goldman Sachs most shorted baskets. Today the shorts are down more than the S&P indexes today illustrating the most shorted stocks are working well for those short.
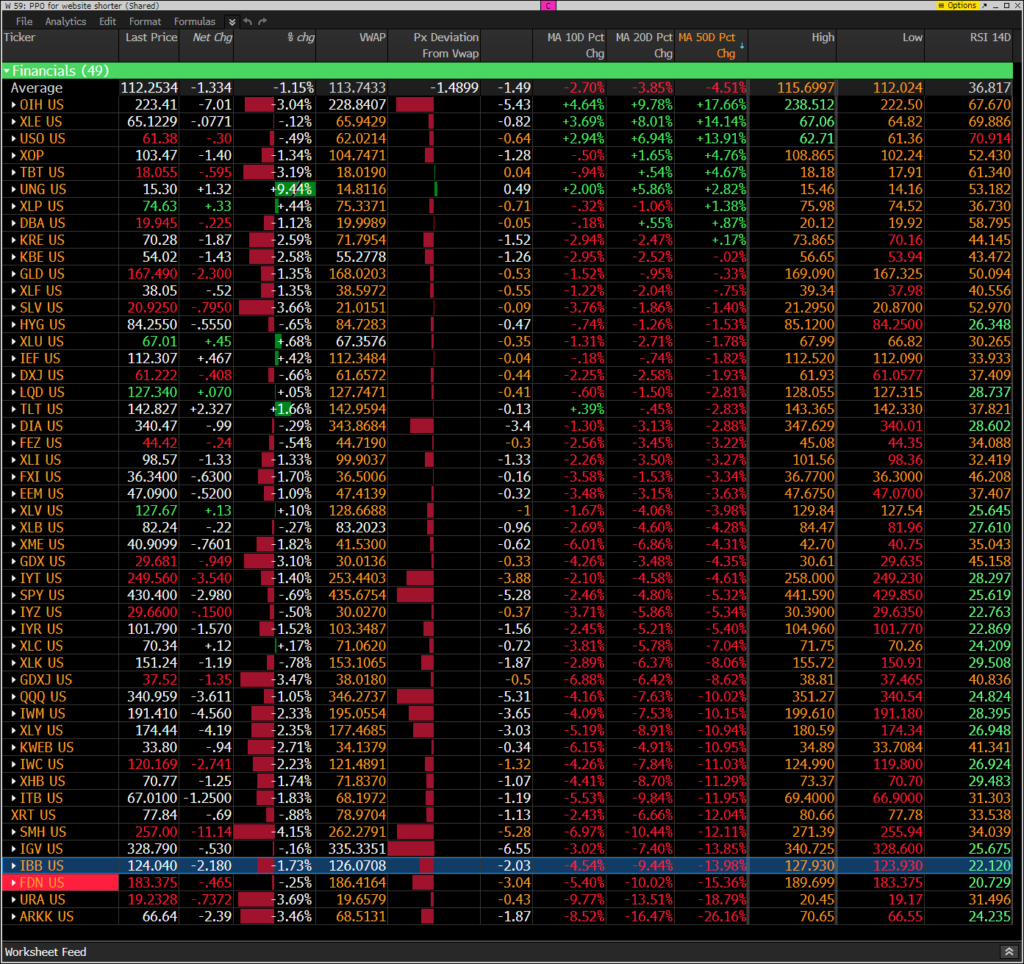
The PPO monitor (percentage price oscillator) force ranks ETF’s by percentage above/below the 50 day moving average. For information on this monitor please refer to this primer. This monitor is offered to Hedge Fund Telemetry subscribers who are on Bloomberg. Brutal
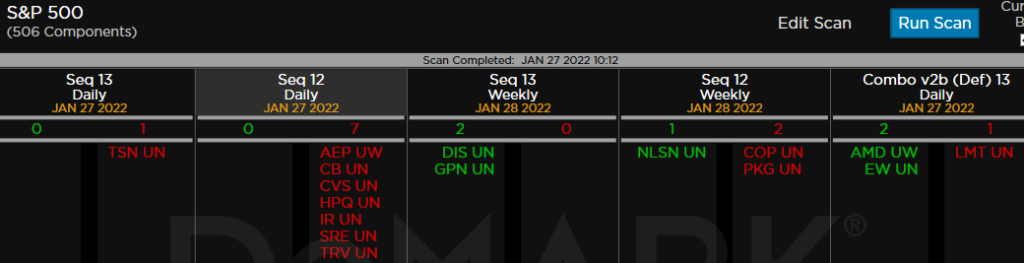
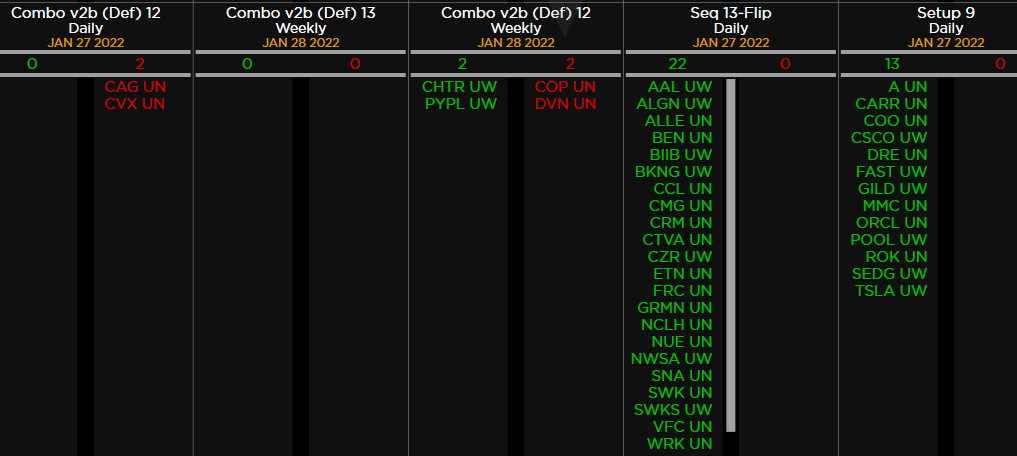
DEMARK OBSERVATIONS
Within the S&P the DeMark Sequential and Combo Countdown 13’s and 12/13’s on daily and weekly time periods. For information on how to use the DeMark Observations please refer to this primer. Worth noting: Still quite a lot of weekly Sequential and Combo 13’s and on deck 12’s. That’s a more intermediate-term risk.