Each day I grind through a lot of various charts, screens, sentiment polls, short interest, put/call data on indexes and stocks, and out spits a view on how to position my portfolios. I also read as much as I can and at times when this note comes out late in the day, I’m deep into research. There are times when everything or mostly everything lines up on either the bullish or bearish side. I like when there are extremes on a lot of the individual data points too because when there is a turn it’s obvious when it happens. At least to me. I’ve also talked about being early and building positions during times of extremes. I’m OK with that as it’s worked out on the upside and on the downside. It gives you and in the past, it gave the smart people I worked with to prepare and do research. There are a lot of “drive-by” analysts and pundits out there who will talk about what is happening today while I like to anticipate and catch turns early. Last year I had a hard time with the shallow dips and chasing the mega-cap. It just wasn’t my favorite type of market. I found ideas that worked within my process and it wasn’t at inception popular. Energy? I loved it in an ESG world. Now everyone is focused on Energy. It’s played out.
My call this year has been to expect a tactical market with downside and the occasional bear market rally. Today is a bear market bounce. How much higher can it go? Looking at the 60 minute time frame charts on the S&P and Nasdaq futures, it’s possible that this is the first of five upside waves. What does that mean? Let’s go to the Elliott Wave Wiki and review the wave one personality:
Wave one is rarely obvious at its inception. CHECK When the first wave of a new bull market begins, the fundamental news is almost universally negative. CHECK The previous trend is considered still strongly in force. CHECK Fundamental analysts continue to revise their earnings estimates lower; the economy probably does not look strong. YES/NO Sentiment surveys are decidedly bearish, put options are in vogue, and implied volatility in the options market is high. CHECK, CHECK, CHECK Volume might increase a bit as prices rise, but not enough to alert many technical analysts. TBD.
On the daily and weekly time periods, the wave patterns are different with either the move down this year being either wave one or wave three as wave two qualified with one of the bounces. Wave one and wave three bottoms are not all clear buying opportunities since lower high waves occur shortly after the crowd comes back in and then it fails and breaks to new lows. There’s been a lot of DeMark exhaustion signals in this move lower and that gave me the confidence to buy combined with deeply oversold sentiment and other technical voodoo in the toolbox. The problem is this too shall fail (which might be a good future title of a note).
A lot has been thrown at this market today with Ukraine, inflation, weaker retail sales, Covid case counts increasing, and even an earthquake in Japan. (lots of “short bait” headlines) Up in a few hours is the Fed with Powell expected to raise the Fed Funds rate by 25bps. I tweeted out earlier “It’s a good day to be long” and the majority of the responses were pushback tweets. Refer back to wave one personality and I’ll stick to my call for some more upside albeit a pullback after this move is a better entry than right now.
TRADE IDEAS
On Monday I took profits on my SPY and QQQ downside put spreads (+2.5x) and added short-term call spreads expiring this Friday. I hoped for some positive news from Ukraine and the Fed and all the short-term oversold junk I mentioned above. I bought SPY 420-435 call spread for $3.75 (now $11.00) and QQQ 325-335 call spread for $2.50 (now $7.60). Take profits before the Fed!
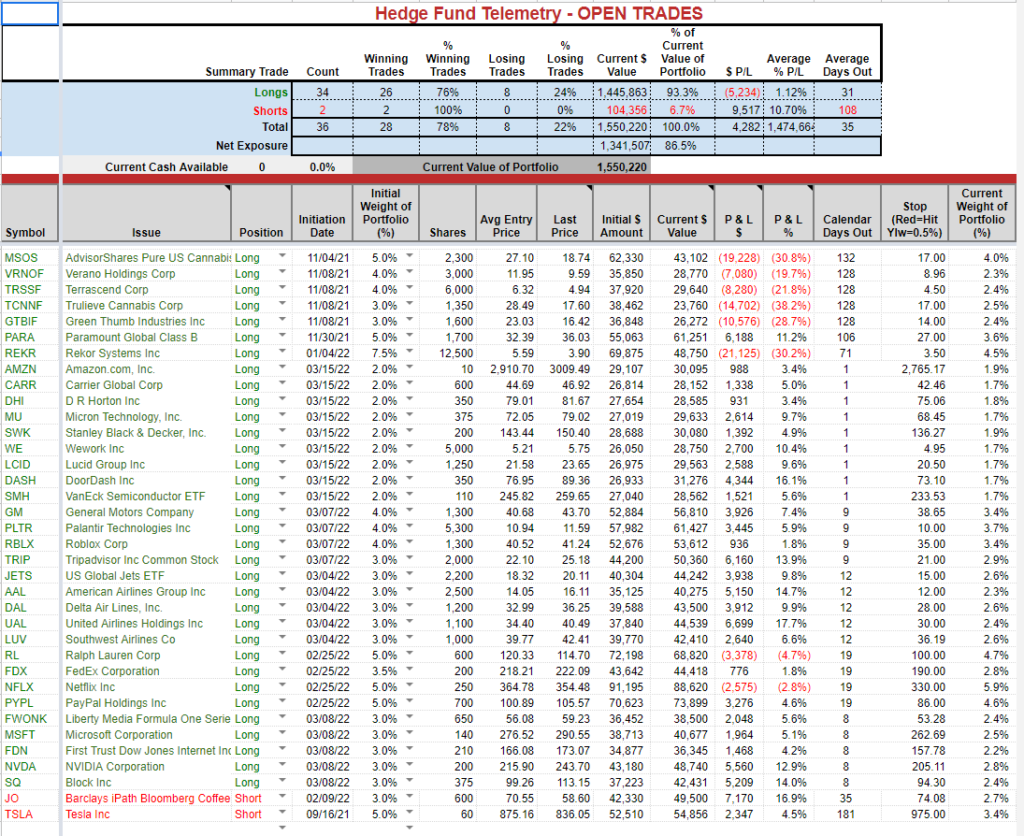
The average of the stocks I have just put on are up 6% so I am going to get piggish and hold through the Fed and if I give some up I won’t lose sleep. If something dramatic happens, I’ll shoot out a late note. If you are long as well and are concerned, taking partial profits today won’t get an argument from me. Here’s the current Trade Ideas Sheet. (yeah, I know cannabis… hang in there)
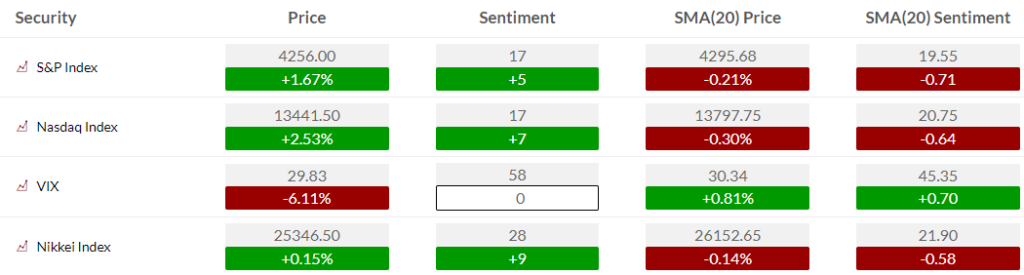
US MARKET SENTIMENT
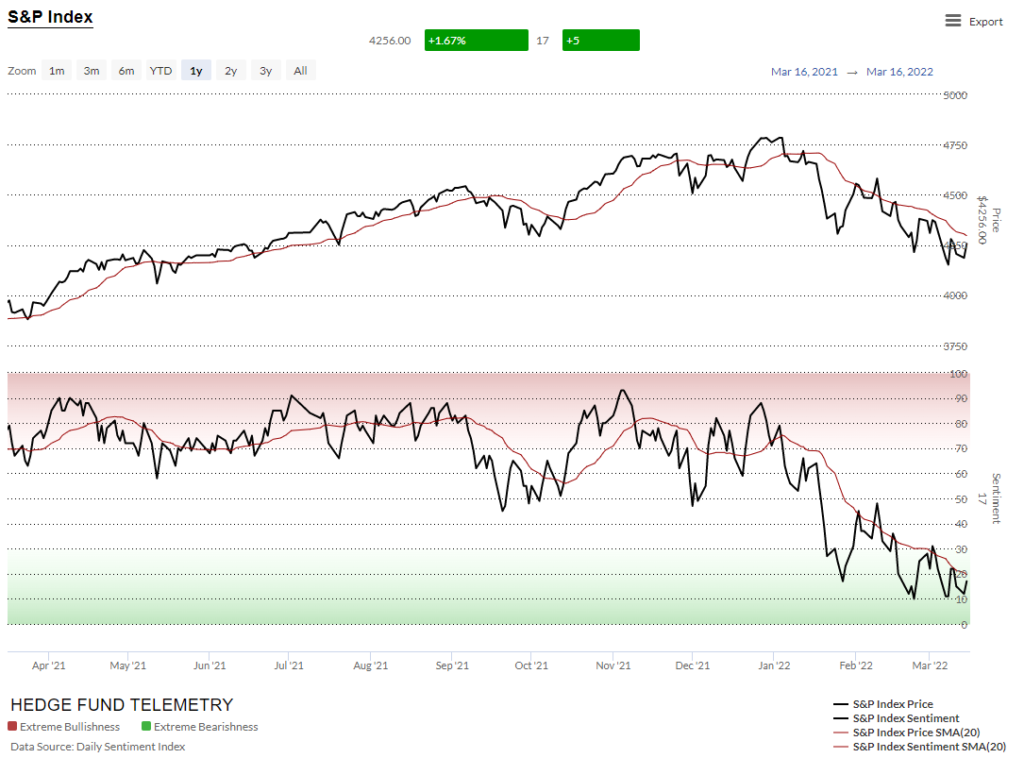
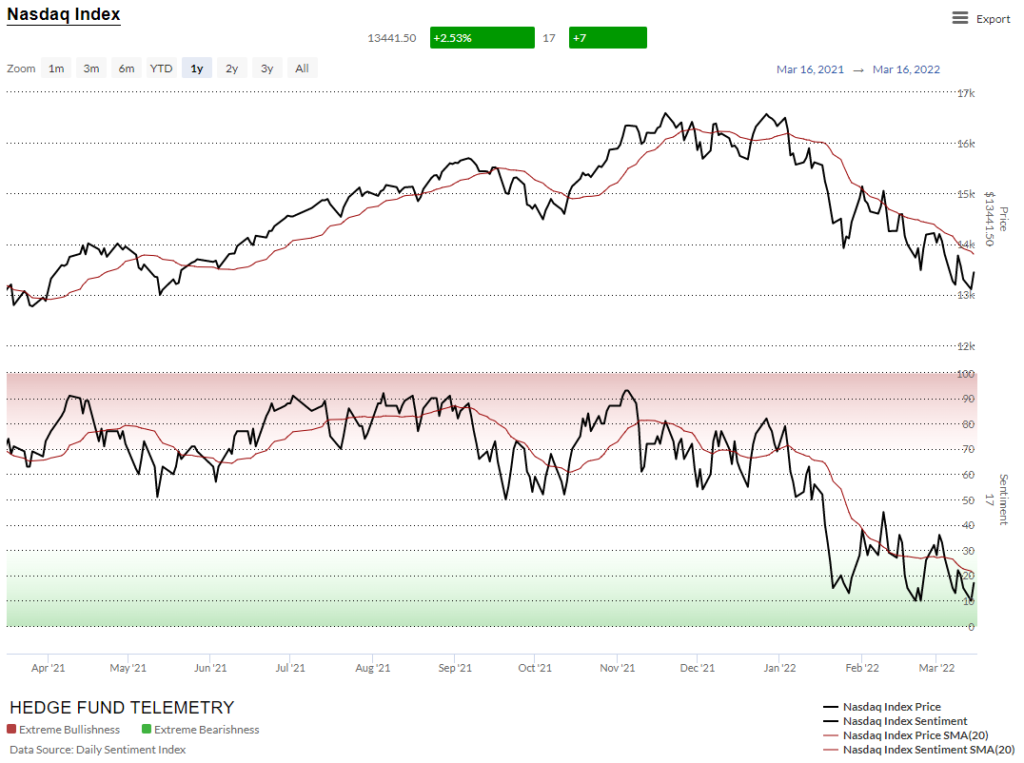
Here is a primer on how we use Daily Sentiment Index charts. S&P bullish sentiment and Nasdaq bullish sentiment has been deeply oversold and sentiment is a condition that can and has stayed depressed. The DeMark exhaustion signals are the trigger.
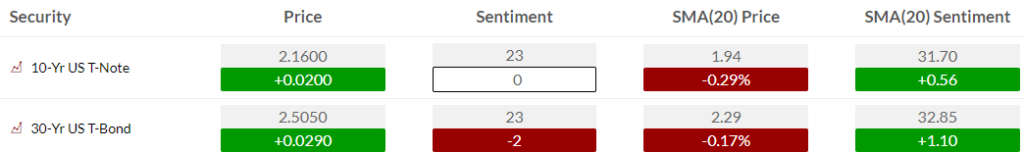
Bond bullish sentiment depressed as well
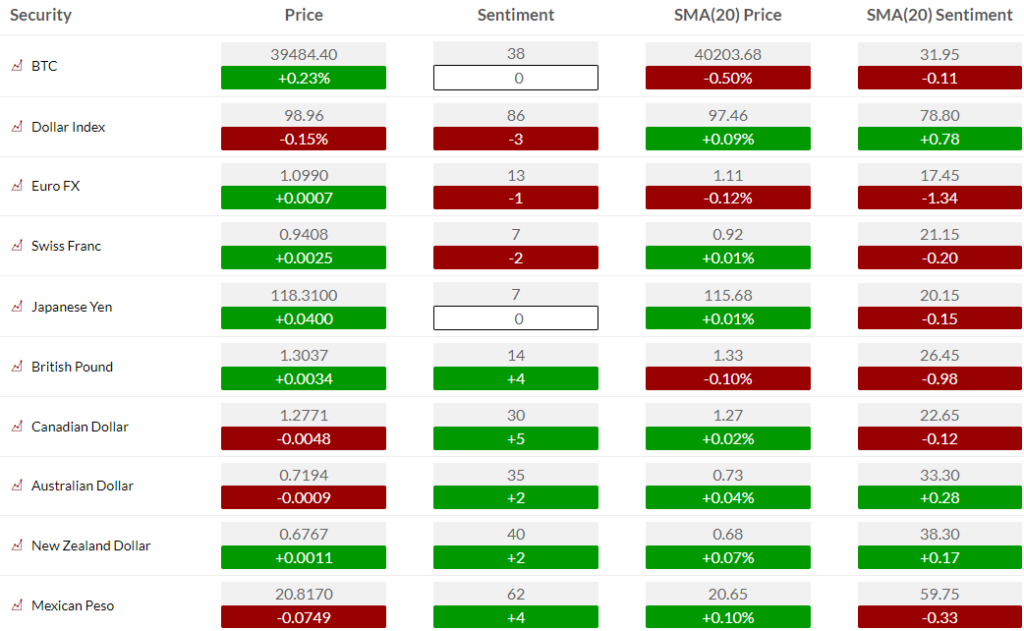
Currency bullish sentiment has had a theme of strong US Dollar and that might start to change
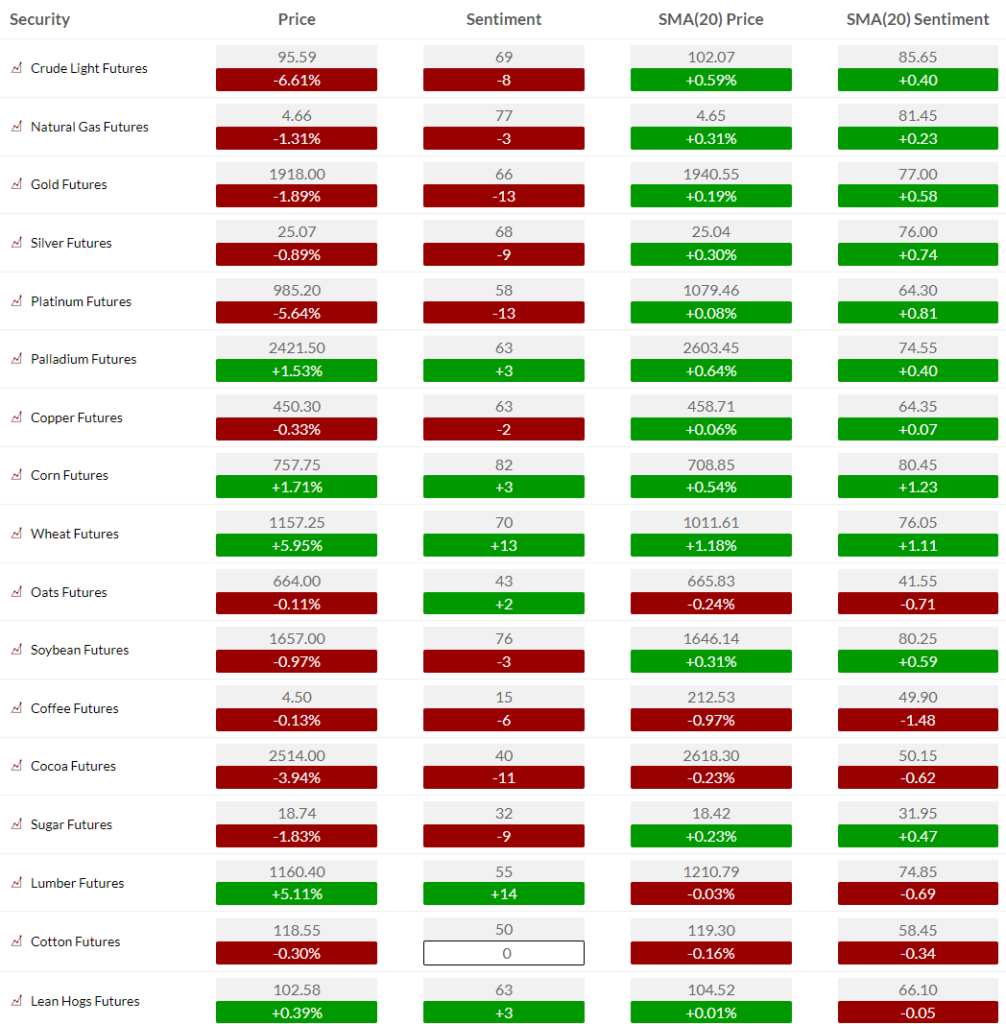
Commodity bullish sentiment has backed off and remains elevated. Last week had peak extreme readings I’ve never seen so high occurring altogether.
US MARKETS
Here is a primer on the basics of the DeMark Setup and Sequential indicators.
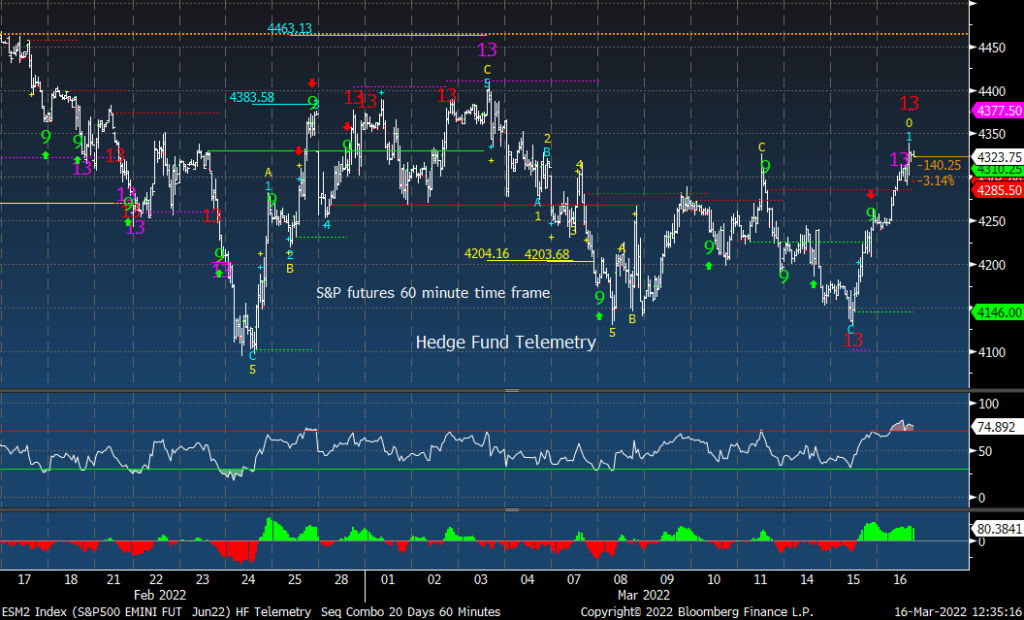
S&P futures 60 minute achieved the downside wave 5 price objective with a buy Setup 9.
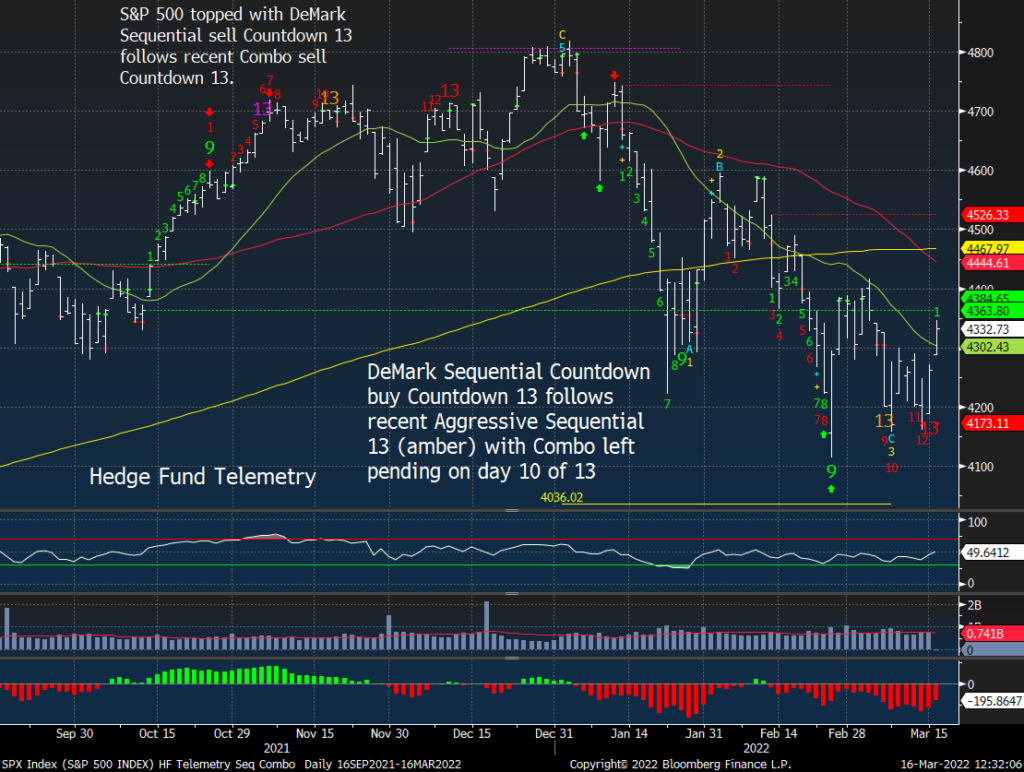
S&P 500 daily gapped down again and typically that’s very bad which leads to continuation.
The Nasdaq 100 futures 60 minute also had a buy Setup 9 with a decent reversal starting
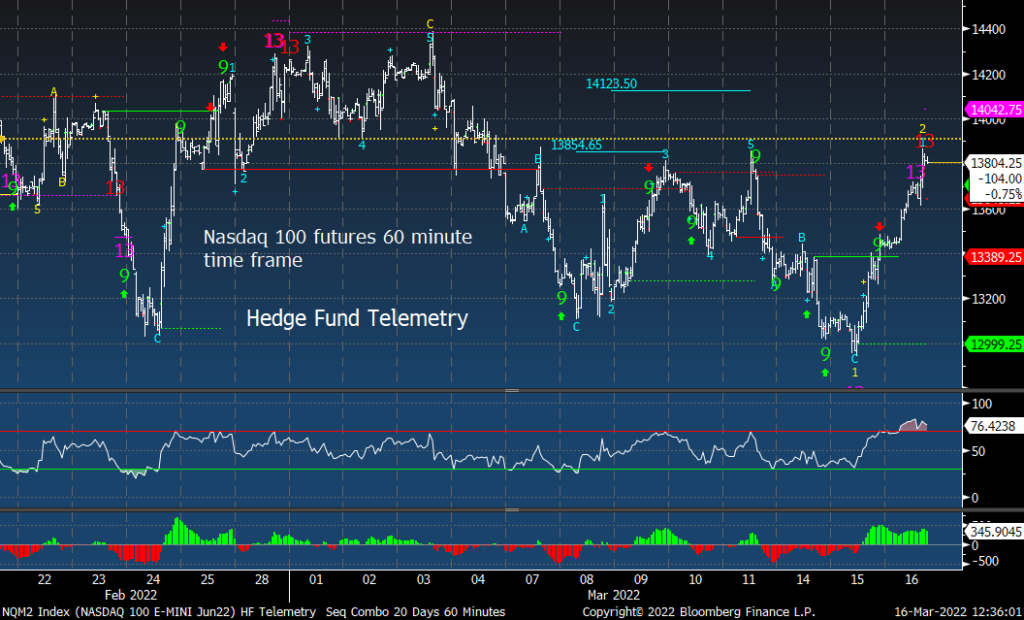
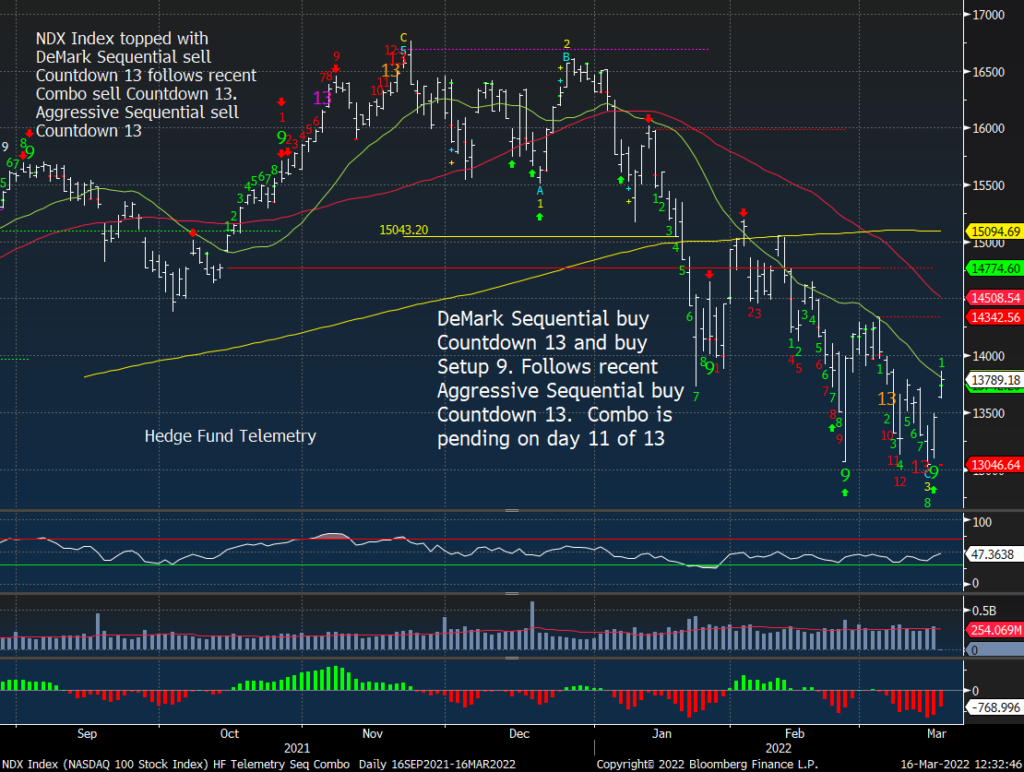
NDX index broke the 50 day hard and nearly achieved the downside wave 3 price objective
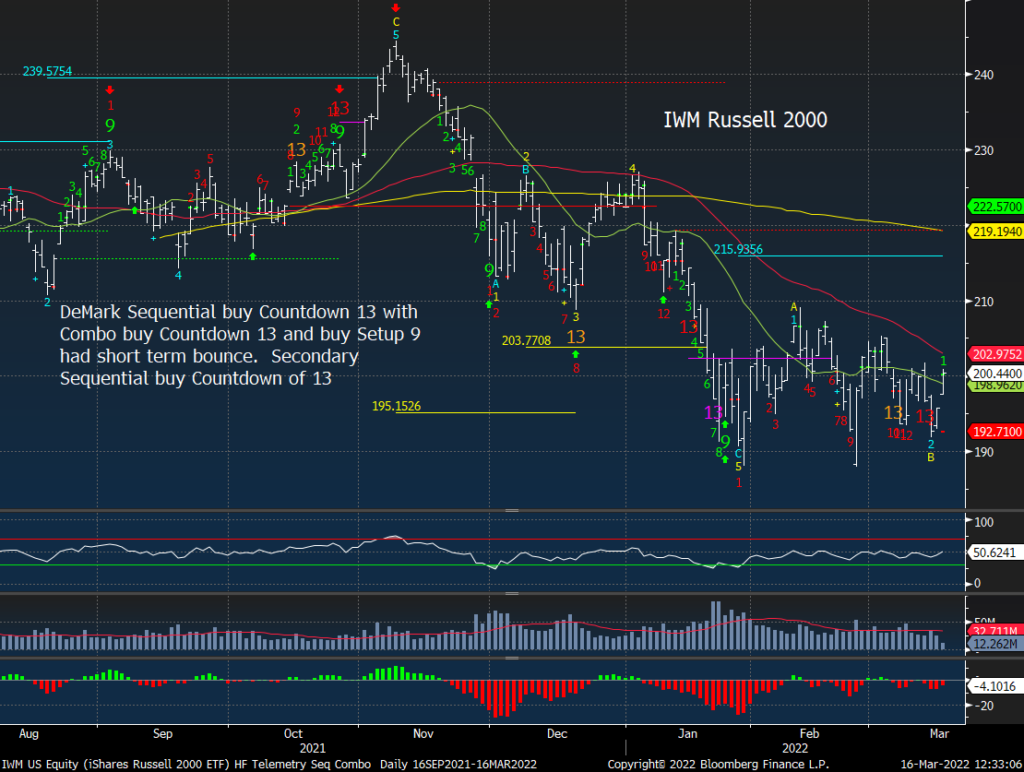
Russell 2000 IWM daily has the Sequential on day 12 of 13 and needs a little lower level to qualify the 13
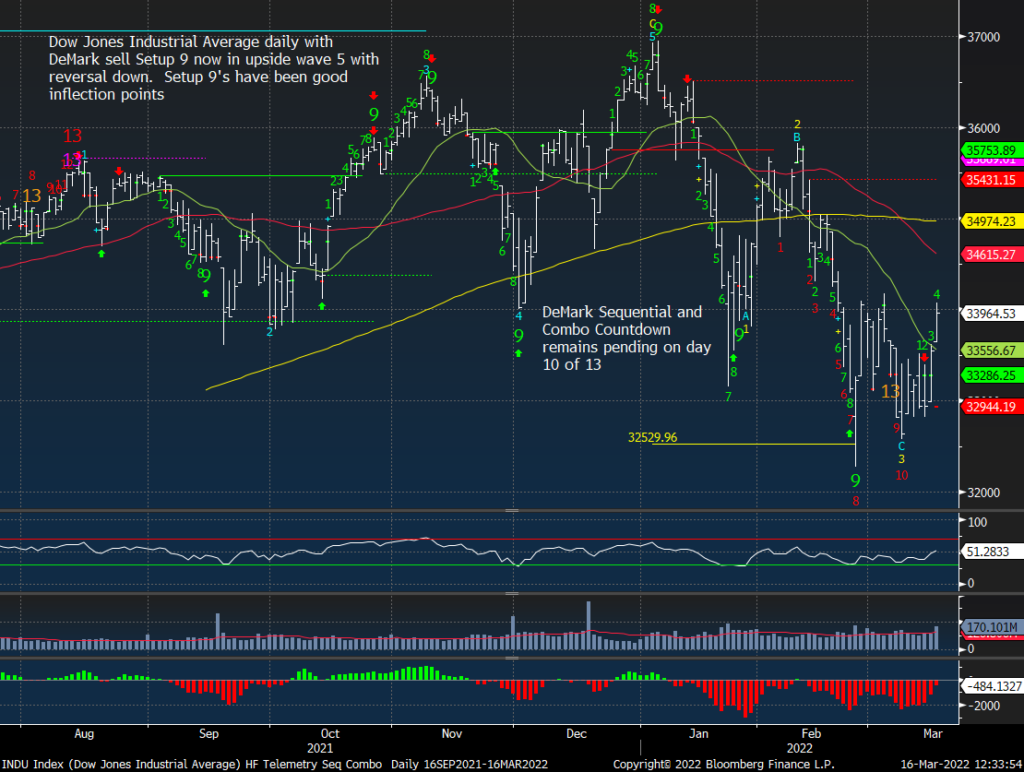
Dow Jones holding the 50 day and not down so bad vs other indexes
US DOLLAR UPDATE
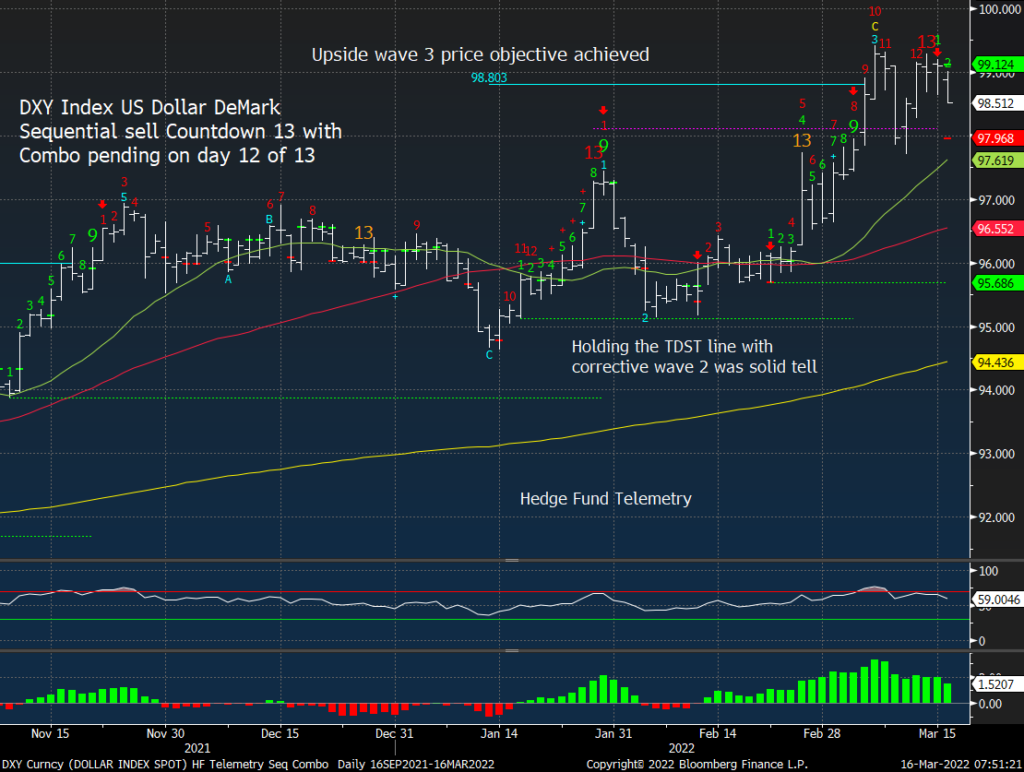
Keep an eye on the Dollar for a pullback
BOND UPDATE
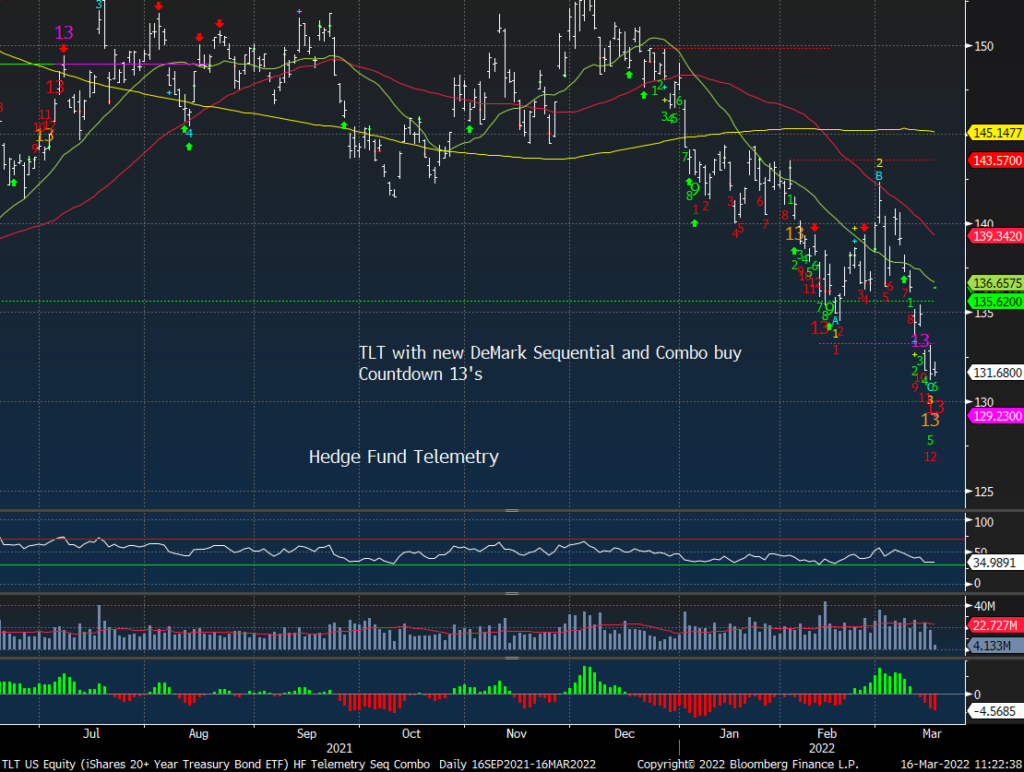
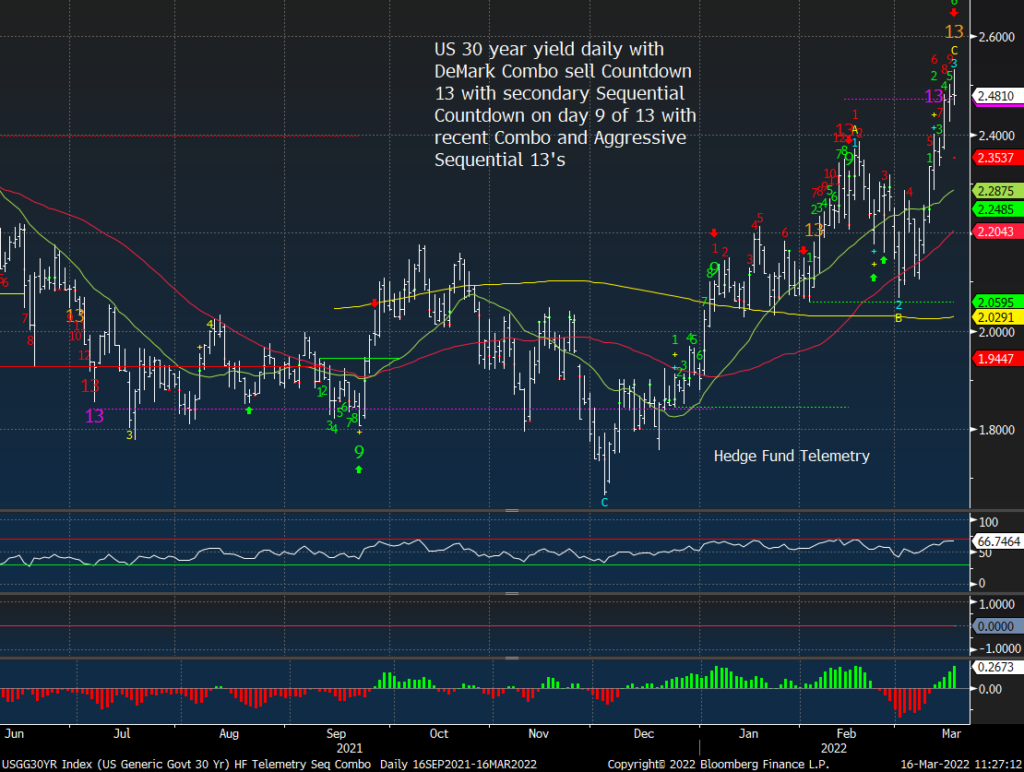
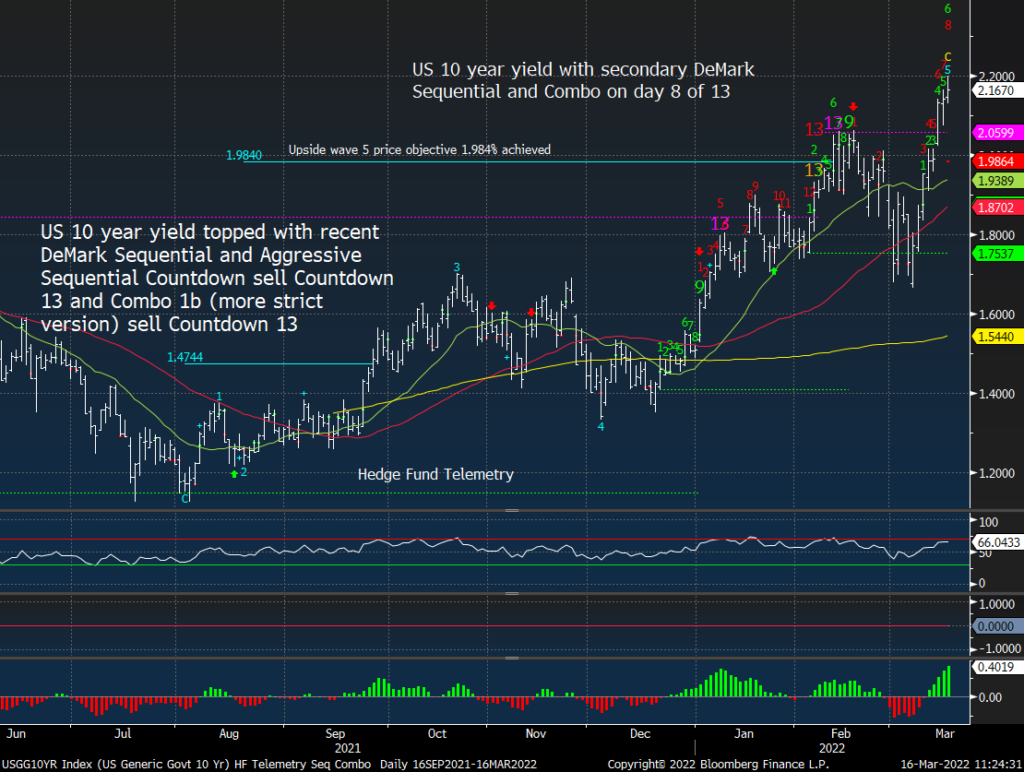
TLT has some DeMark Countdown 13’s while the 30 and 10 year yields do not. Tempted to buy bonds but holding off
FACTORS, GOLDMAN SACHS SHORT BASKETS AND PPO MONITOR UPDATE
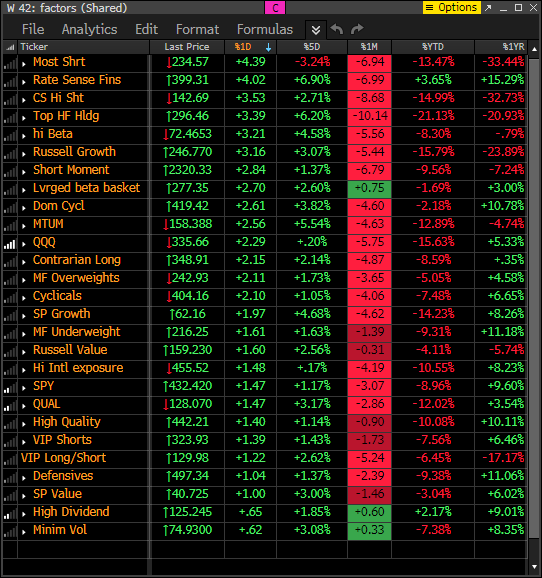
Factor monitor now has a reset YTD performance column. Factor monitor now has a reset YTD performance column. Nearly everything is down YTD yet the 5 day rolling has been improving as I mentioned yesterday and now the 1 month rolling might start to improve.
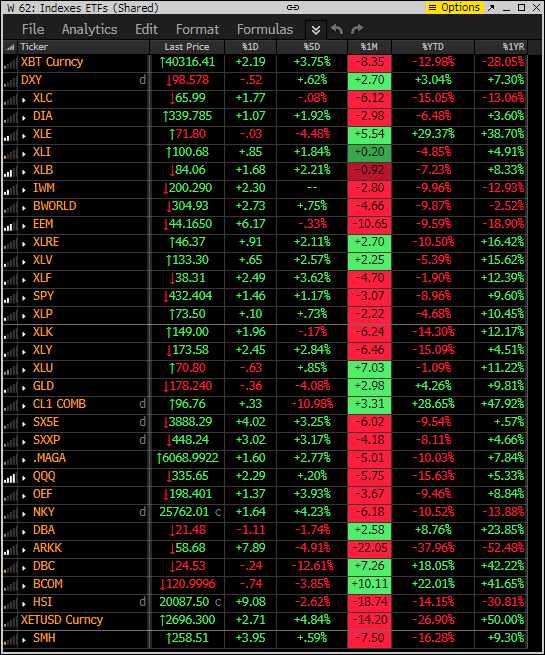
This is similar to the above monitor with various ETFs other indexes as I wanted to show the same 5 day, 1 month rolling as well the YTD and 1 year. The 5 day performance has been getting better as is the 1 month rolling.
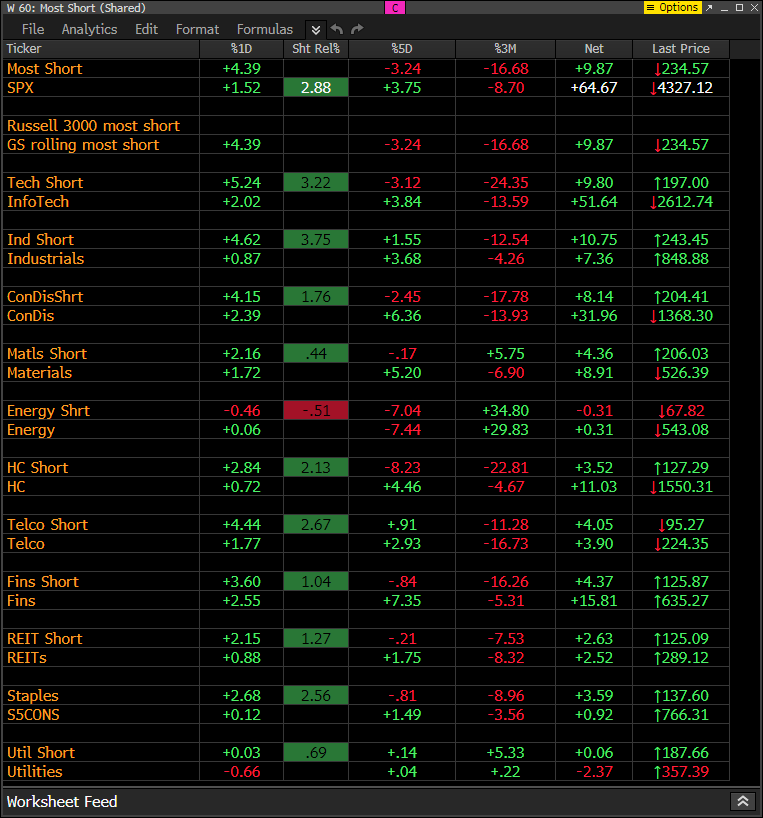
This is the monitor that has the S&P indexes and the Goldman Sachs most shorted baskets. Today the shorts are getting squeezed harder than the S&P indexes which are up nicely a sign of real buyers
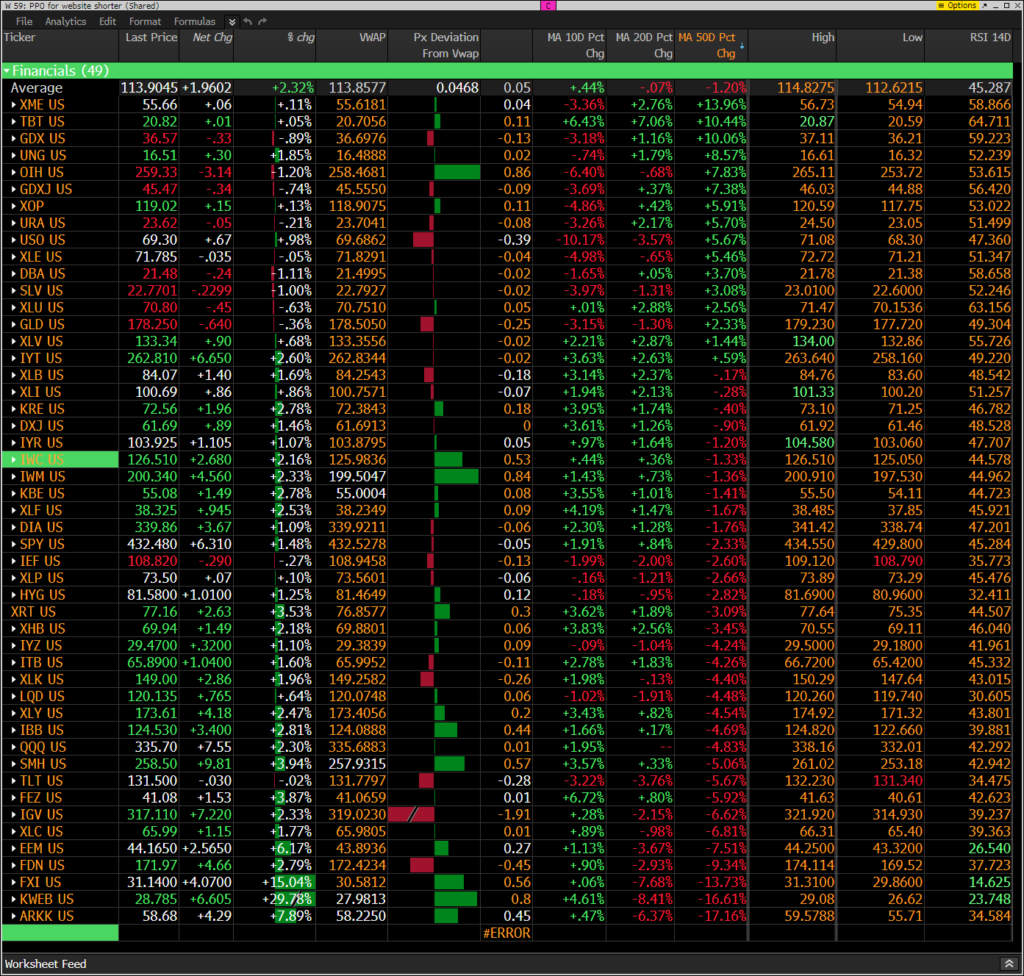
The PPO monitor (percentage price oscillator) force ranks ETF’s by percentage above/below the 50 day moving average. For information on this monitor please refer to this primer. This monitor is offered to Hedge Fund Telemetry subscribers who are on Bloomberg. Yesterday I mentioned some potential for rotation with what has worked on top starting to break their 10 day moving averages and vice versa on the lower half of what hasn’t worked.
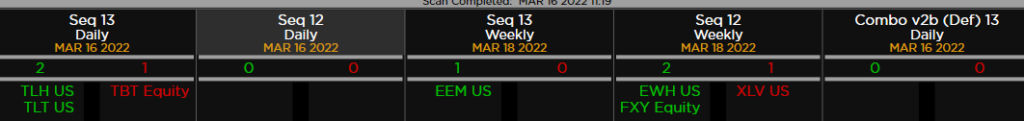
DEMARK OBSERVATIONS
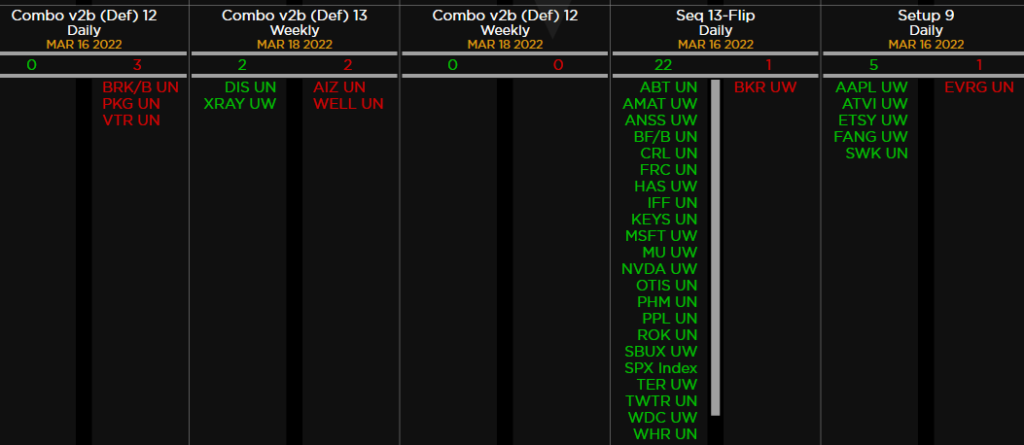
Within the S&P the DeMark Sequential and Combo Countdown 13’s and 12/13’s on daily and weekly time periods. For information on how to use the DeMark Observations please refer to this primer. Worth noting: Price flips!
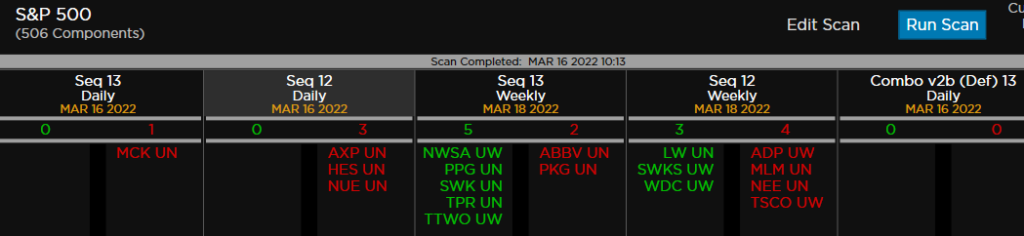
Seeing a few buy signals starting to develop with the price flips adding to confirmation. A “price flip” is defined as a contra-trend move identified by a close that is higher/lower than the close four price bars earlier.
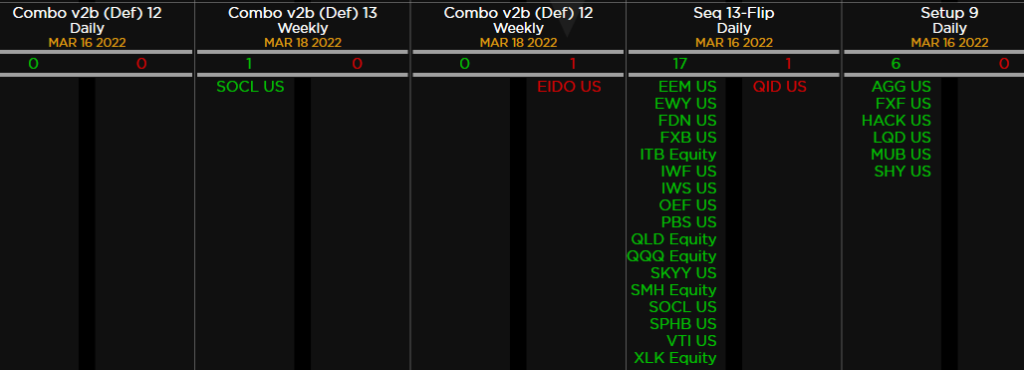
ETFs among a 160+ ETF universe. A lot of price flips here too