or how I learned to stop worrying and love the fed

If you are a movie fan like me Dr. Strangelove is still up there as one of my favorite films ever. It’s a dark comedy about the prospects of nuclear war. Looking back at the hysteria over the threat of nuclear war in the 1950s and how this film made light of the characters that are in government and the military holds up well today. Stanley Kubrick wrote and directed it with an unreal cast with Peter Sellers playing several roles. Reminds me about today and how hysterical people are about the Fed raising rates at a time when actual nuclear war was recently threatened by the Russian President.
Don’t get me wrong, I see and acknowledge all of the structural problems in the markets and the economy. It won’t take much to cause mass panic selling however at this point, it might be OK to stop worrying about the Fed and rent the bull costume for an exploitable bounce. I know the old saying “Don’t fight the Fed” but the data shows after the first hike things are not that dire going forward. From Janney:
“Since World War II, the Federal Reserve has
embarked on a rate increase cycle 17 times. Six
months following the initial rate hike, the S&P 500 on
average was up only 1.3%. However, significant
losses in 1946, 1973, and 1987 drove this average
down. Minus these three years, the average rises to
4.91%. Post-war inflation, dislocations from an oil
embargo, and what some people think was simply a
Fed error led to the losses in those years.
A similar situation was present 18 months after an
initial rate boost. Backing out the post-war losses in
1946, lingering problems from the Vietnam War in
1968 and the 1973 oil situation more than doubles
the average gain months after the first rate increase.”
How about this chart of the last two rate hiking and cutting cycles? The chart is dated but you’ll get the point.
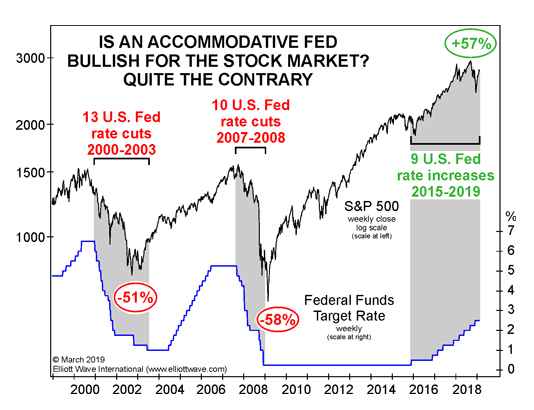
If the Fed was raising rates a year ago with markets at highs and before the internal damage with the average stock down massively, I could agree the Fed is going to cause some problems.
Below I have a bunch of constructive charts of internals and things that might make you understand why I’m not worried about the Fed for right now and how I see an exploitable bounce. It’s not an all-clear as there are still risks with Ukraine, Russia and soon earnings growth slowing. We just have to pick our spots and long vehicles to ride as long as we can.
TRADE IDEAS
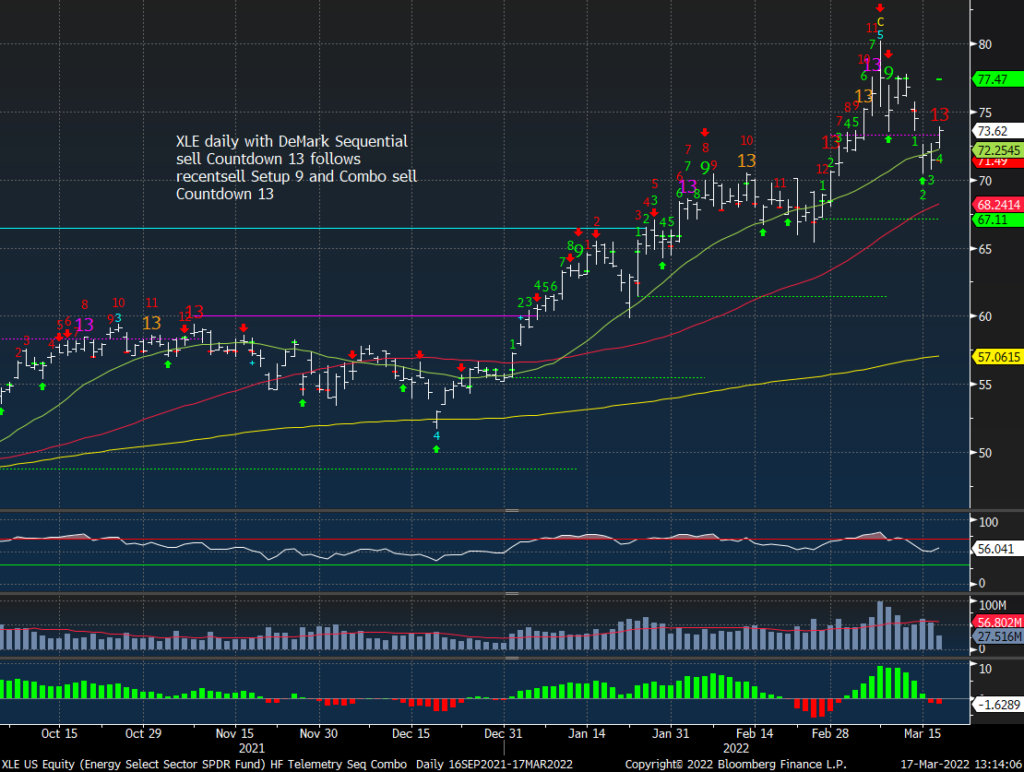
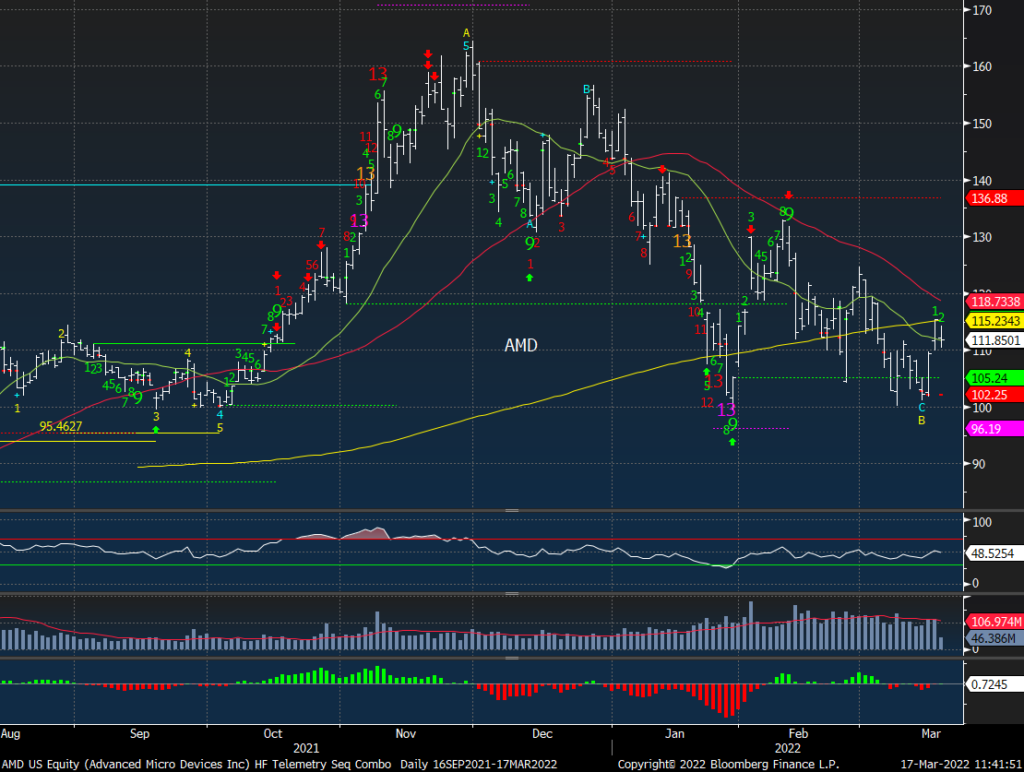
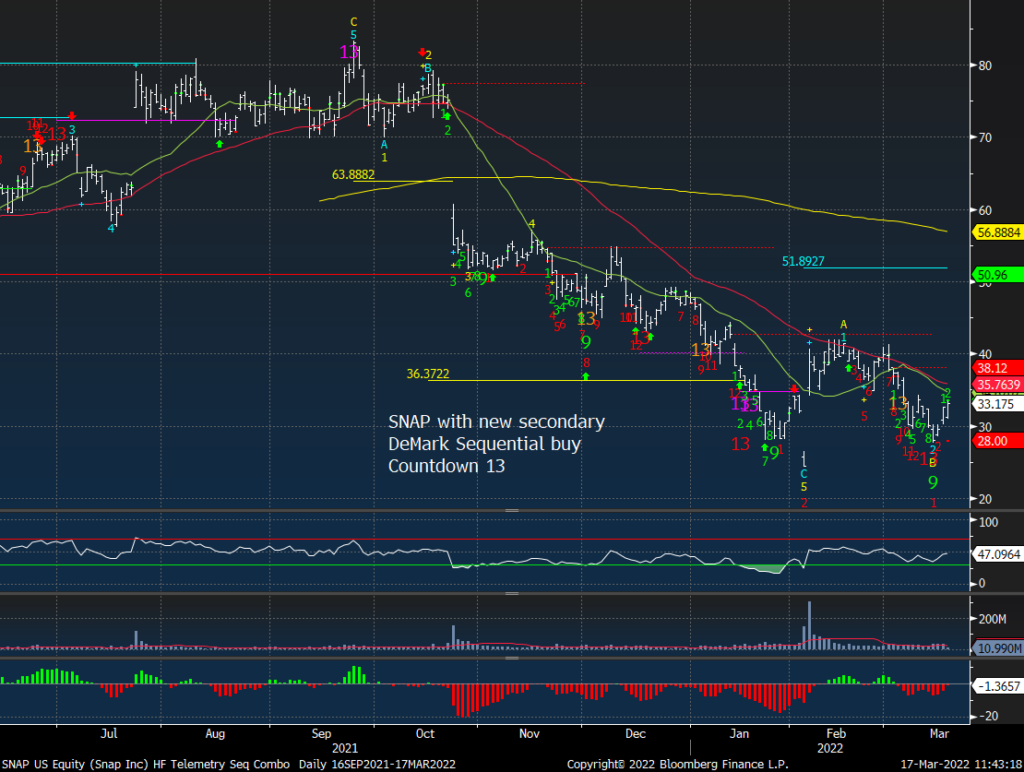
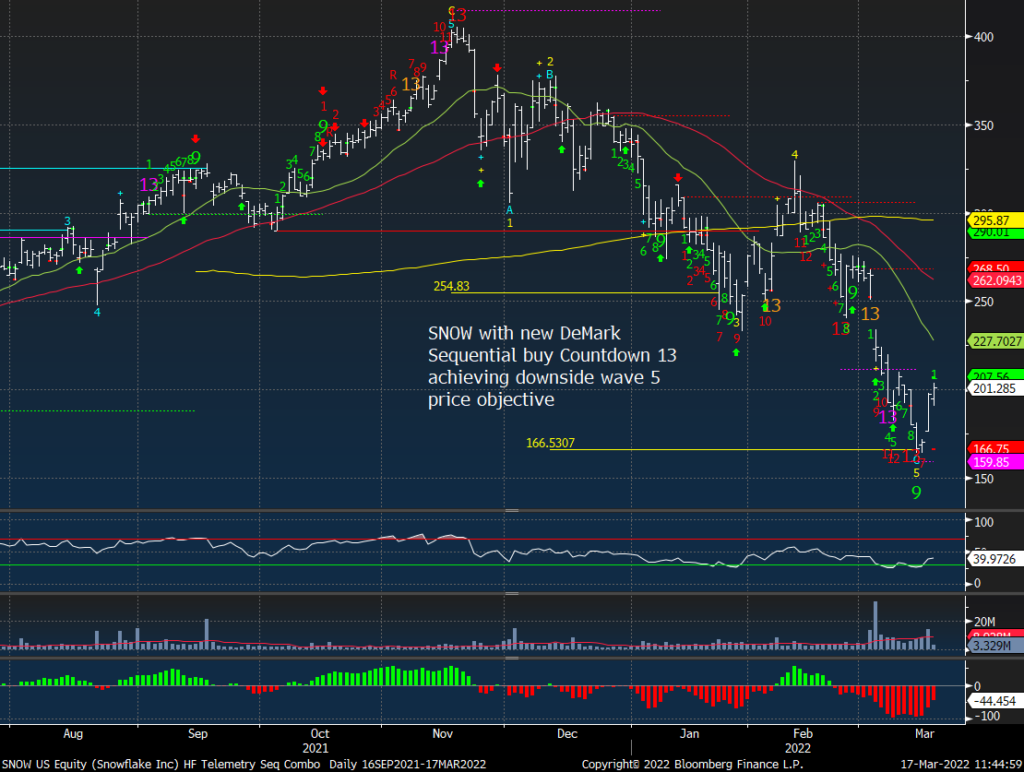
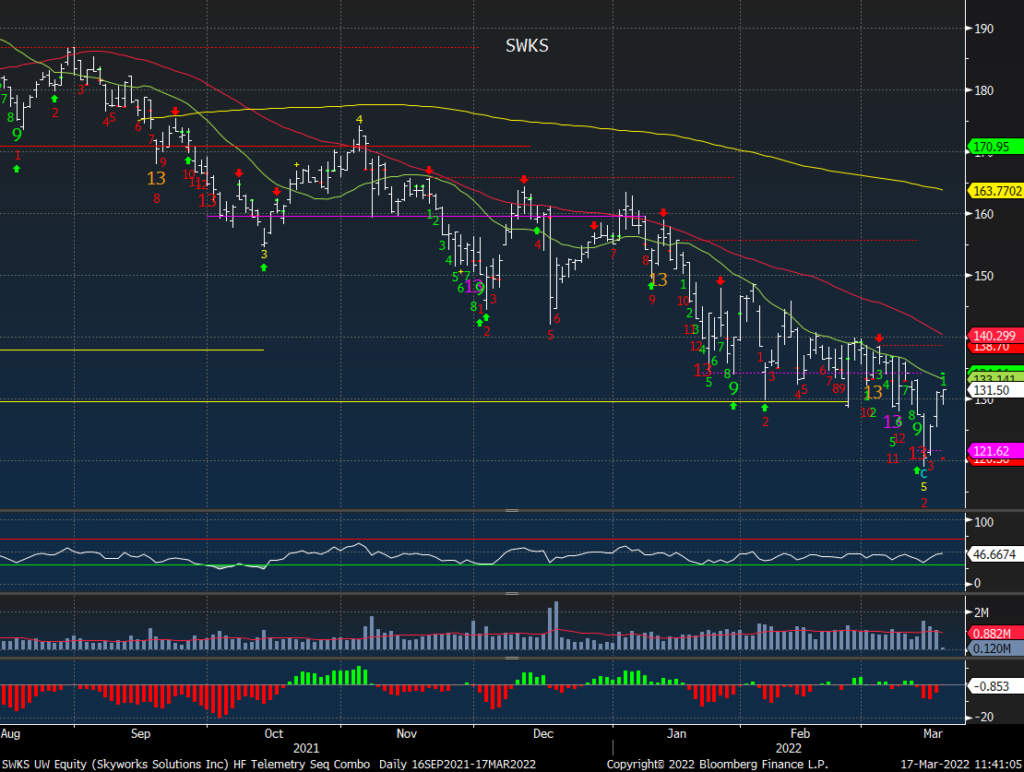
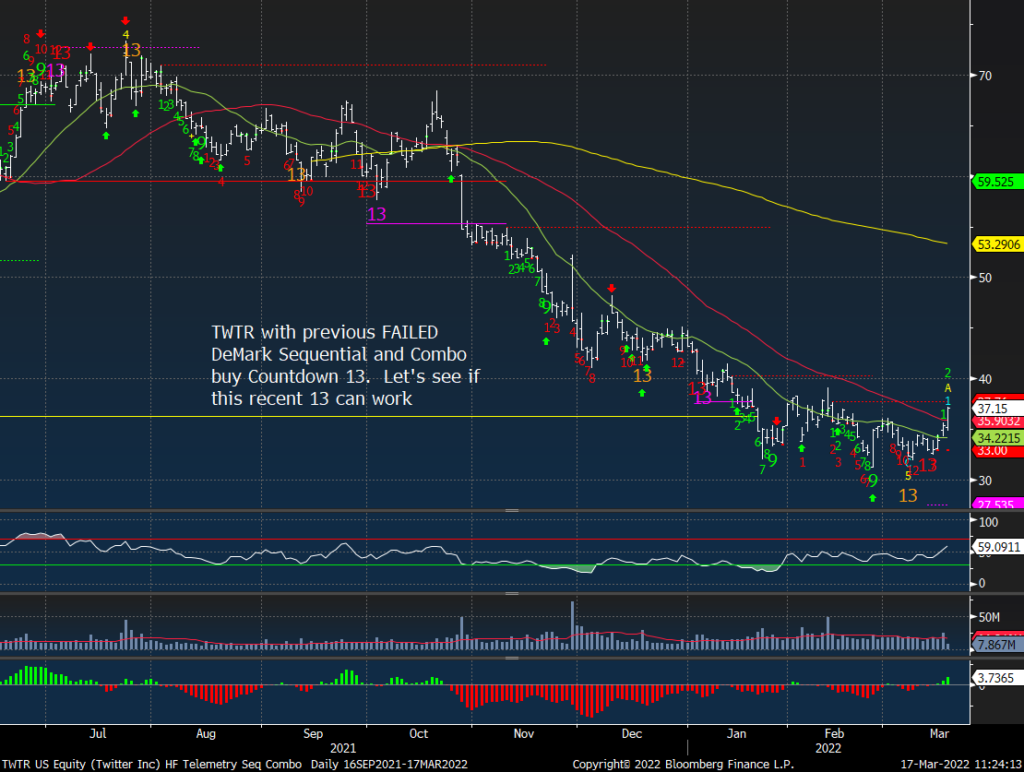
On the Trade Ideas sheet the longs are ripping and I’m going to hold everything for now as I have some downside cushion. I am shorting a 3% weight XLE with a new DeMark Sequential sell Countdown 13. I am adding more long exposure with a 3% sized long IWM. And 2% starter-sized longs: AMD, SNAP, SNOW, SWKS, and TWTR. If you didn’t take off the SPY, QQQ long call spreads (I did yesterday) you might be able to hold through tomorrow’s expiration as they are through the upper strike and collect the max on the call spread. All of the charts on this note below.
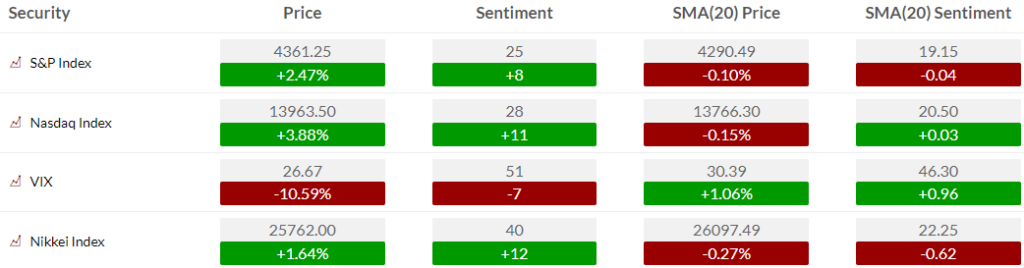
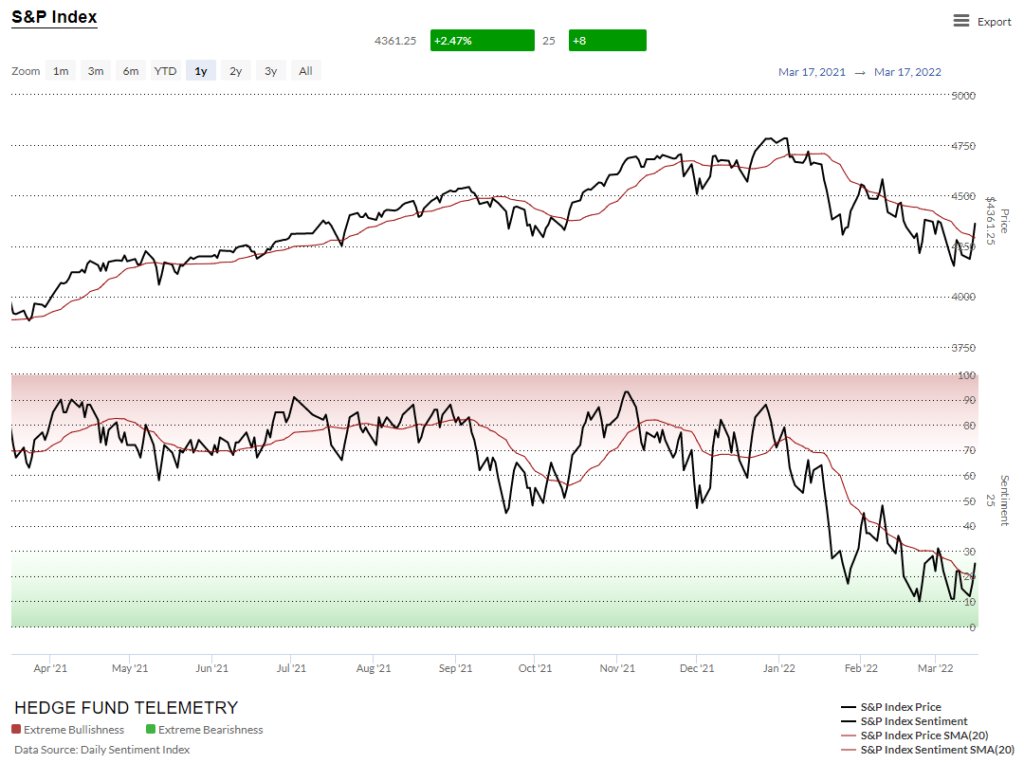
US MARKET SENTIMENT
Here is a primer on how we use Daily Sentiment Index charts. S&P bullish sentiment and Nasdaq bullish sentiment bounced again sharply and is now over the 20 day of sentiment. A positive
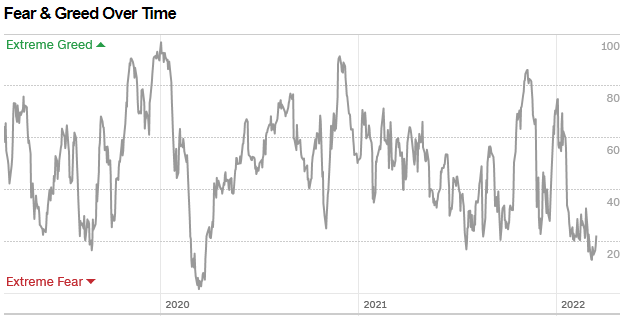
CNN Fear and Greed is a great sentiment reading because it shows what traders are doing rather than what they are saying. This is at levels where a turn up is very plausible
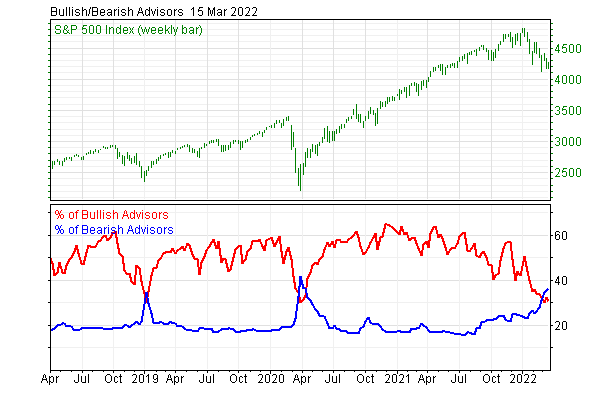
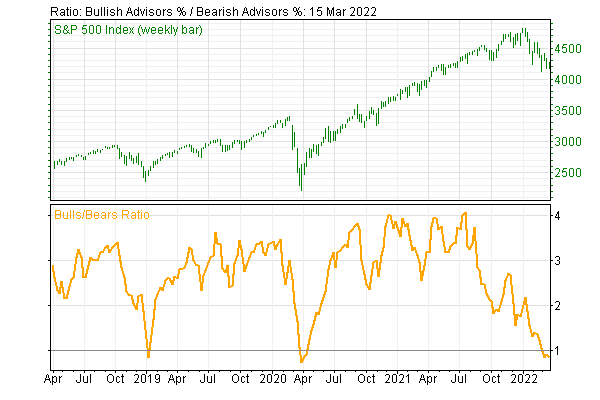
Investors Intelligence for the second week in a row shows more bears vs bulls. The bulls slipped back to 30.6%, from 32.2% last issue. That is just above their last February count of 29.9%, and just below their reading 30.1% from March/April 2020. The bears maintained their plurality among the advisors, again moving higher to 36.5%, from last week’s reading of 35.6%. That is the most bears since March 2020, when they were contracting from a higher 41.7% count that month.
OK, maybe I’m too early… so you can wait for next week’s reading which will be up
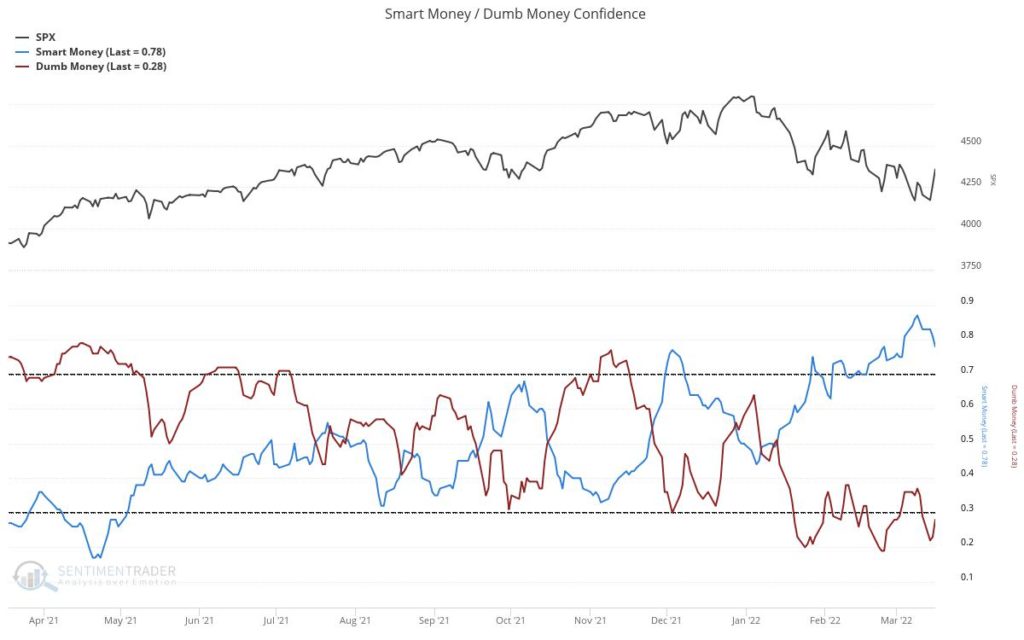
Jason from Sentimentrader.com has his smart/dumb money confidence readings at extremes too
US MARKETS
Here is a primer on the basics of the DeMark Setup and Sequential indicators.
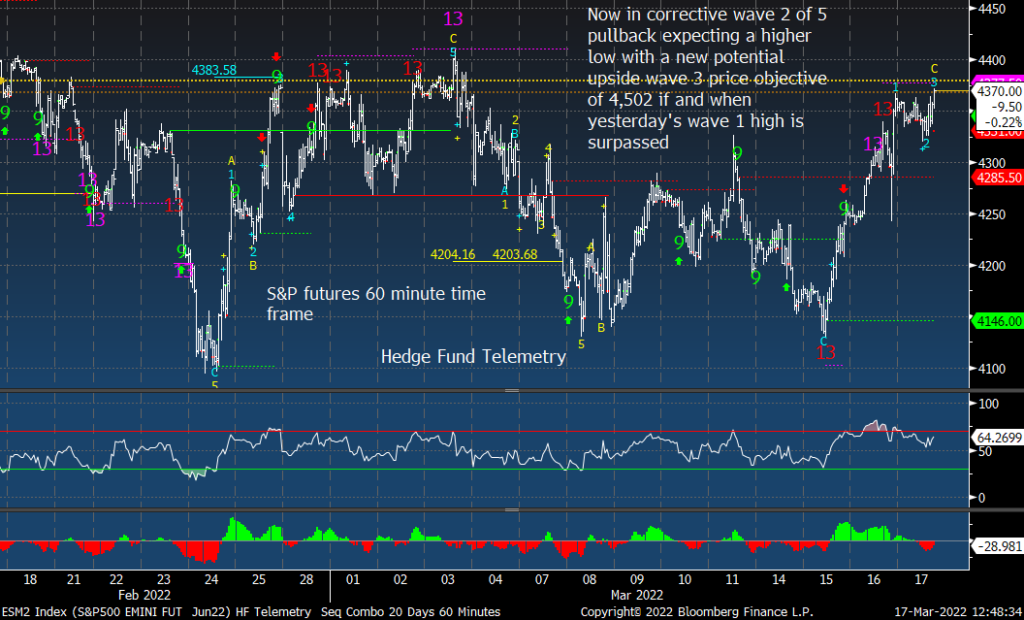
S&P futures 60 minute is now in upside wave 3 of 5
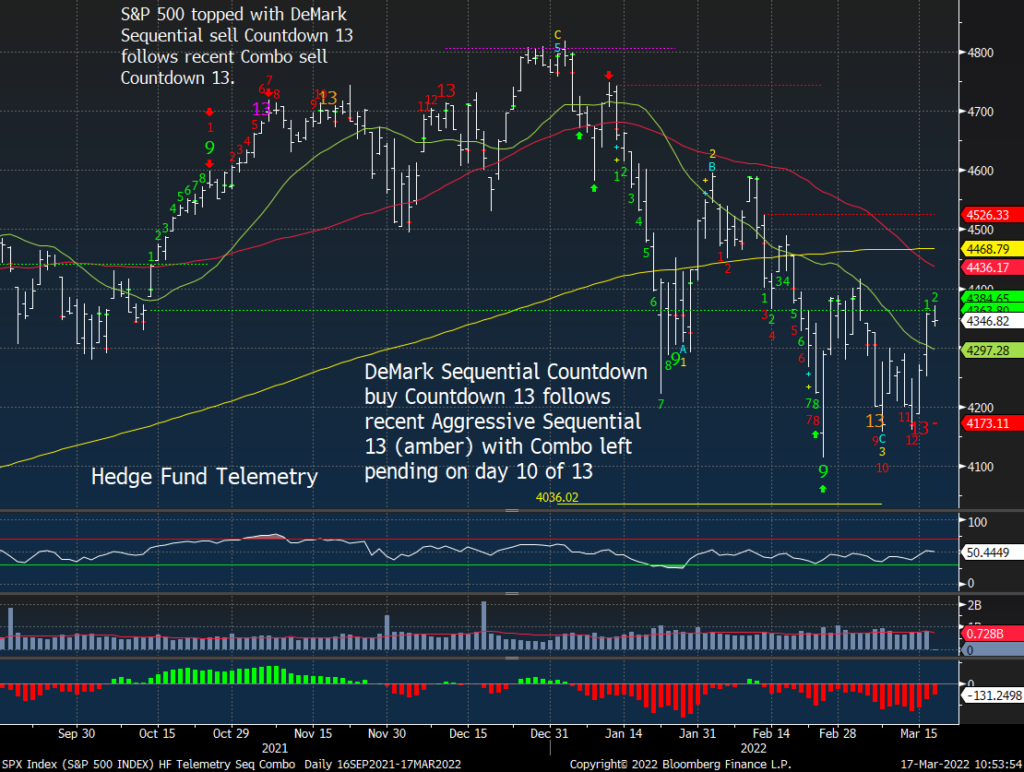
S&P 500 daily did get the Sequential buy Countdown 13 while the pesky Combo didn’t and would need a new low to qualify. Rather than waiting on that last indicator, I made my call.
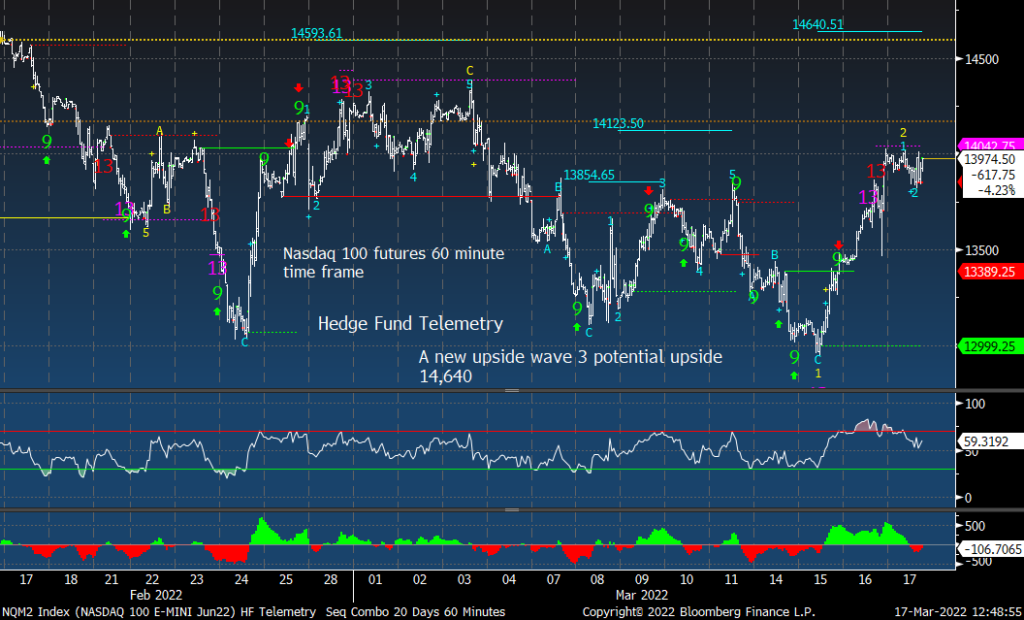
The Nasdaq 100 futures 60 minute still has a little more upside to qualify the wave 3
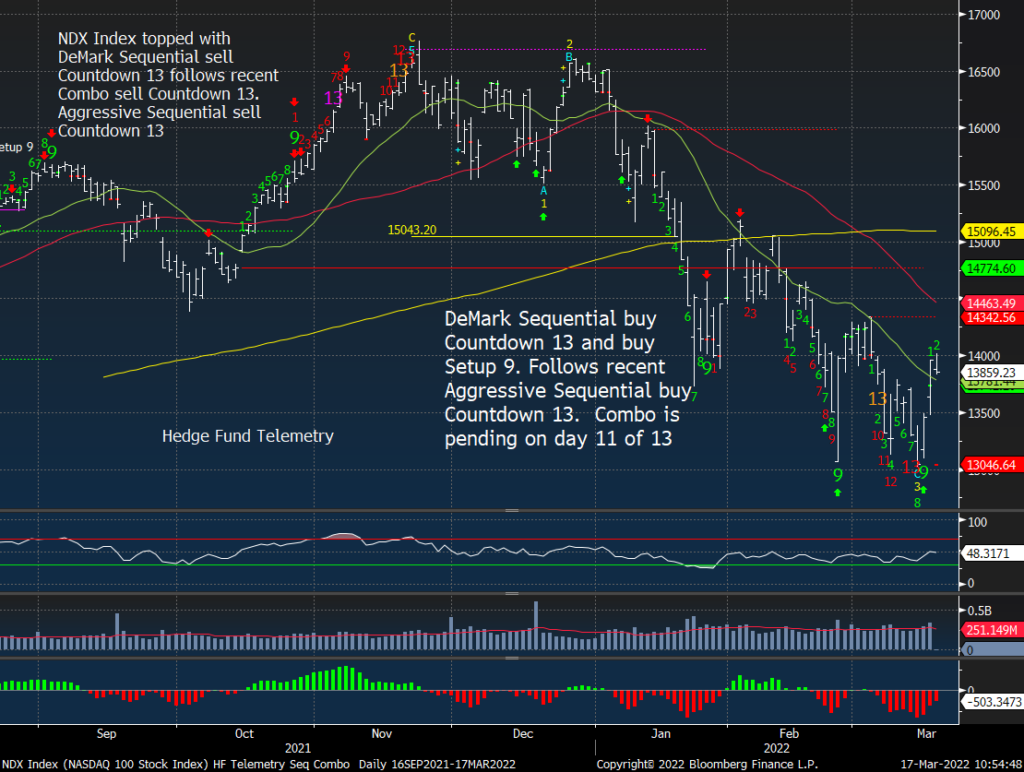
NDX index just like the S&P cash index has a Sequential buy Countdown 13 and pending Combo
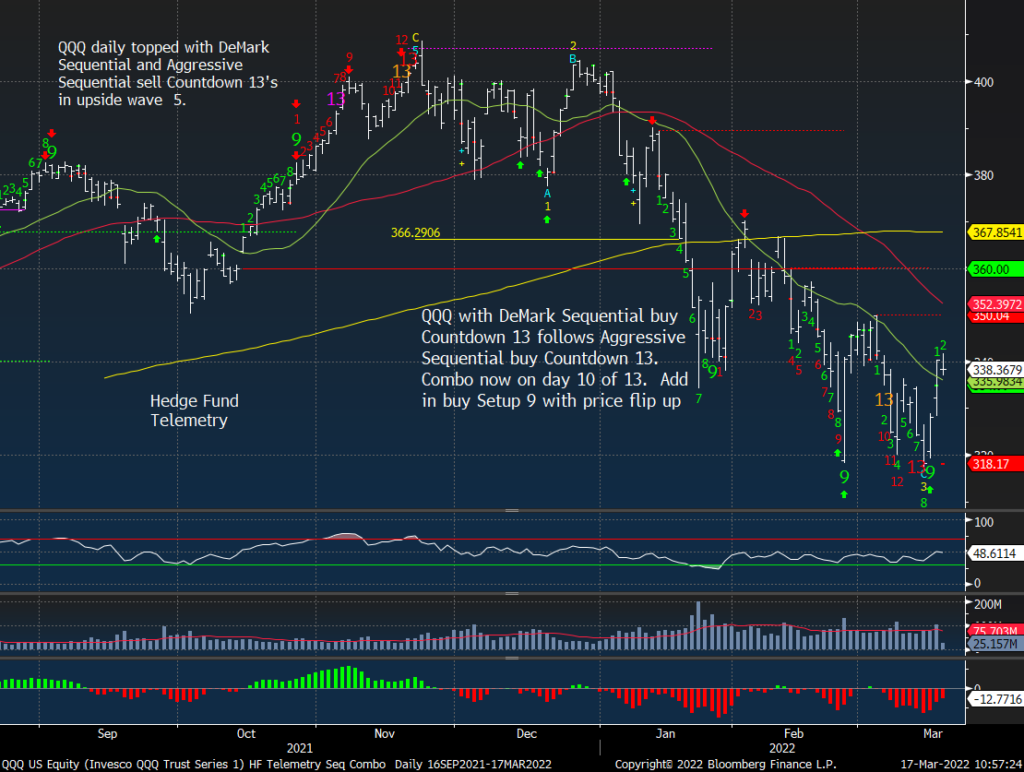
QQQ ditto
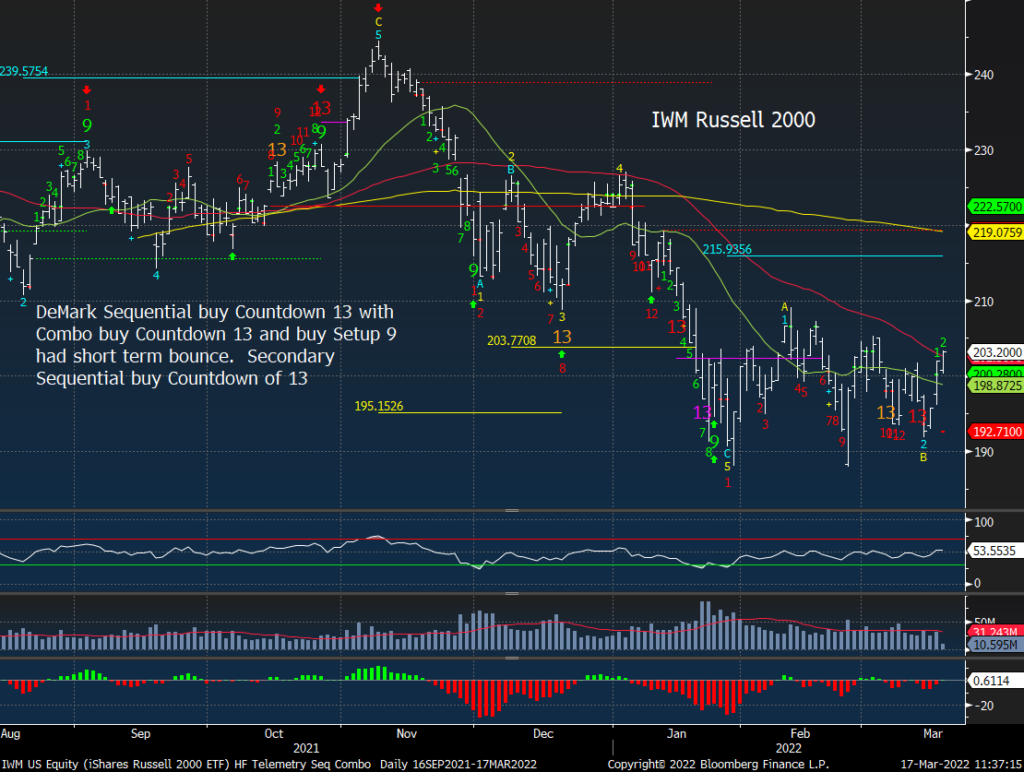
Russell 2000 IWM daily has the Sequential 13 and unlike the other indexes built a nice base to launch from so I’m adding a 3% weight long today
TODAY’S FOCUS – internals look constructive
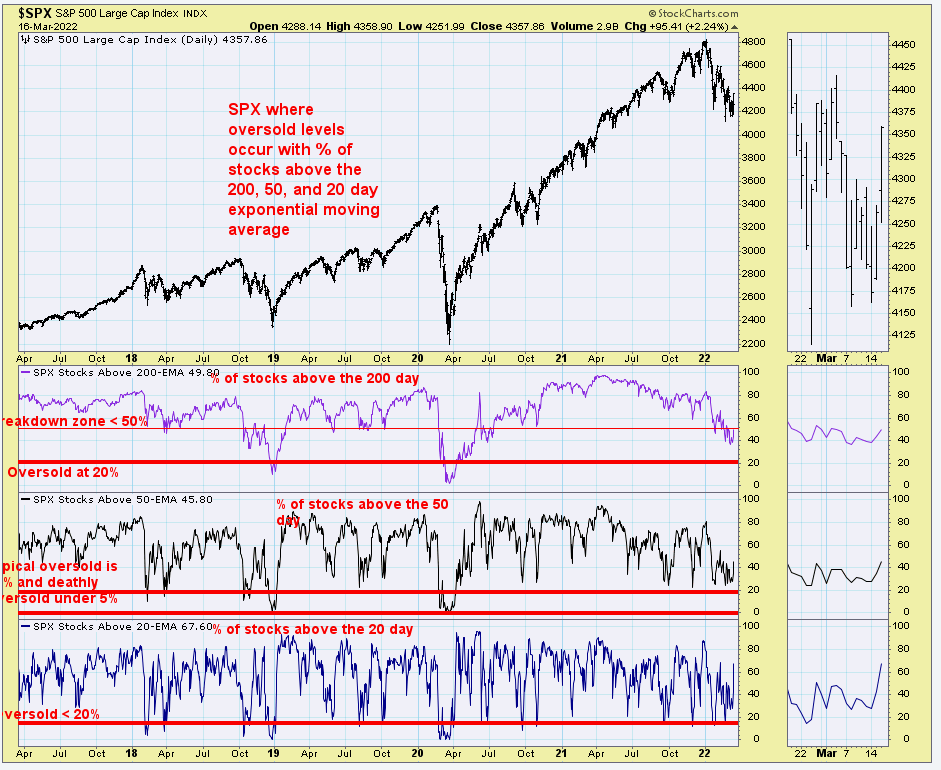
This is my go to oversold simple indicator with the percentage of stocks above the 20, 50, and 200 day moving averages. The 20 did get oversold enough while the 50 day was close. The 200 day is back above 50%
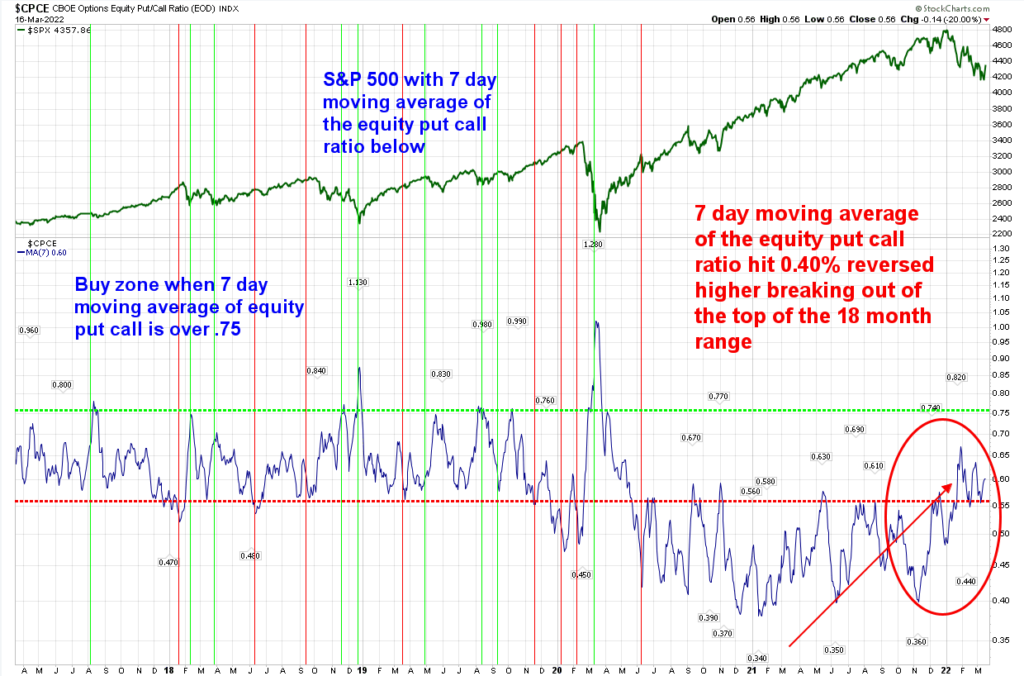
The 7 day moving average of the equity put-call ratio is now based above the last two years of excessive call buying and still at the low end of the historical range.
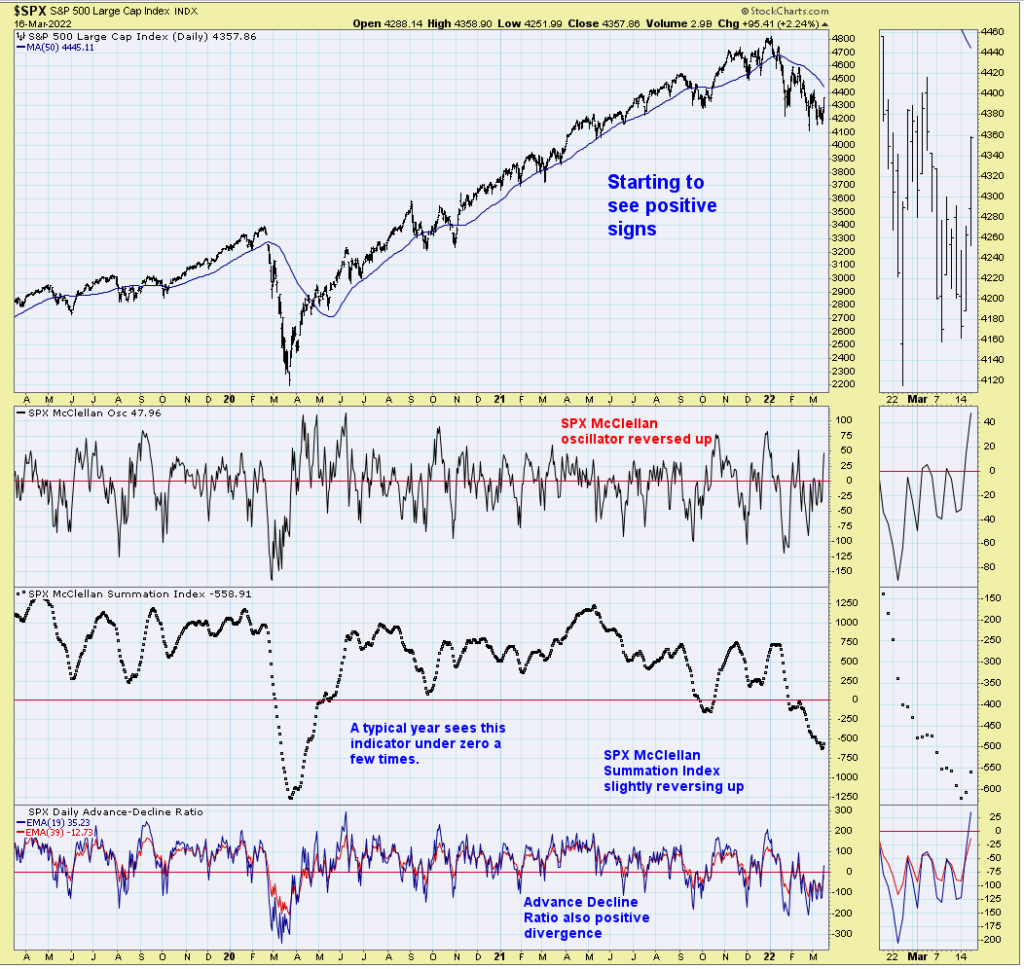
S&P with some McClellan indicators and the advance decline
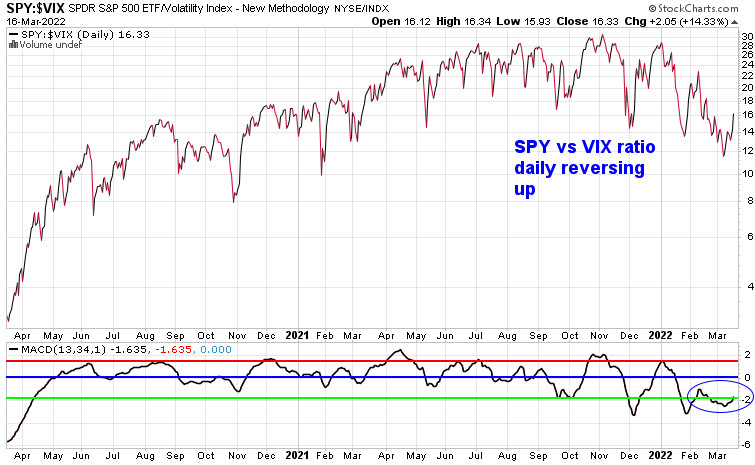
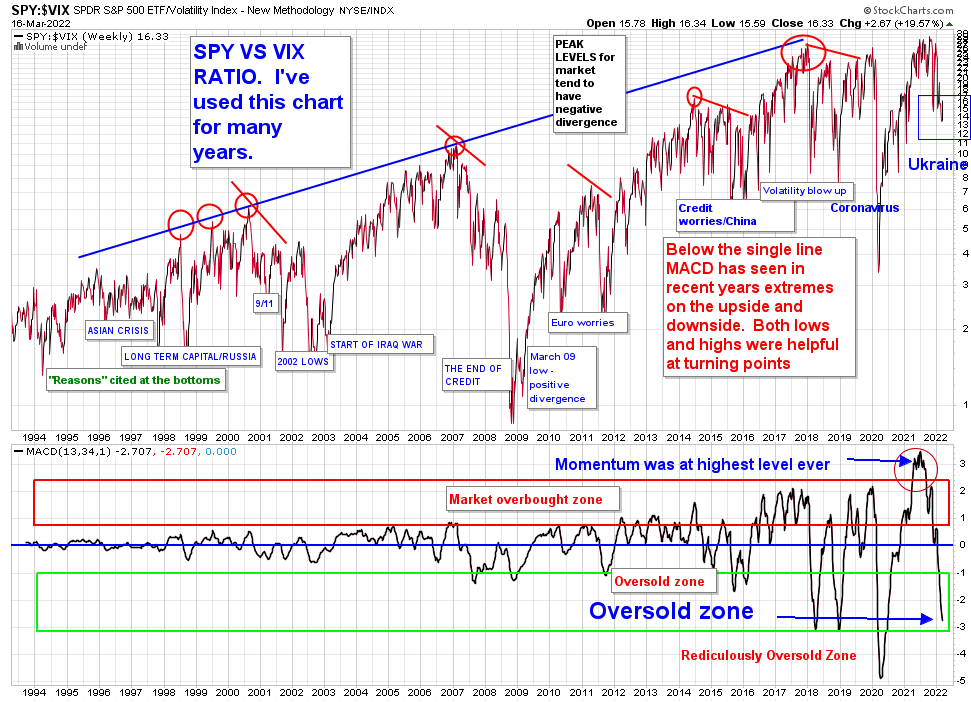
SPY vs VIX daily and weekly turning up on the daily and weekly after getting oversold
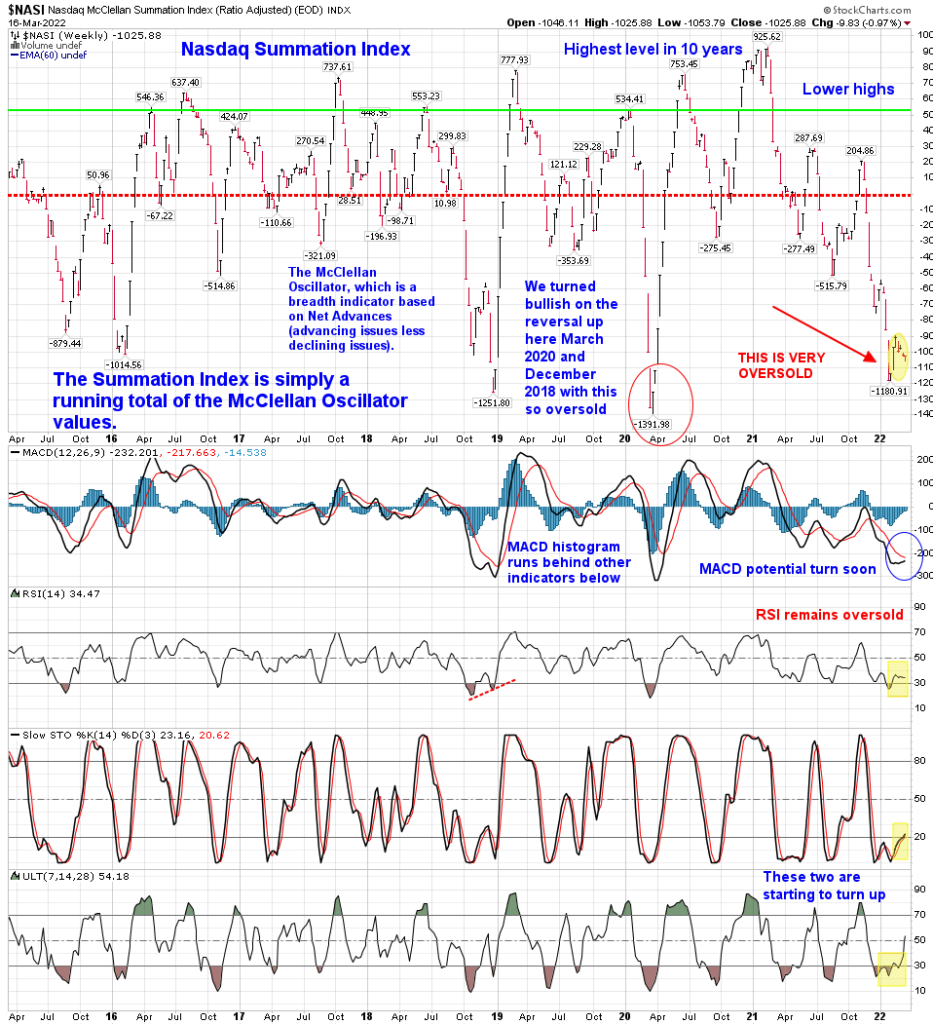
Nasdaq Summation Index weekly has been weird all year diverging from the index price and I get it now since the majority of Nasdaq stocks were crushed vs the mega cap. When this lifts you want to be long.
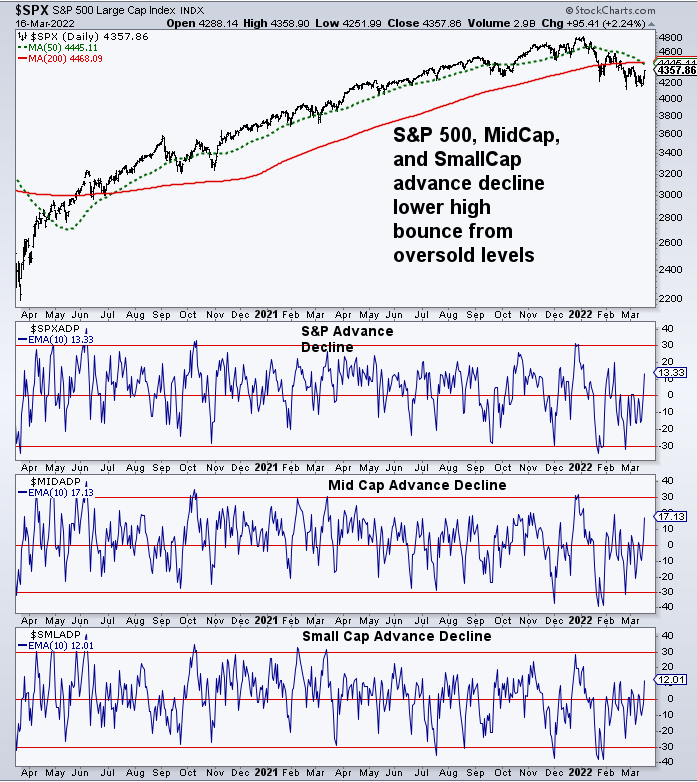
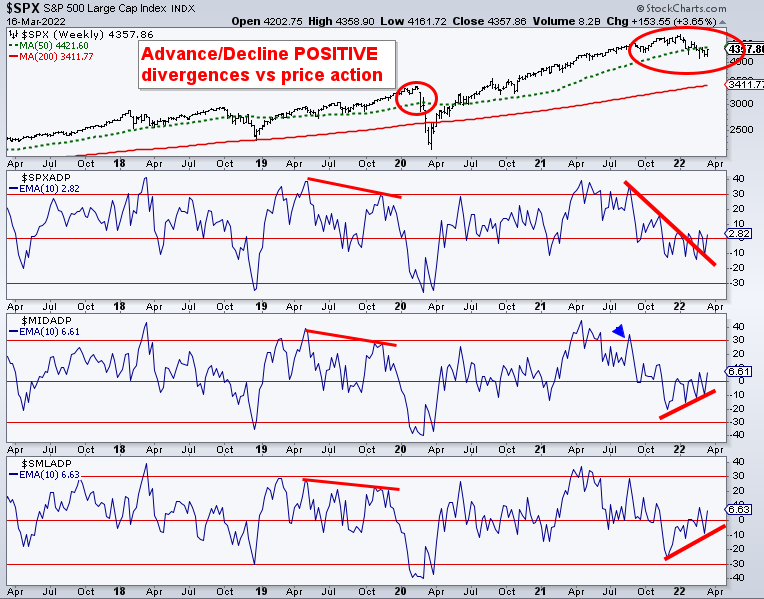
Daily and weekly Advance Decline data doesn’t look bearish at all
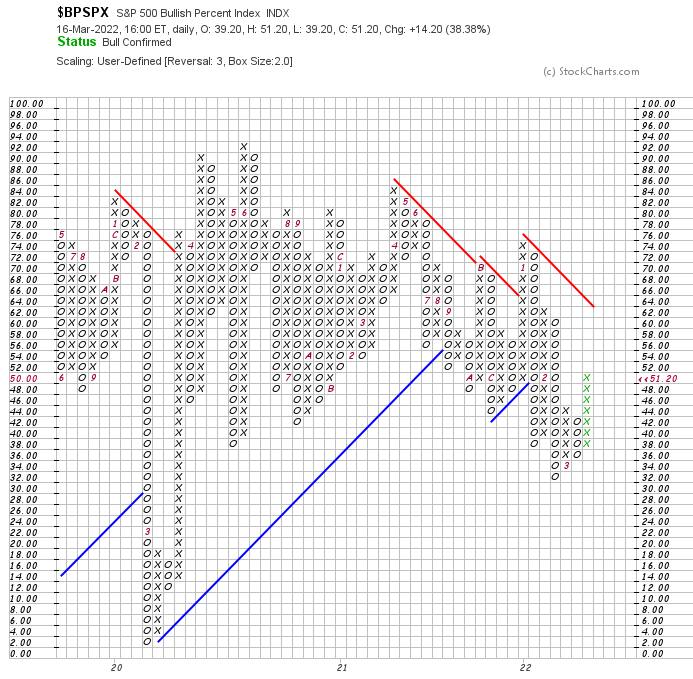
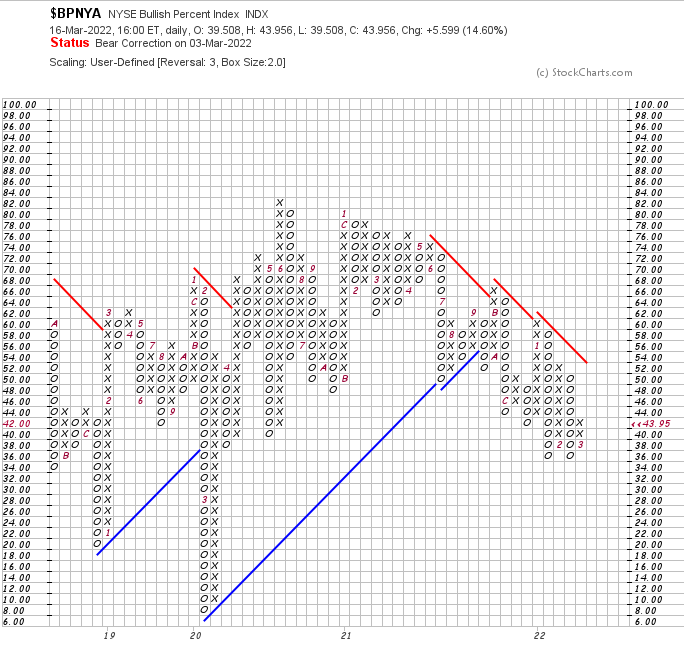
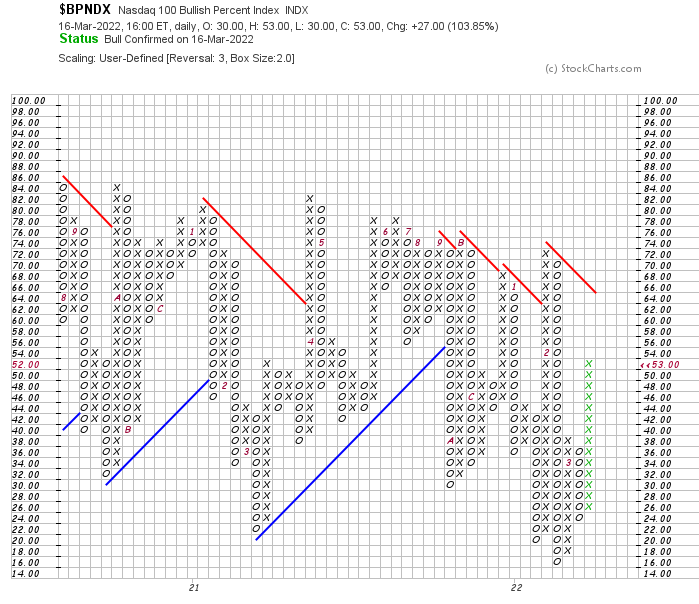
Bullish percent indexes update
Here’s a primer on point and figure bullish percent indexes.
All of these have now reversed into a column of X’s. In short: Bullish
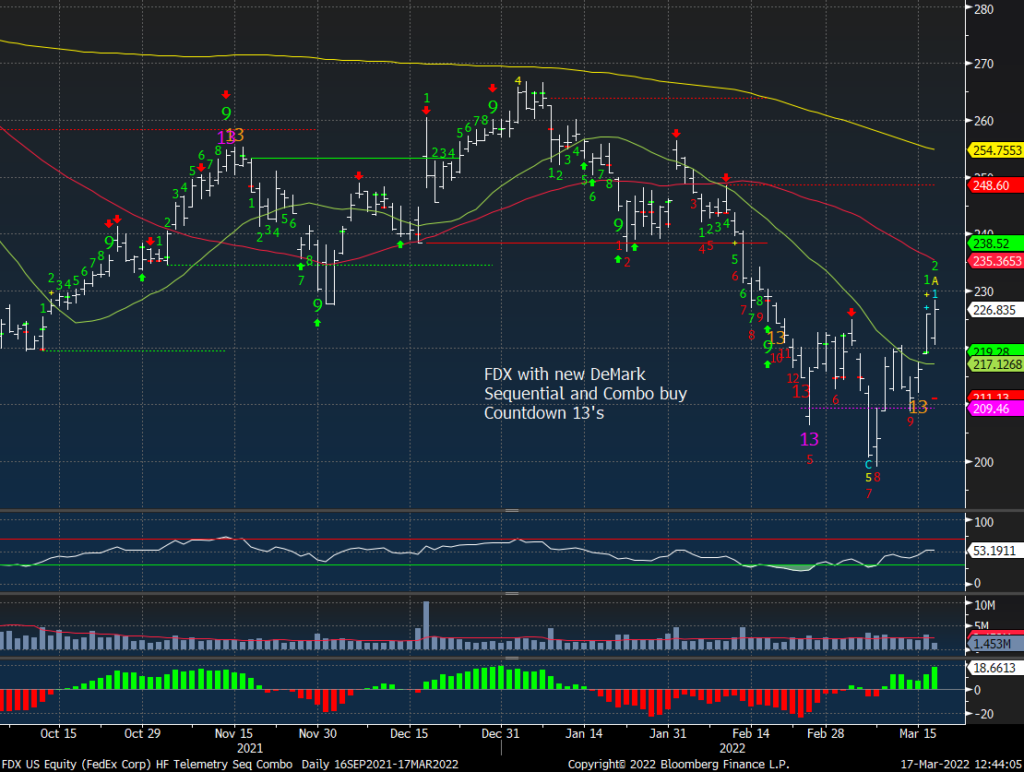
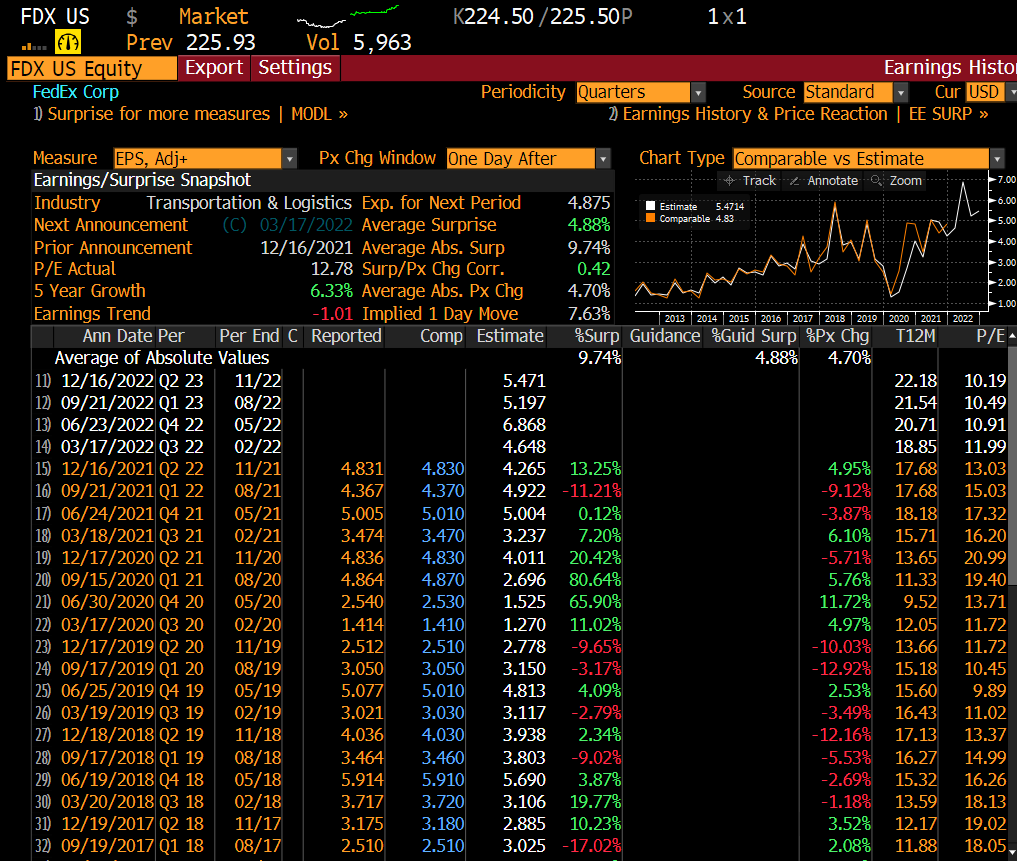
Fedex reports tonight
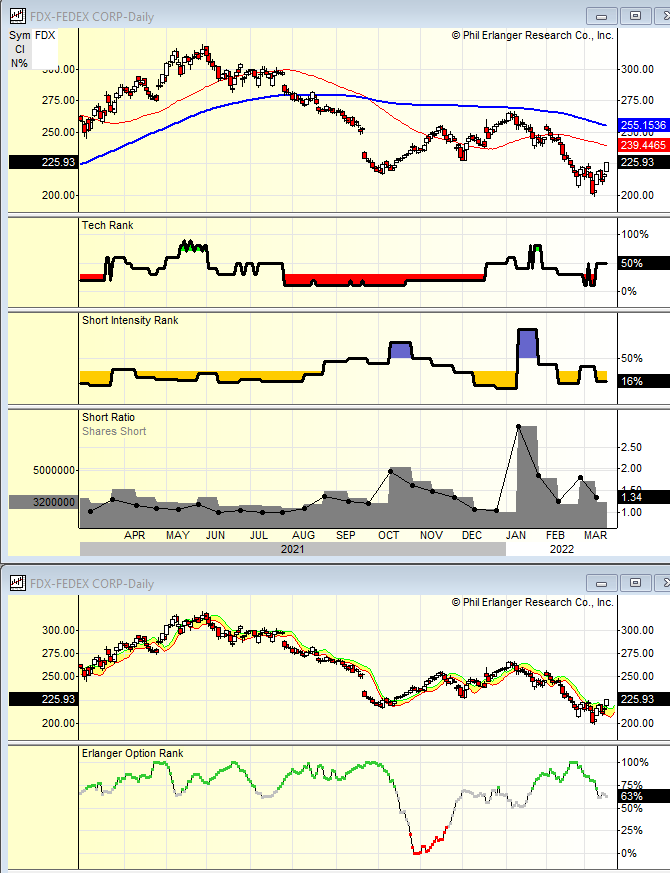
I am long FDX and have a nice little gain and will hold through the report tonight. I don’t have big conviction here however I’m giving that the benefit of the doubt and holding. The implied move is 7.63% and slightly concerning is short interest is low while the heavy put buying seen recently has moderated.
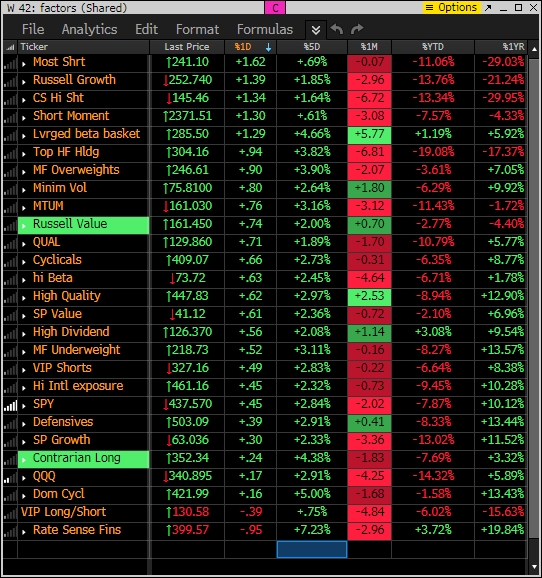
FACTORS, GOLDMAN SACHS SHORT BASKETS AND PPO MONITOR UPDATE
Factor monitor now has a reset YTD performance column. Factor monitor now has a reset YTD performance column. Nearly everything is down YTD yet everything is up in the last 5 day rolling period with shorts getting squeezed up the most today.
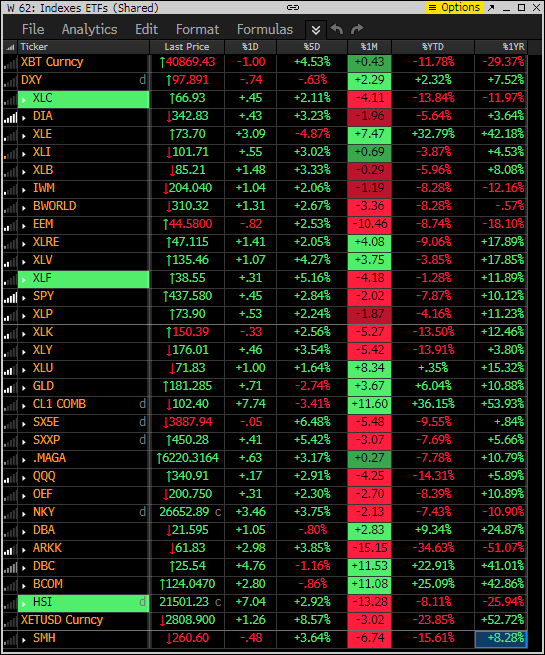
This is similar to the above monitor with various ETFs other indexes as I wanted to show the same 5 day, 1 month rolling as well the YTD and 1 year. Mixed 5 day and 1 month rolling however mixed is a good sign since it was all red for most of the year.
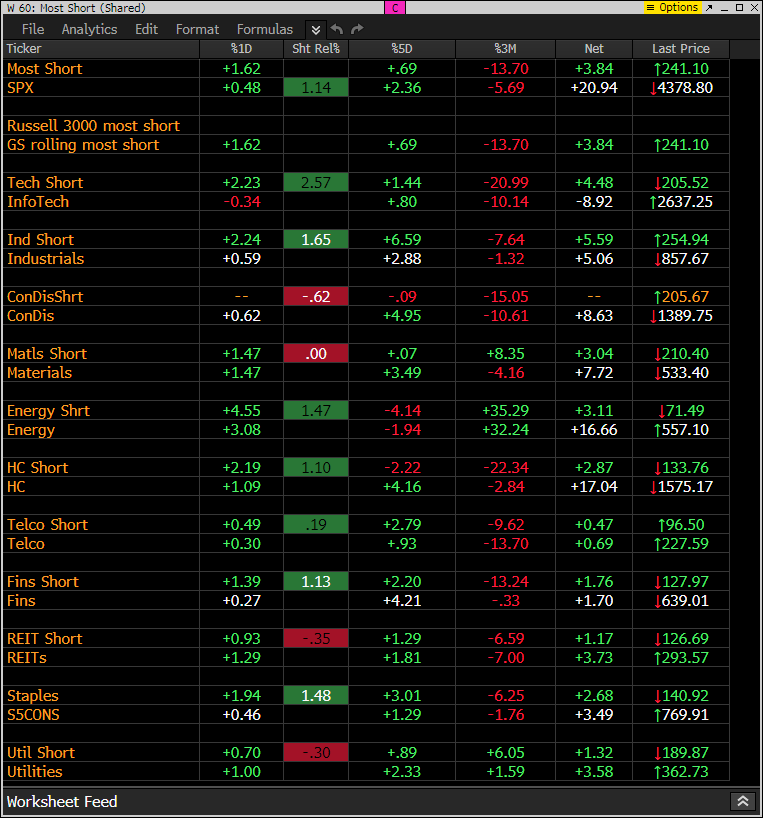
This is the monitor that has the S&P indexes and the Goldman Sachs most shorted baskets. Today the shorts are getting squeezed moderately vs the S&P indexes. This tells me buyers remain higher
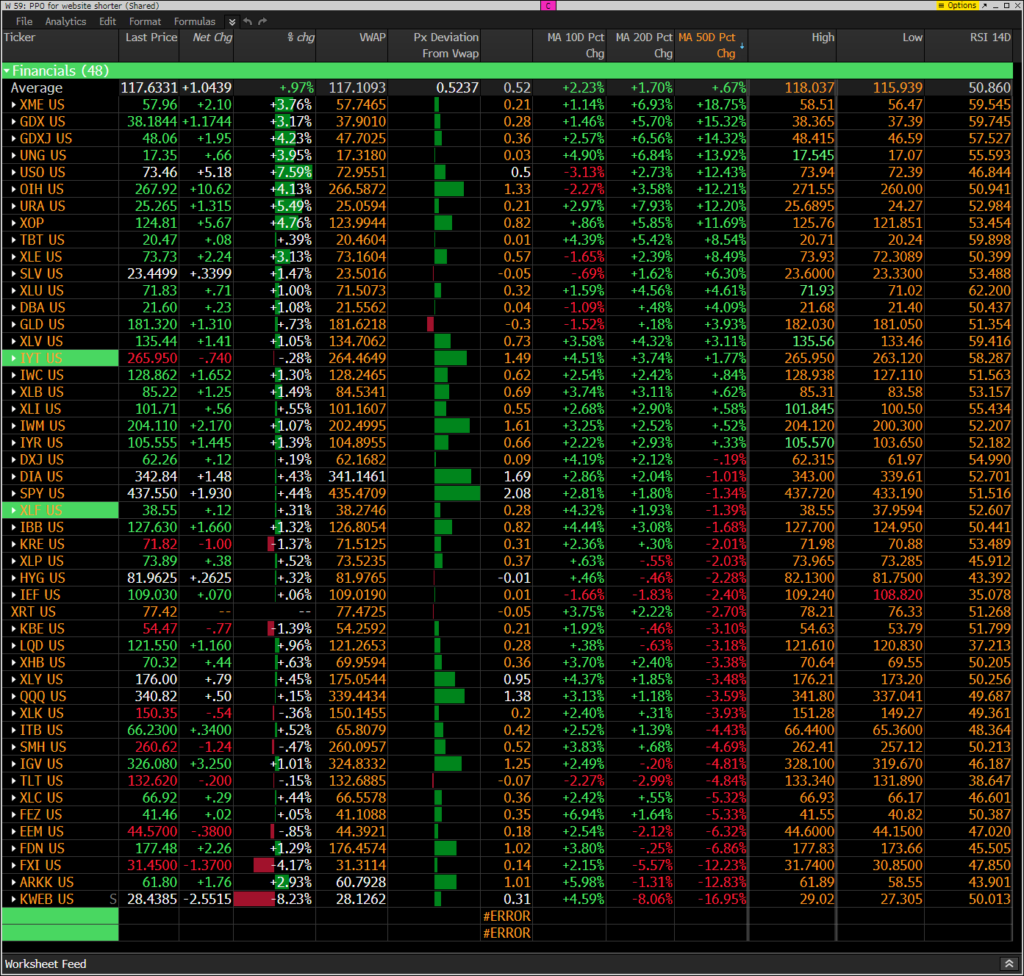
The PPO monitor (percentage price oscillator) force ranks ETF’s by percentage above/below the 50 day moving average. For information on this monitor please refer to this primer. This monitor is offered to Hedge Fund Telemetry subscribers who are on Bloomberg. Metals, energy which have been on the top (most above the 50 day) are bouncing back today. Stuff that has been very weak on the lower half is now showing some rotation up lifting above the 10 day and 20 day moving averages.
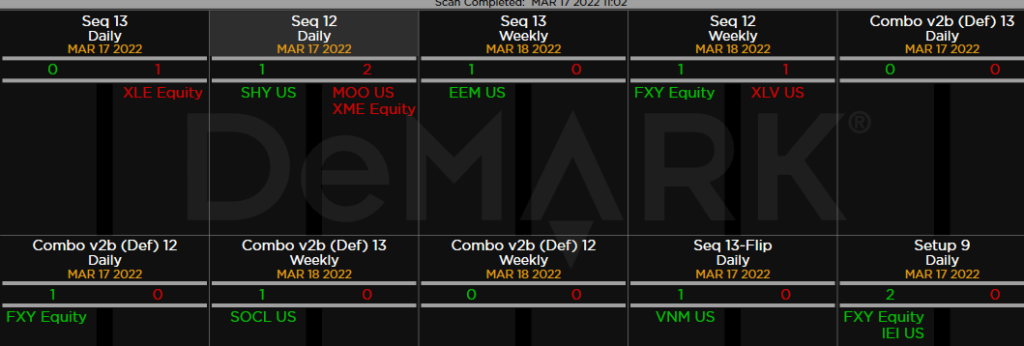
DEMARK OBSERVATIONS
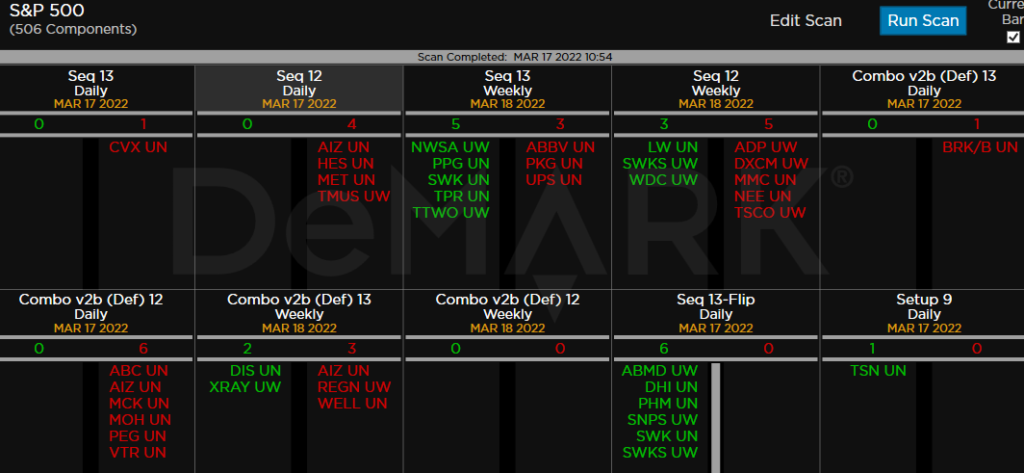
Within the S&P the DeMark Sequential and Combo Countdown 13’s and 12/13’s on daily and weekly time periods. For information on how to use the DeMark Observations please refer to this primer. Worth noting: A little quiet today. I’m long DHI with a price flip up today.
Here are some stocks I’m buying today with at a 2% weight to start.
ETFs among a 160+ ETF universe. XLE with a new DeMark Sequential sell Countdown 13. I’m adding it as a short again with a 3% sized short position.