
This will be the last note of the day unless something occurs. I added a lot more to this note. It’s summer trading and if you can go to the beach, you should.
Quick Market Views
Stocks: After starting the day moderately lower, the equity markets are attempting a bounce. Volumes are very low, so it’s not hard to lift as sellers have been absent in August. Breadth is mixed with the NYSE breadth up +250 and Nasdaq breadth down -300. Energy and materials are the big winners today. Tech is mixed with semis up over 1%. Banks are weaker today (I recently added to bank shorts) Most of the meme and garbage stocks are giving back gains after the pied piper of meme stocks filed to sell his BBBY stock after the recent gamma squeeze. He also is selling his way out of the money call options he used to squeeze the stock higher. I guess that’s legal now. Retailers are mostly down after KSS reported terrible earnings as inventories for women’s appeal remain extremely high.
I am still watching as support the VWAP levels from the CPI print on 8/10. SPY: 425.75 QQQ: 328.32.
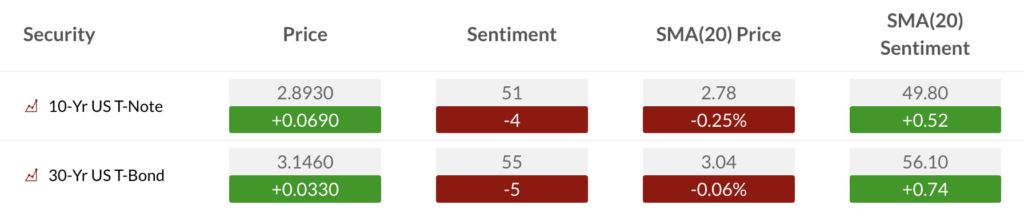
Bonds: Rates remain elevated, although they have a moderate bid today. I have an update on credit spreads below.
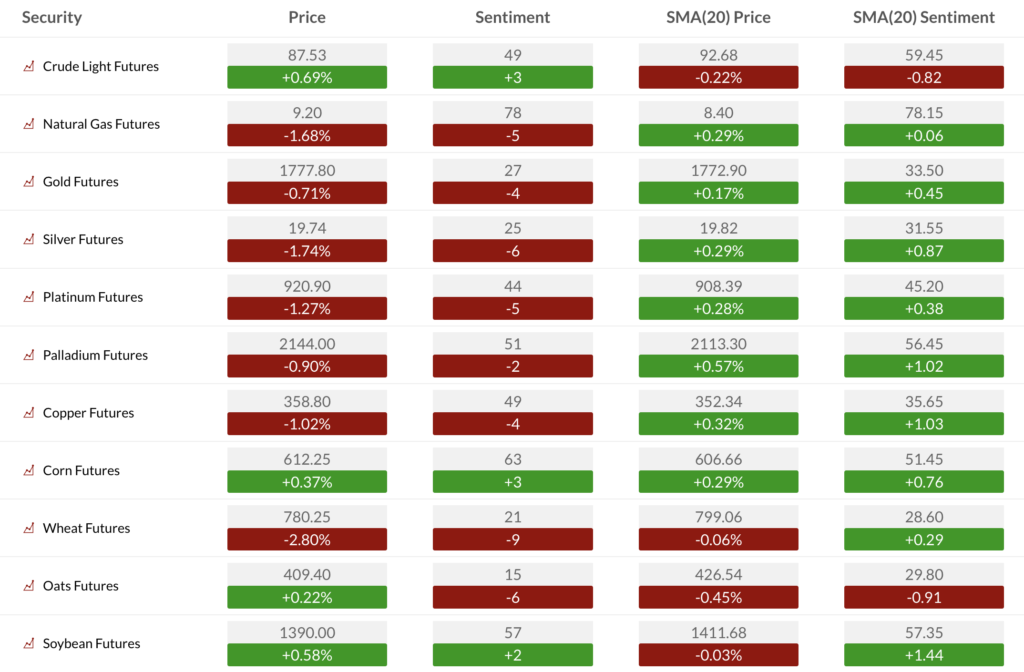
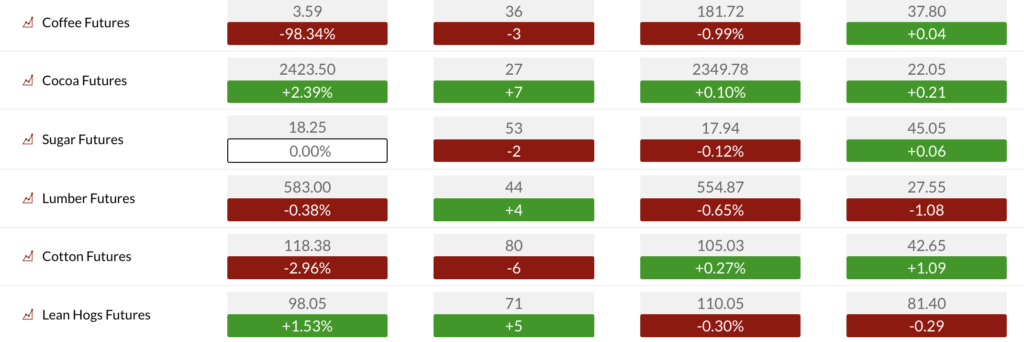
Commodities: Energy is stronger, as is copper. Grains are lower, with wheat down 1.8%. Wheat has been basing however, with the lack of positive response, I am back on the sidelines, as mentioned on First Call. I have charts of GLD and GDX below.
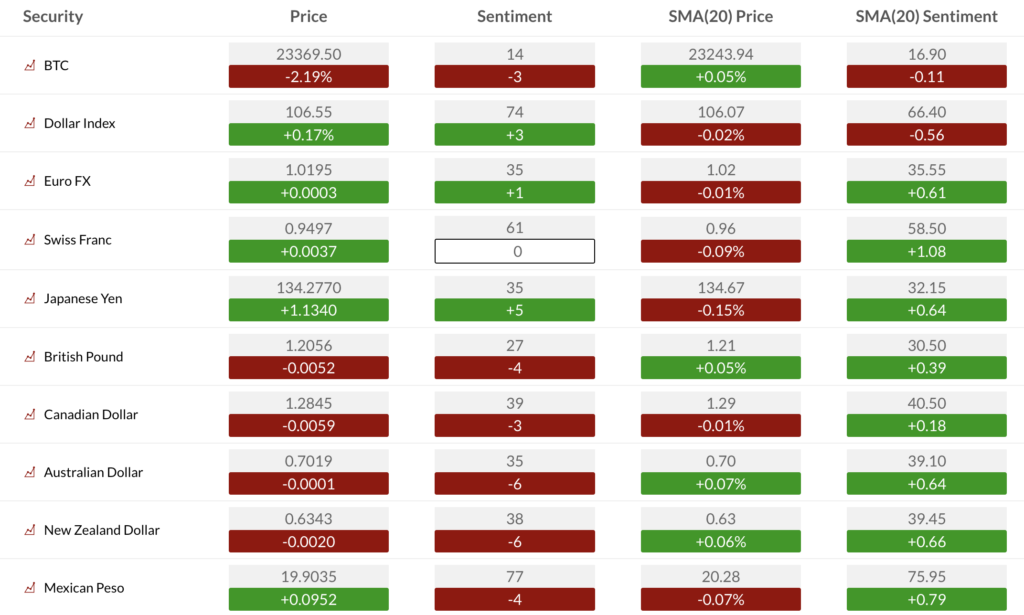
Currencies: The US Dollar Index continues to rise and is now over 107, reemerging higher.
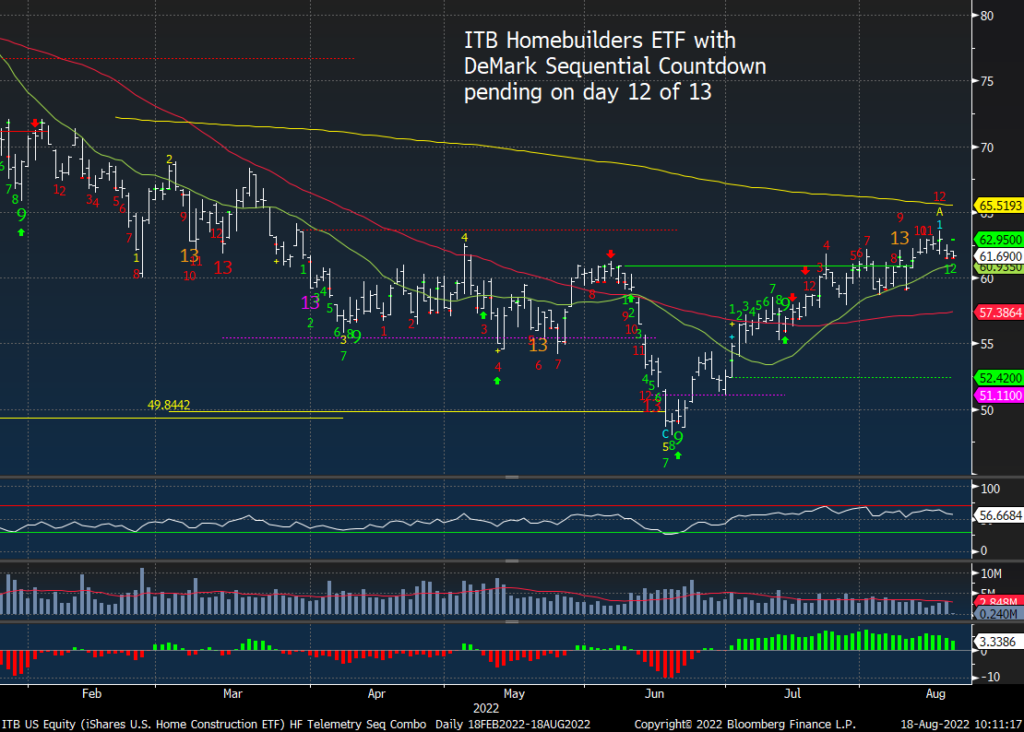
Trade Ideas Sheet: I am adding a new 2% sized short position with ITB Housing ETF.
Tomorrow we will host a webinar to review the current markets and answer any questions and chart requests. Here is the link to register. We will have both First Call and the Mid Morning notes and no later note. And I’ll be on Real Vision’s Daily Briefing later today at the close. And here is a replay of the Rekor shareholder meeting. We did not record our recent webinar.
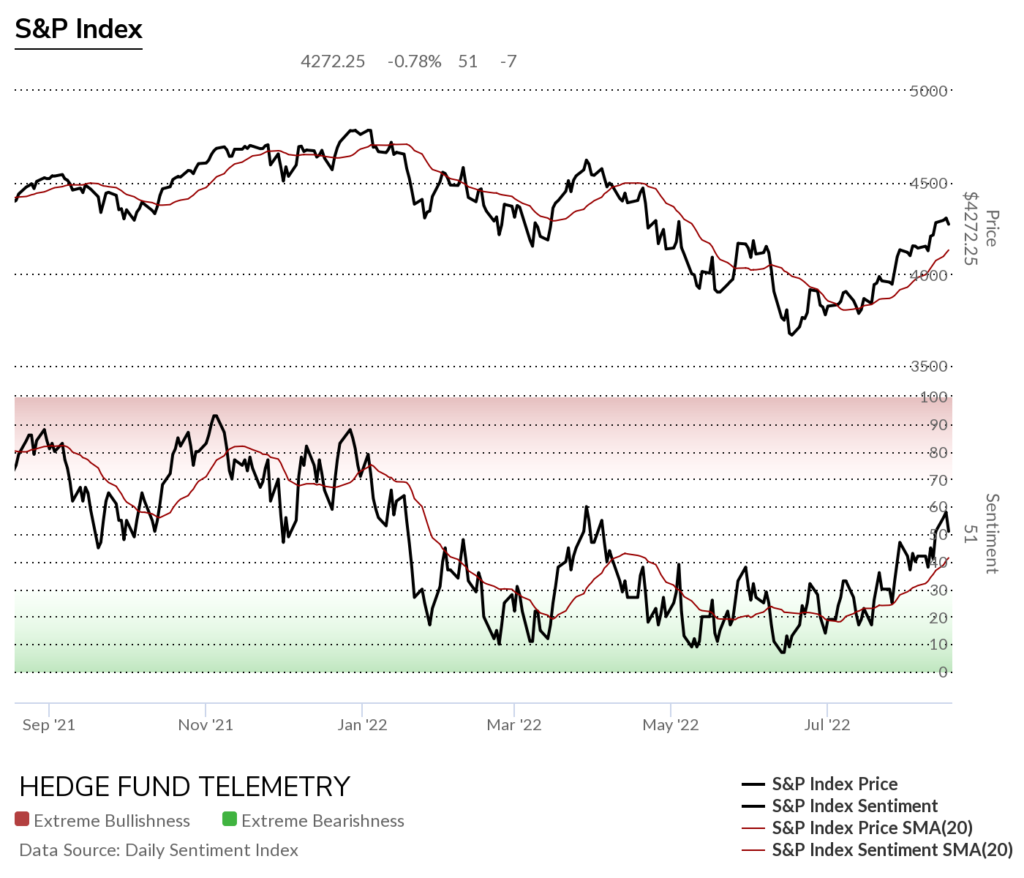
US Market Indexes and Sentiment
Here is a primer on how we use Daily Sentiment Index charts. Lower on this note is bond, currency, and commodity sentiment.
S&P bullish sentiment and Nasdaq bullish sentiment backed off of recent gains. Now I’m watching the 20 day moving average of bullish sentiment as the first support.
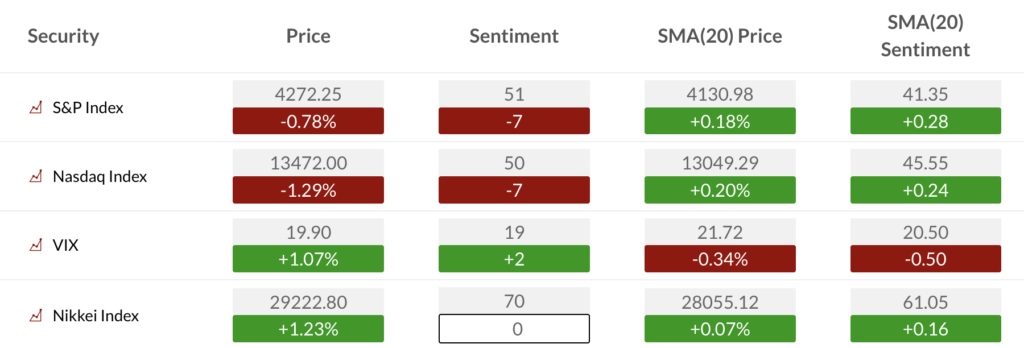
S&P bullish sentiment stopped going up right at the March peak
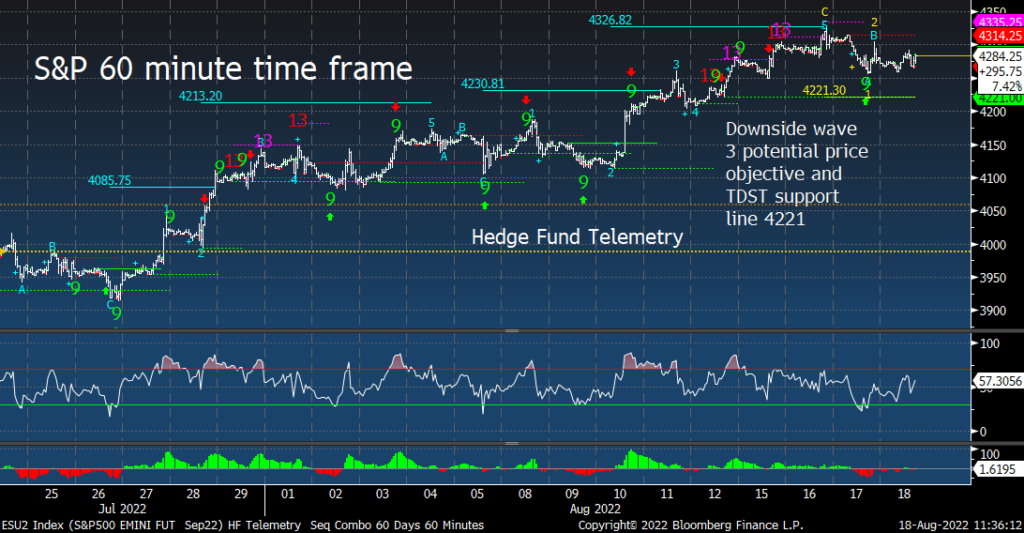
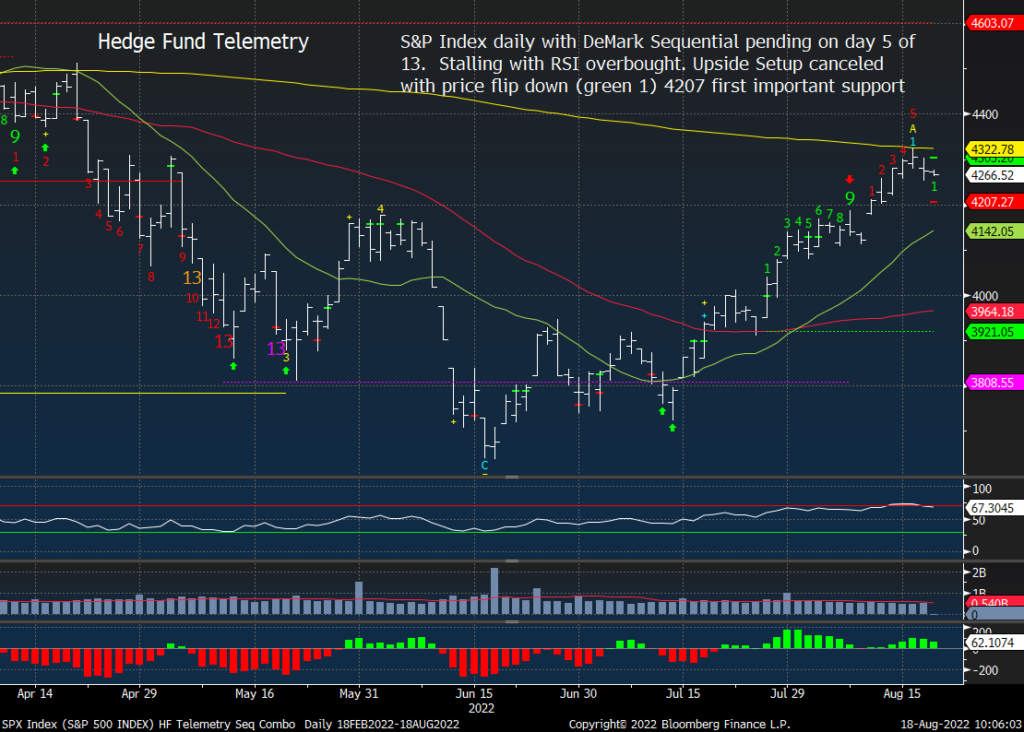
Here is a primer on the DeMark Setup and Sequential indicators.
S&P futures 60-minute time frame mostly sideways today
S&P 500 Index daily
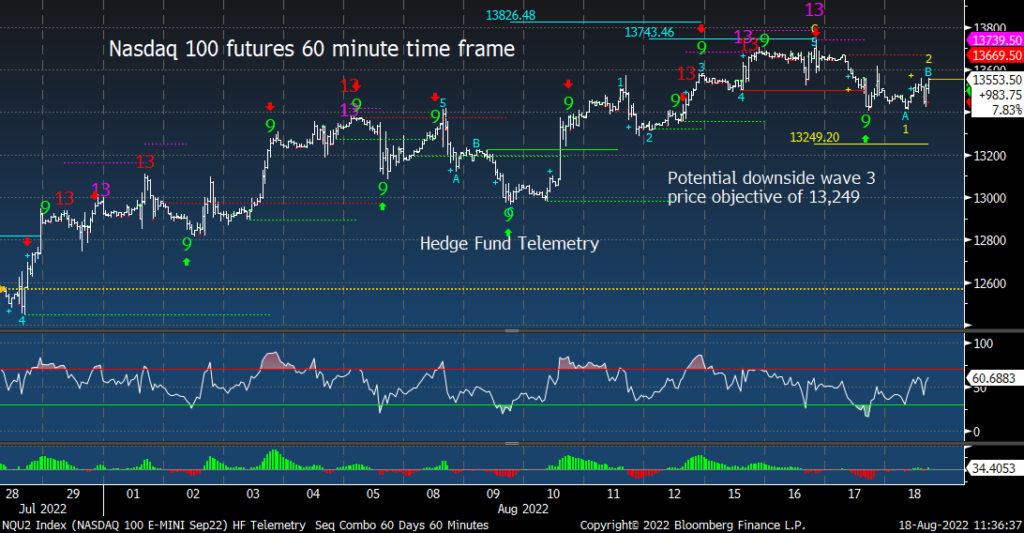
Nasdaq 100 futures 60-minute time frame in corrective lower high wave 2 of 5 bounce
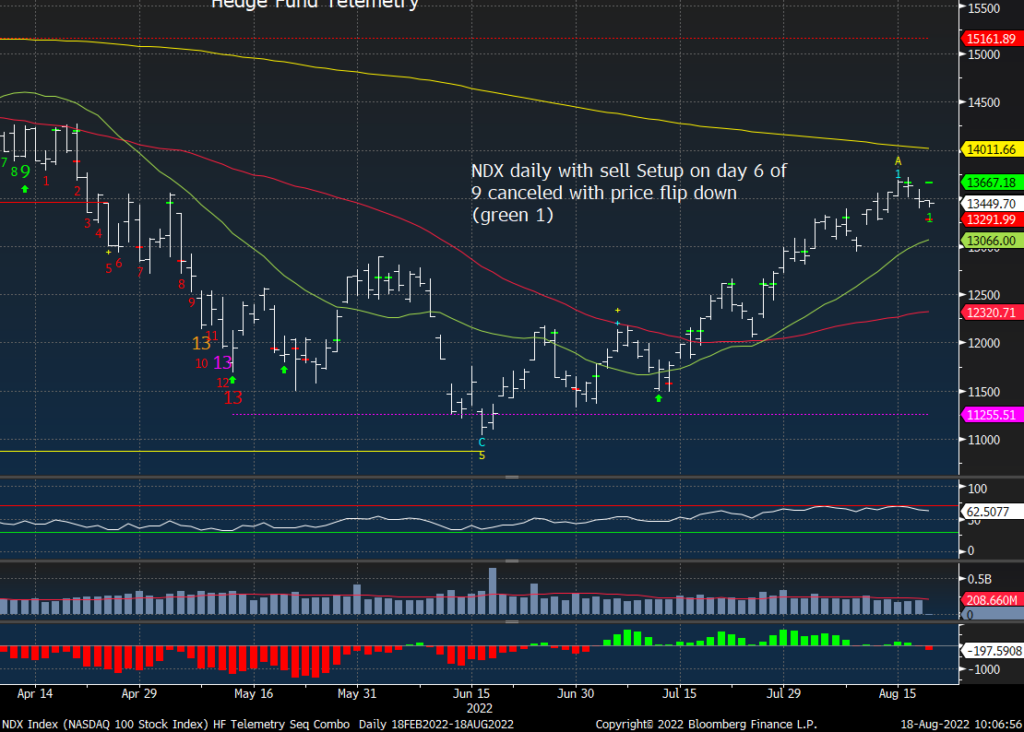
Nasdaq 100 Index daily
Trade ideas
ITB Homebuilders ETF has had a nice run off the June lows. Housing data continues to weaken with lower housing numbers for six straight months. Even if I don’t have the 13 I am adding the short position. I can and might add more weight either higher or lower.
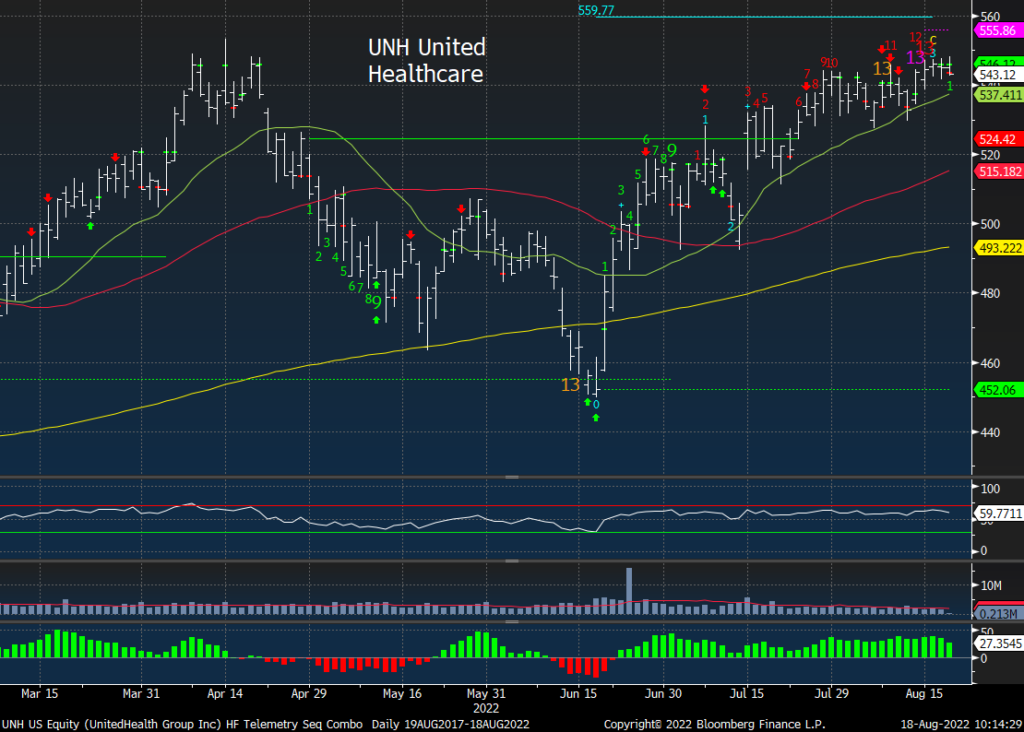
UNH as shown the other day with the Sequential and Combo sell Countdown 13’s now has a price flip down. This is the largest weight in the Dow, and I would suggest if you wanted to short, let the 20-day break first.
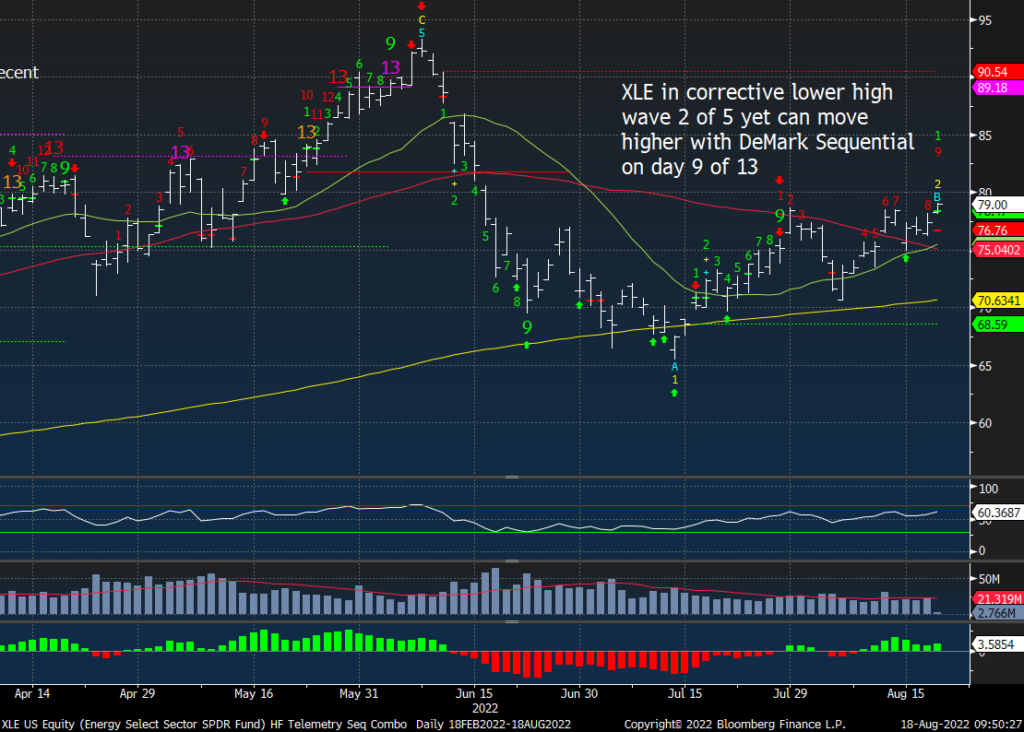
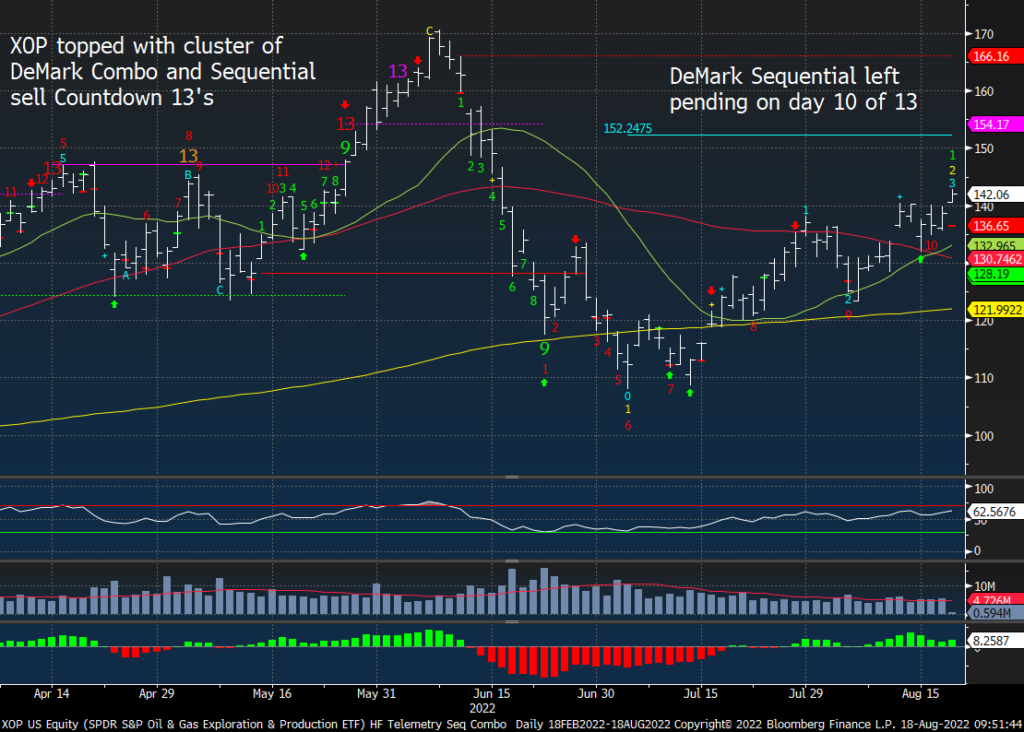
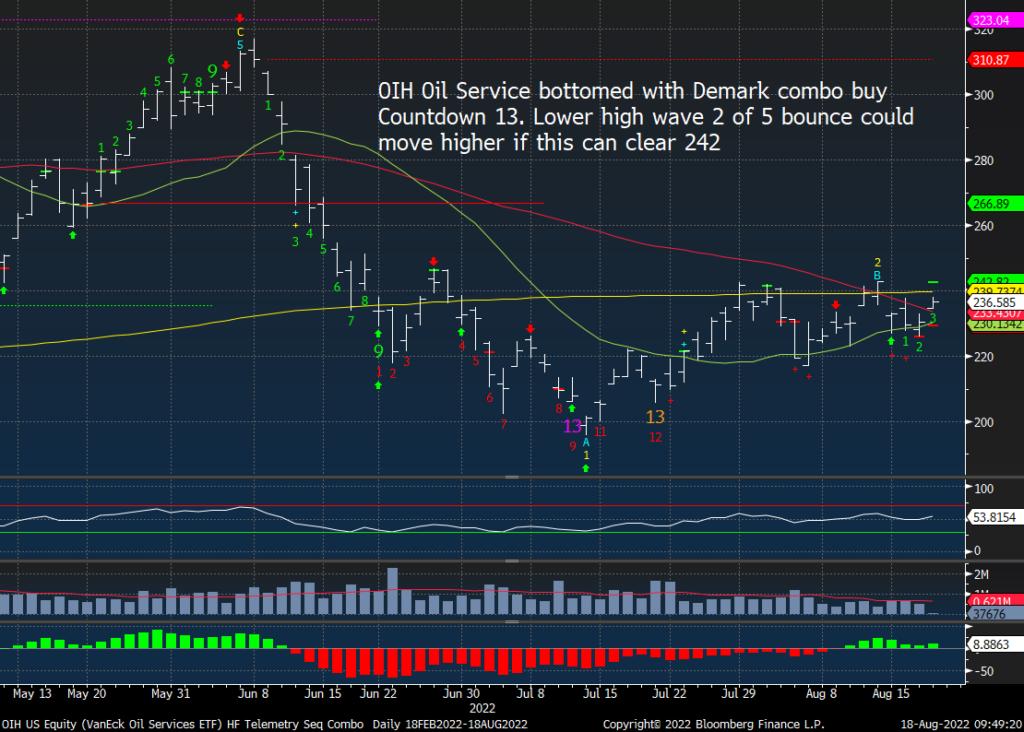
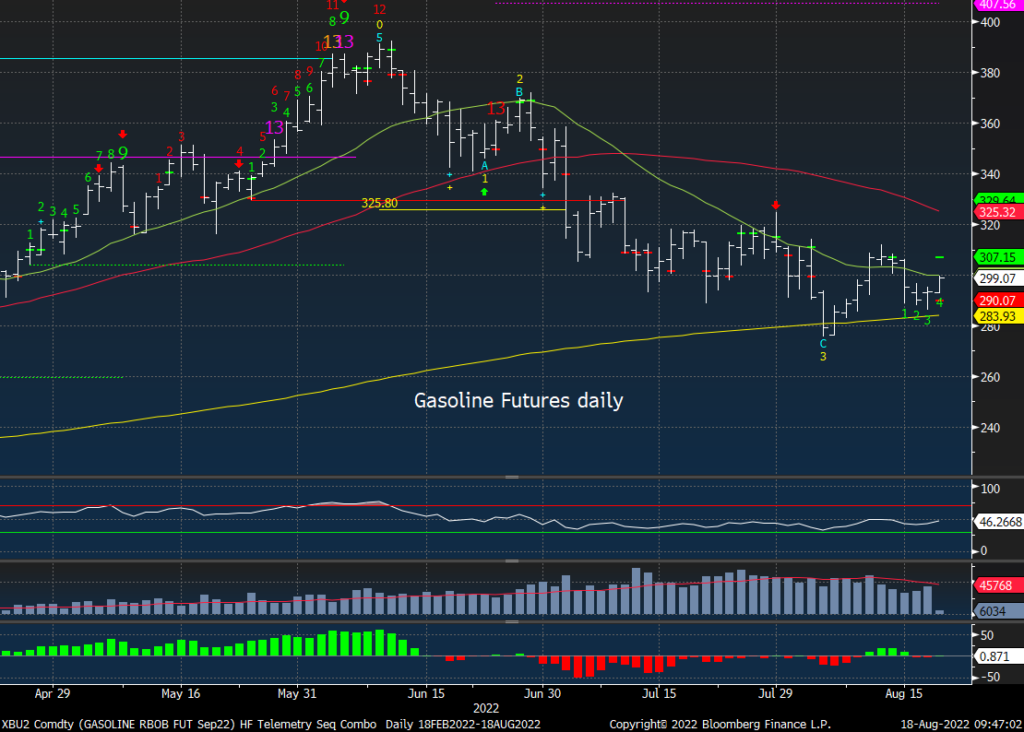
Focus charts – Energy
XLE has a cleaner chart vs. the other energy ETFs and individual stocks. I added 8% total weight with APA and HAL long ideas that are working out well. My conundrum is that this bounce could be a lower high wave 2 of 5.
XOP has a pending Sequential on the downside despite the rise. The price pattern looks decent
OIH Oil Service has some resistance above
Gasoline futures daily is trying to base; if this turns higher, the CPI won’t drop as much as some people want to see.
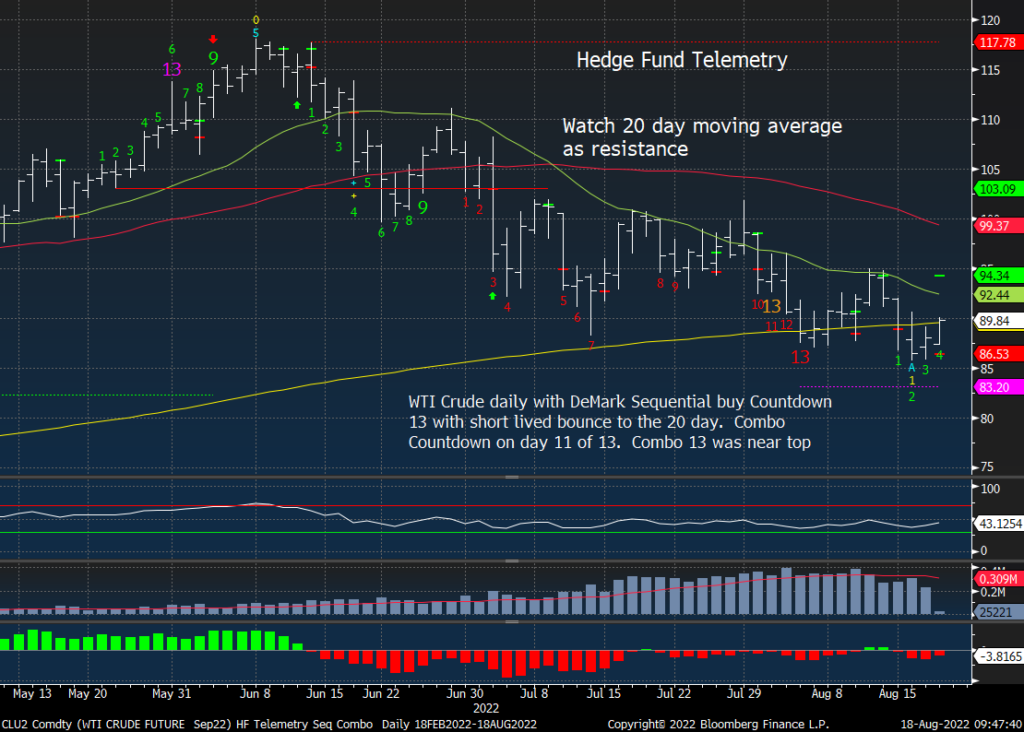
WTI Crude daily dipped a little further than I expected however it’s trying to lift again
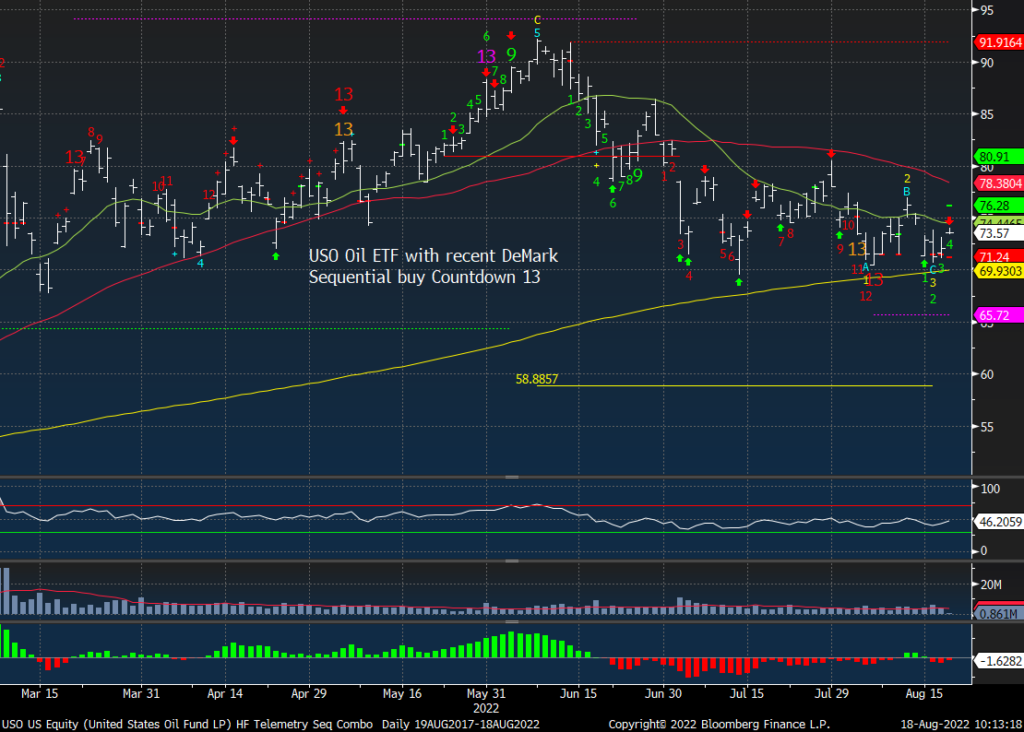
USO Crude ETF same story
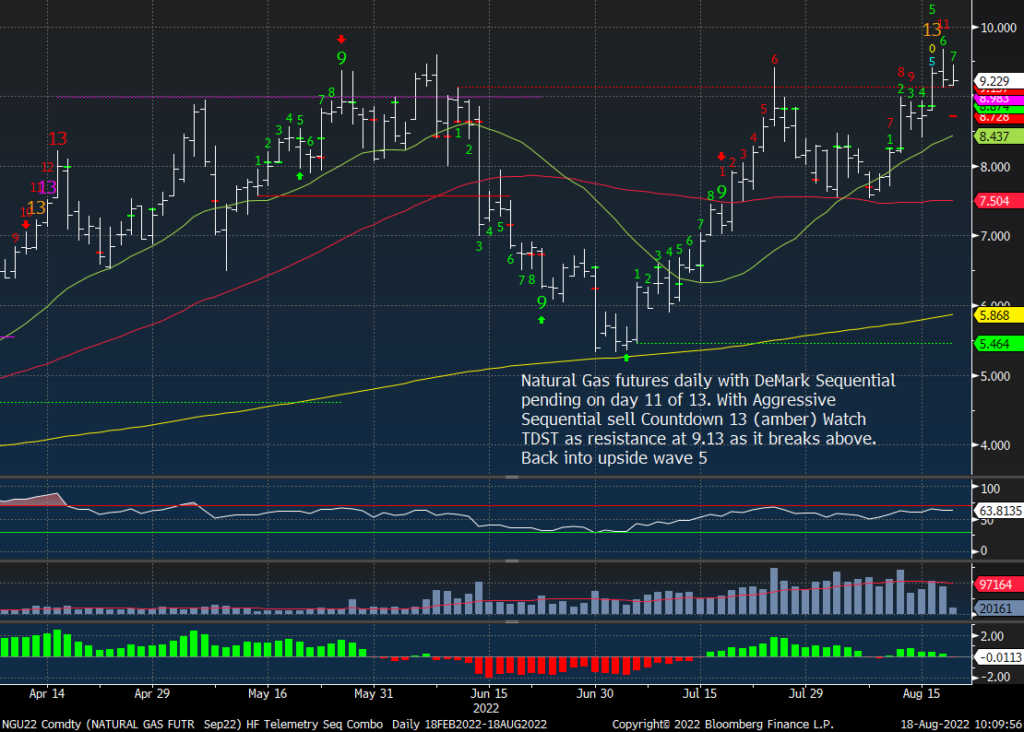
Natural Gas futures daily still has potential on the upside $10 would get a lot of notice and considering there is a large COT short positioning it could get crazy.
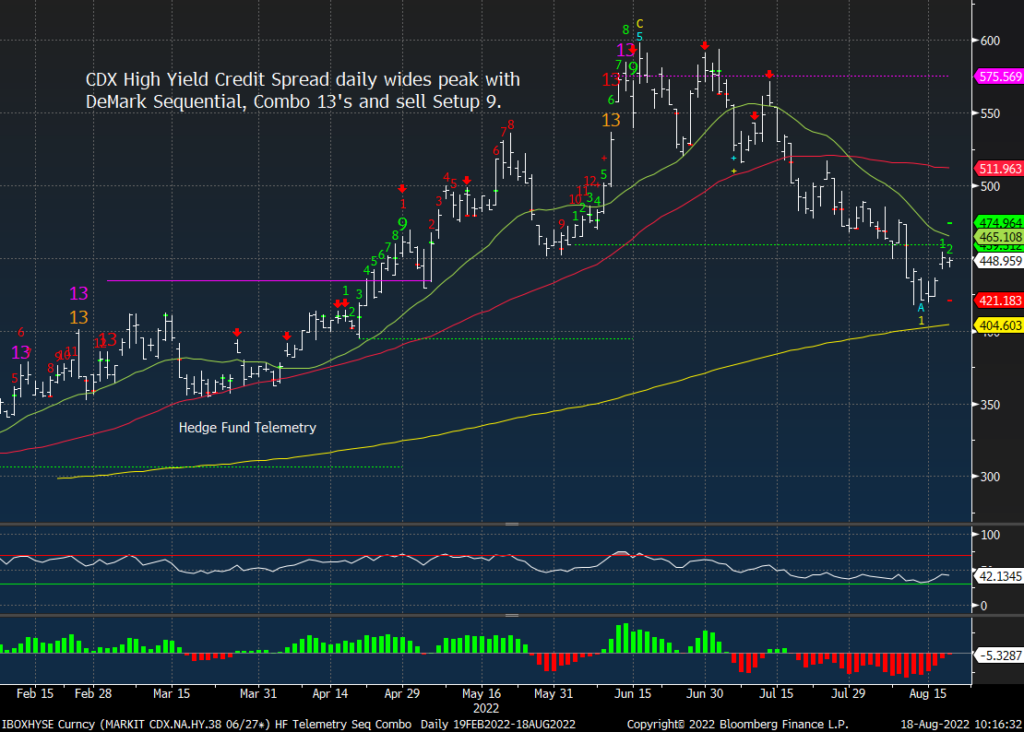
Credit Spreads trying to turn
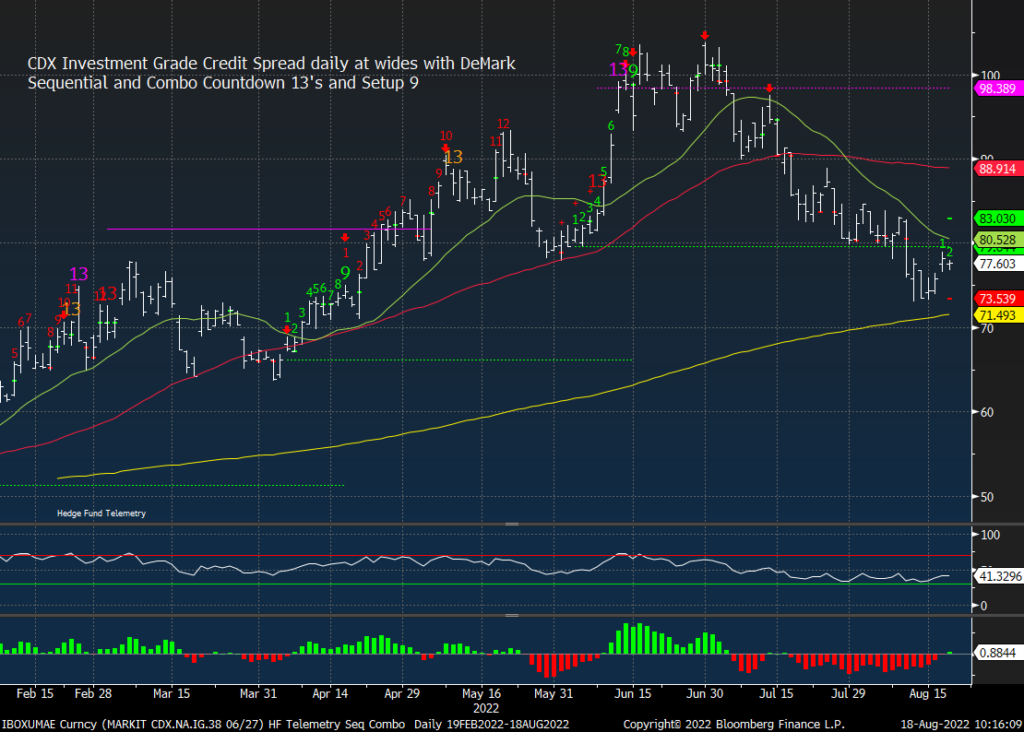
CDX Investment Grade Credit Spread daily trying to turn and that is more of a risk off indication
CDX High Yield Credit Spread Daily same story
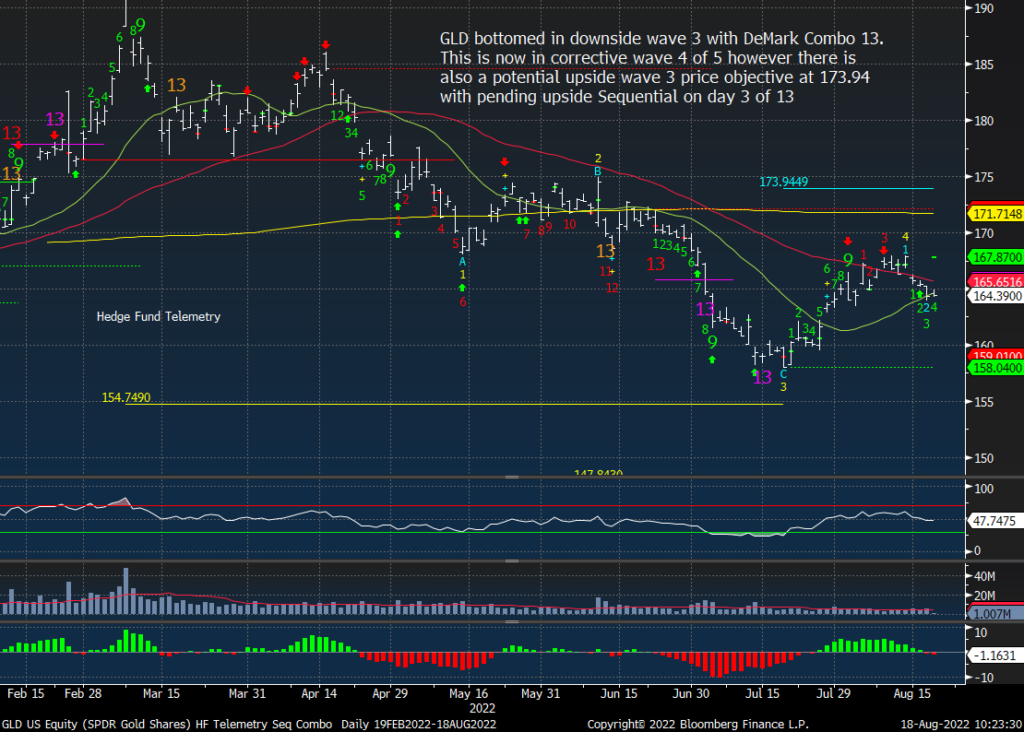
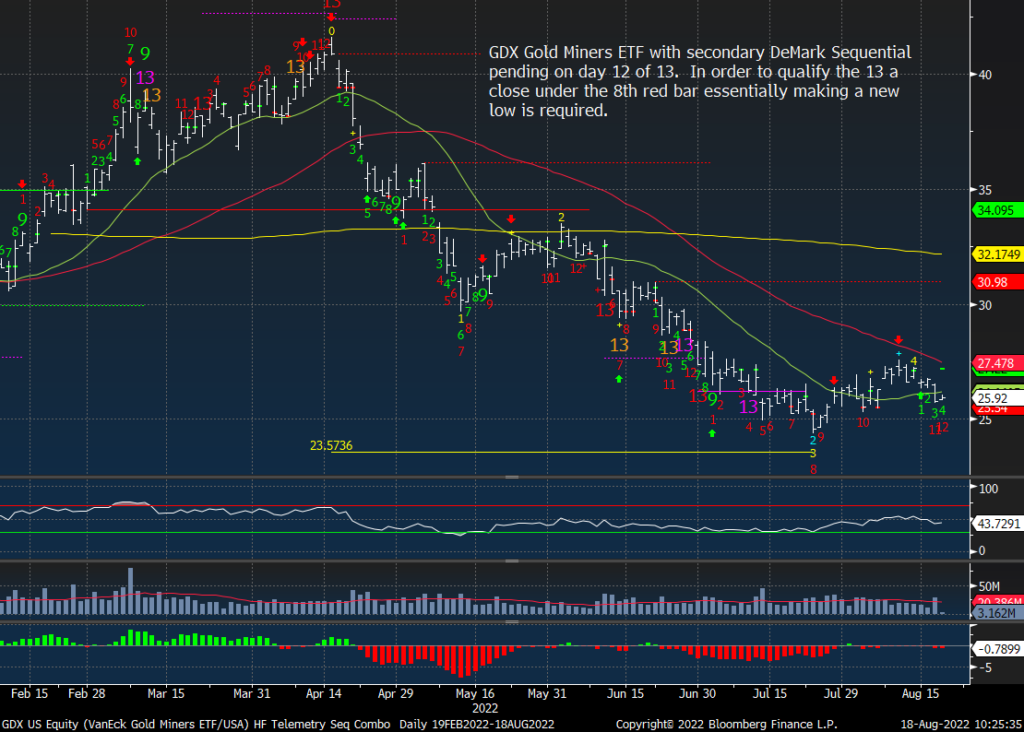
Gold and gold miners
GLD has these fleeting moments where everyone thinks it’s “go time” just to fade. There are dueling downside and upside wave patterns that will be resolved by breaking either the recent low or high.
GDX remains a difficult long
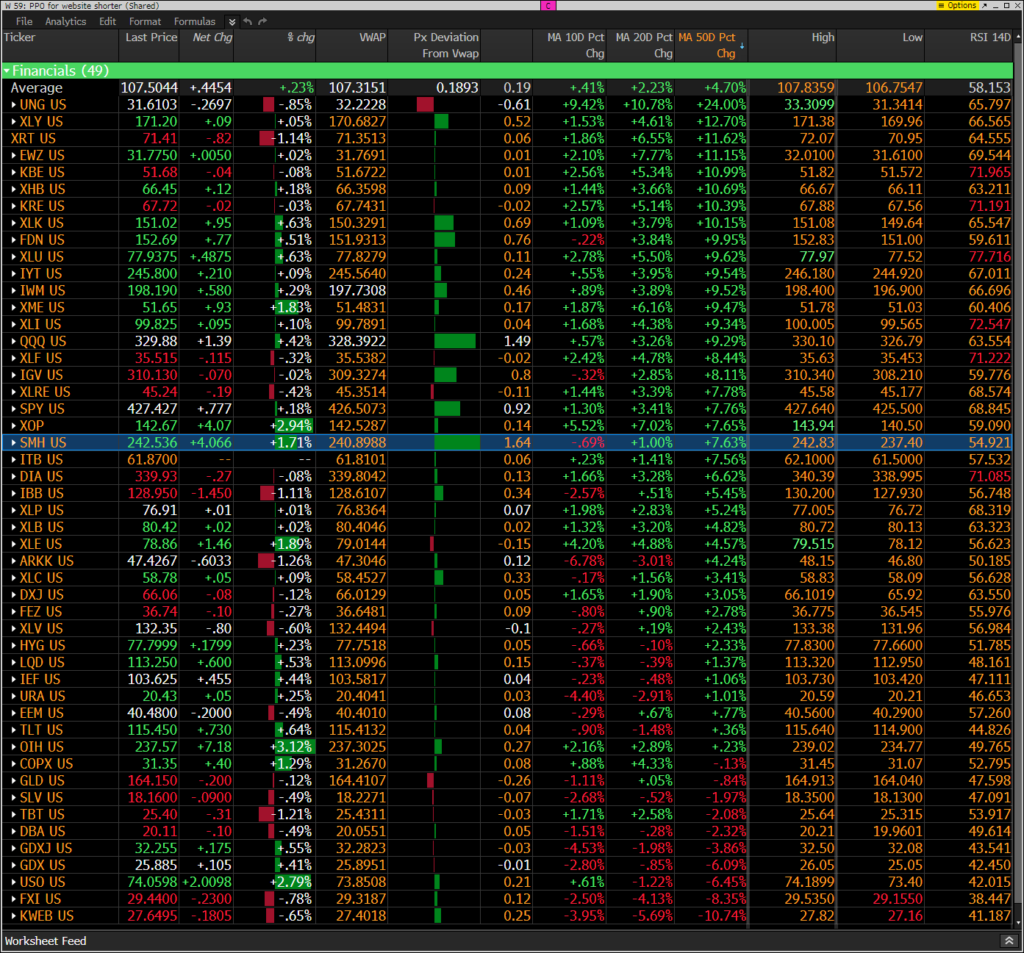
Hedge Fund Telemetry ETF Percentage Price Oscillator Monitor
The PPO monitor (percentage price oscillator) force ranks ETFs by percentage above/below the 50-day moving average. For information on this monitor please refer to this primer. This monitor is offered to Hedge Fund Telemetry subscribers who are on Bloomberg. It’s a choppy market with energy and tech leading
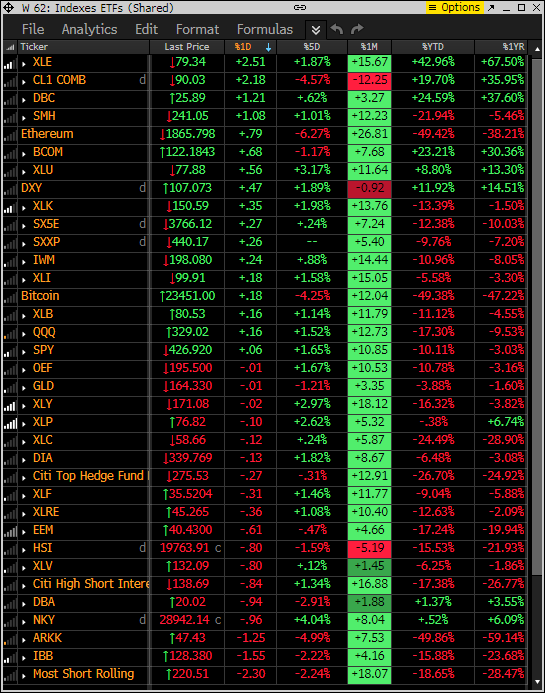
Index ETF and select factor performance
This ranks today’s performance with 5-day, 1-month, and 1-year rolling performance YTD. Energy leading with ARKK, Biotech and most shorted near the lows
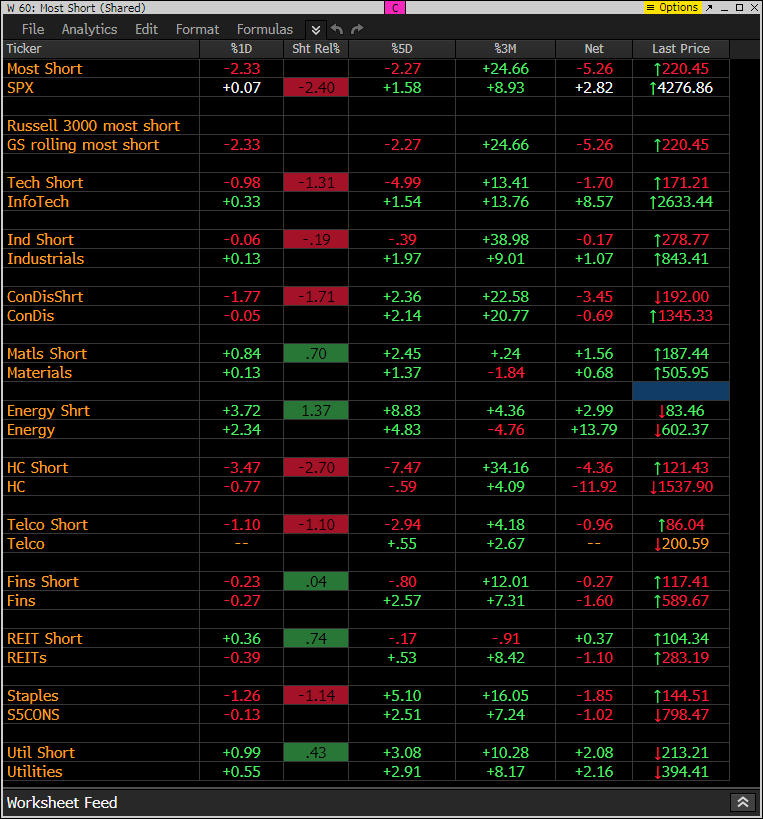
Goldman Sachs Most Shorted baskets vs S&P Indexes
This monitor has the S&P indexes and the Goldman Sachs most shorted baskets. Today the shorts are are doing OK overall ex-energy, utilities and materials are getting squeezed
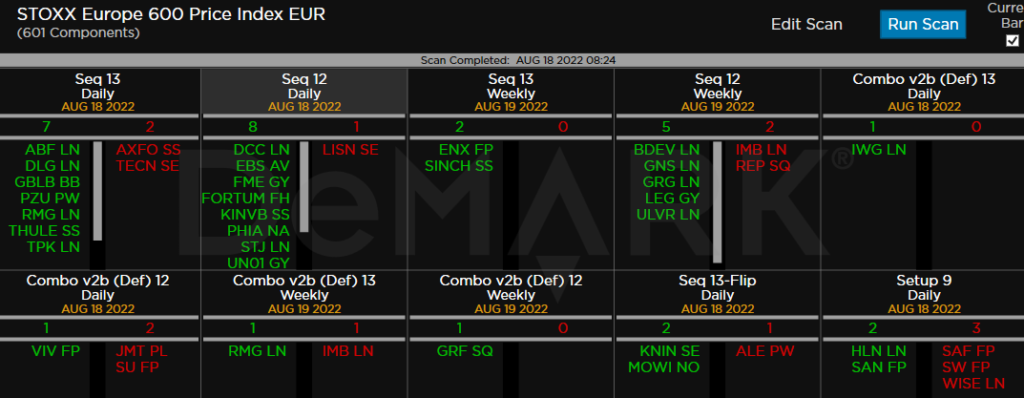
DeMark Observations
Within the S&P the DeMark Sequential and Combo Countdown 13’s and 12/13’s on daily and weekly time periods. For information on how to use the DeMark Observations please refer to this primer. The extra letters at the end of the symbols are just a Bloomberg thing. Worth noting: Still seeing a lot of sell Countdown 13’s and on deck 12’s. Some utilities are notable. There are some buy Countdown 12’s on deck however many of these to qualify need to trade much lower under the 8th red bar close.
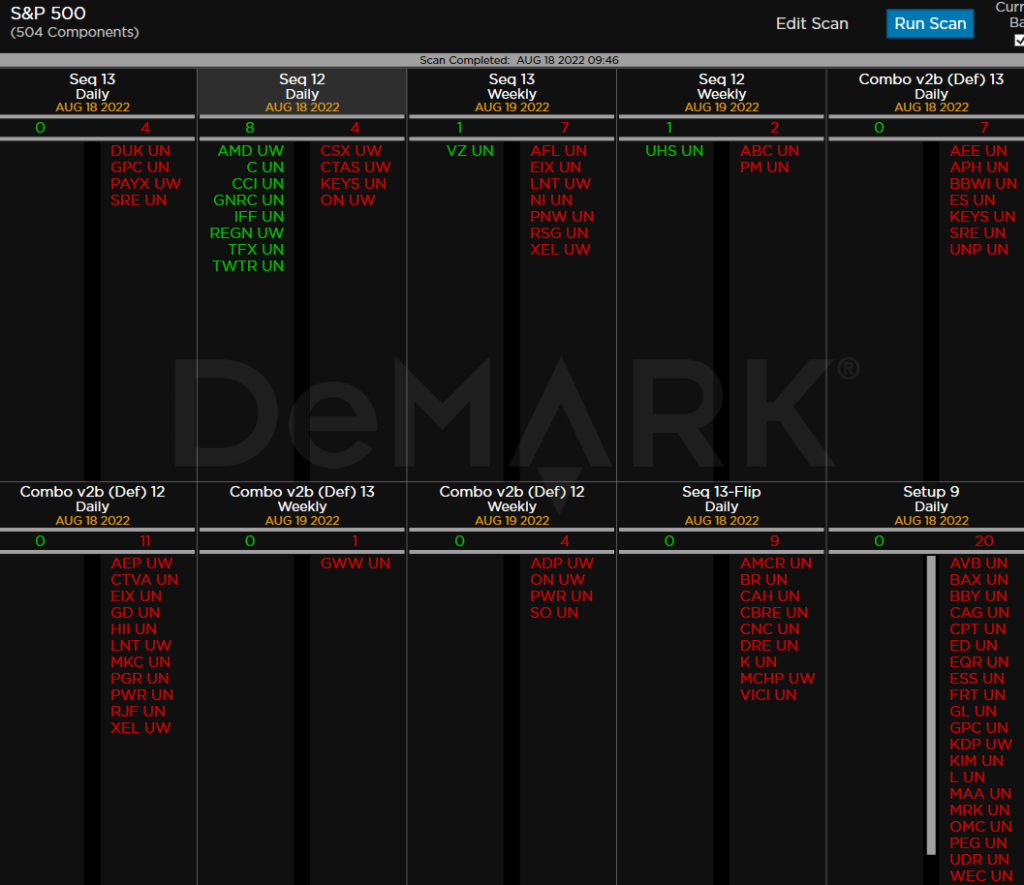
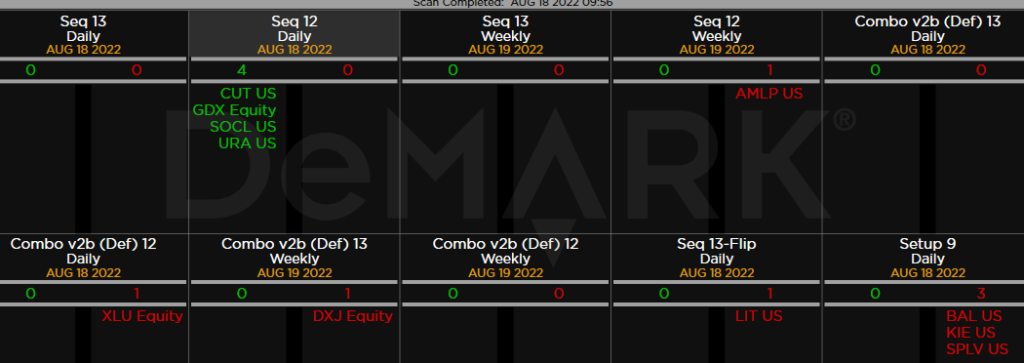
Major ETFs among a 160+ ETF universe. I’m watching a few of the 12’s
Euro Stoxx 600
Bond, Currency, and Commodity Bullish Sentiment
Bond bullish sentiment
Currency bullish sentiment
Commodity bullish sentiment
If you have any questions or comments please email us. Data sources: Bloomberg, DeMark Analytics, Goldman Sachs, Street Account, Vital Knowledge, Daily Sentiment Index, and Erlanger Research