The last few weeks haven’t been easy looking at the price action. I was early on shorting some ideas, not at the lows but after some of the moves. I was clipped on several retailers that I shorted and now are fading lower. The markets are imperfect, and even if you have the right idea, it can go against you even when you are correct on the thesis. This is a bear market and mistakes happen.
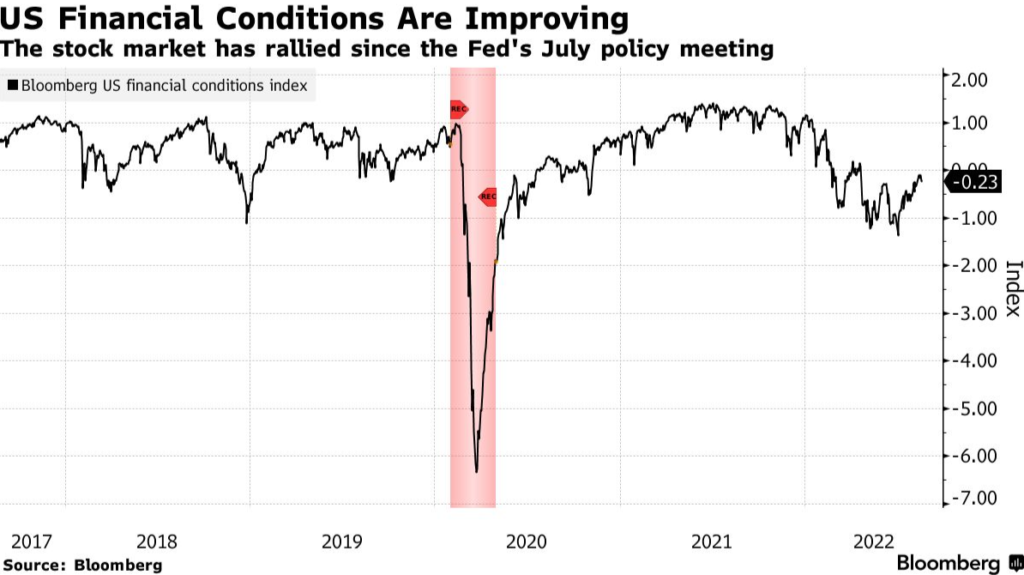
Besides the price action, it was becoming clear to me what was happening that kept my positioning setup very bearish. First, the move off the lows in June came after fund manager positioning showed very low exposures. Funds found comfort after some big banks reported “better than feared earnings,” which became a theme throughout the Q2 earnings season. Second, in early June, when the markets gapped hard for three days straight, I reported how the prime broker data showed hedge funds shorted one of the largest amounts in recent memory that week. I heard from clients who are sell-side traders that many hedge funds that are not that good at shorting were actively trying to press the lows. Once we had the mega-caps report “better than feared” earnings, the hedge funds started to cover as we discussed on the last short interest webinar. As I highlighted, this year, the Bank of America fund managers survey also saw the biggest inflows into equities, specifically large-cap tech. At the Fed meeting press conference, Powell added false optimism when he said they are moving towards the neutral rate. The neutral rate is when the federal funds rate neither stimulates nor restrains economic growth. This was a mistake since the Fed hikes haven’t accomplished or even seen financial conditions tighten.
Then came the “better than expected” CPI inflation report. The markets gapped higher with the hope that inflation has peaked. It might have, but we shouldn’t get too excited since the sticky inflation – wages, rent/housing, and food hasn’t moved lower. The CPI should stay elevated for the next two quarters, and likely won’t get the Fed’s goal of 2%.
I prefer to be bullish as more people like bullish people. The problem right now is that many of the results of the Fed’s actions haven’t been felt. Since they overstimulated and were late to start hiking, there is a risk that the Fed will continue to raise rates, and the economy starts to slow while inflation remains elevated. New orders are slowing, inventories are high, and the consumer is adding more credit card debt. Add in the problems in Europe, specifically the energy crisis heading into winter it’s a precarious time. Citi put out a note today expecting 18% inflation in England soon. Inflation data in Europe has remained high, and the ECB just raised 25bps for the first time in a decade.
You’re saying, “Jeez, Tom, it’s just Monday.” Perhaps too bearish, or maybe I’m cautious as I have seen a lot of what is happening AND with a lot that I have not experienced in my career – notably extreme inflation.
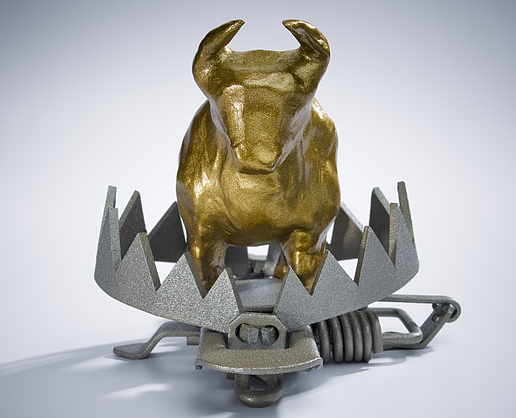
With the lack of shorts in the markets as they covered higher, and funds and investors chasing FOMO higher, many bulls are trapped. And the worst thing would be for Powell to try and soothe the markets, creating false hope of a soft landing. It’s never easy, but we’ll get through this period safely as we are and will be prepared for everything that comes next. That is my goal.
TRADE IDEAS
The short side of the Trade Ideas Sheet is now overall profitable again. It looked like a murder scene, but now it’s starting to work with a few more that still need to turn profitable. At this point, I don’t see enough evidence to cover. Just because someone says, “It could be Turn Around Tuesday tomorrow,” isn’t enough to shake me out of shorts. It’s tricky to try and short today after two gap-down days. Let’s watch the next bounce to determine the strength and resolve. This is a seasonally weak period that is just starting now. If you have some shorts with gains, I won’t argue if you want to take some profits – either all or partial. Remember, I have my own process, time frame, and risk tolerance. Trade with your own and let my process be part of yours.
US MARKETS
Here is a primer on the DeMark Setup and Sequential indicators.
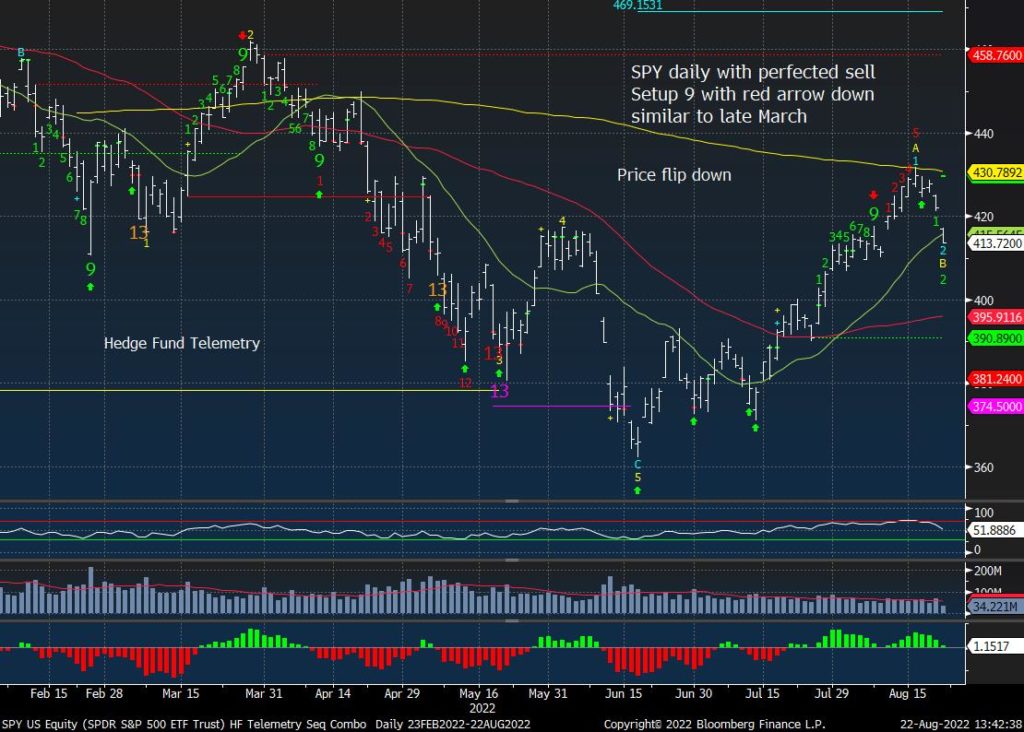
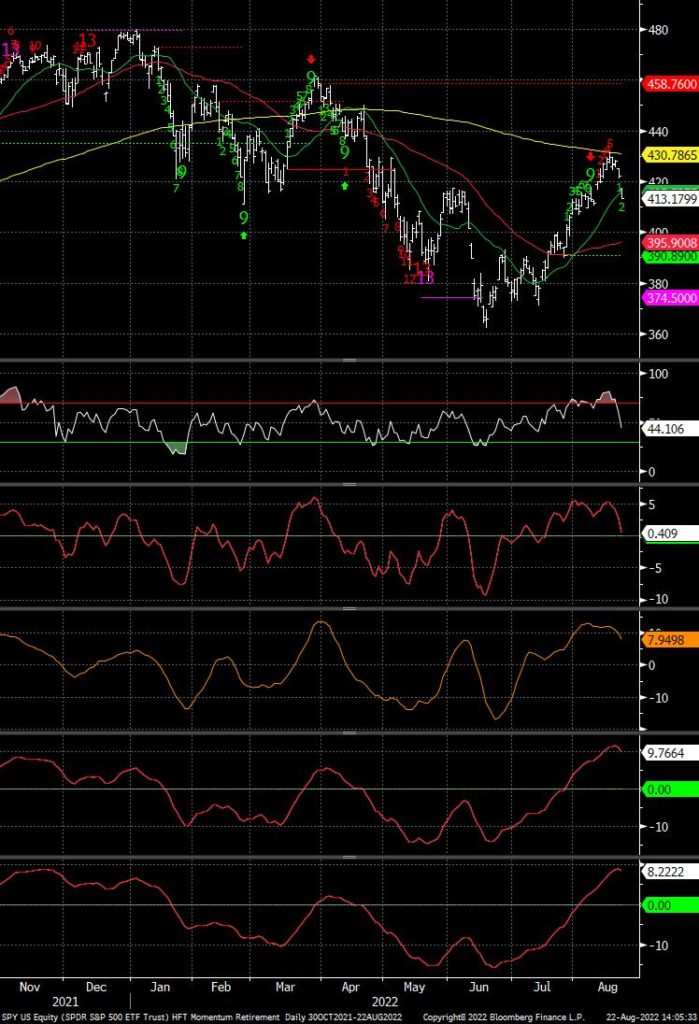
SPY daily failed at the 200 day which isn’t in itself that edgy. Today the 20 day broke and the 50 day at 395 is the next support level.
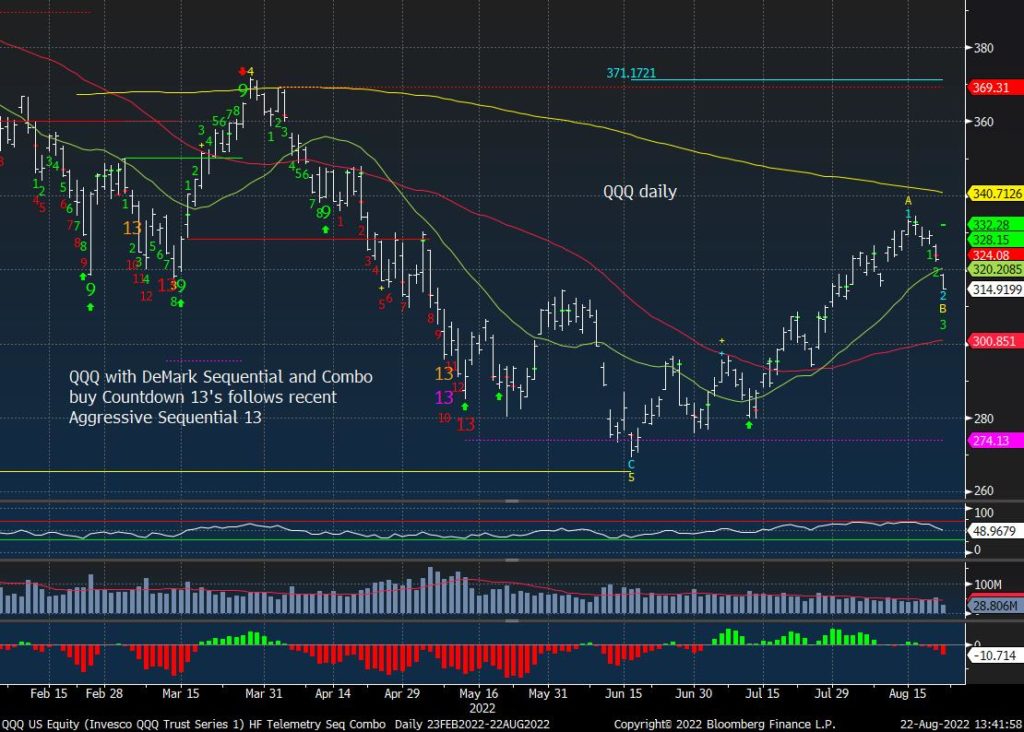
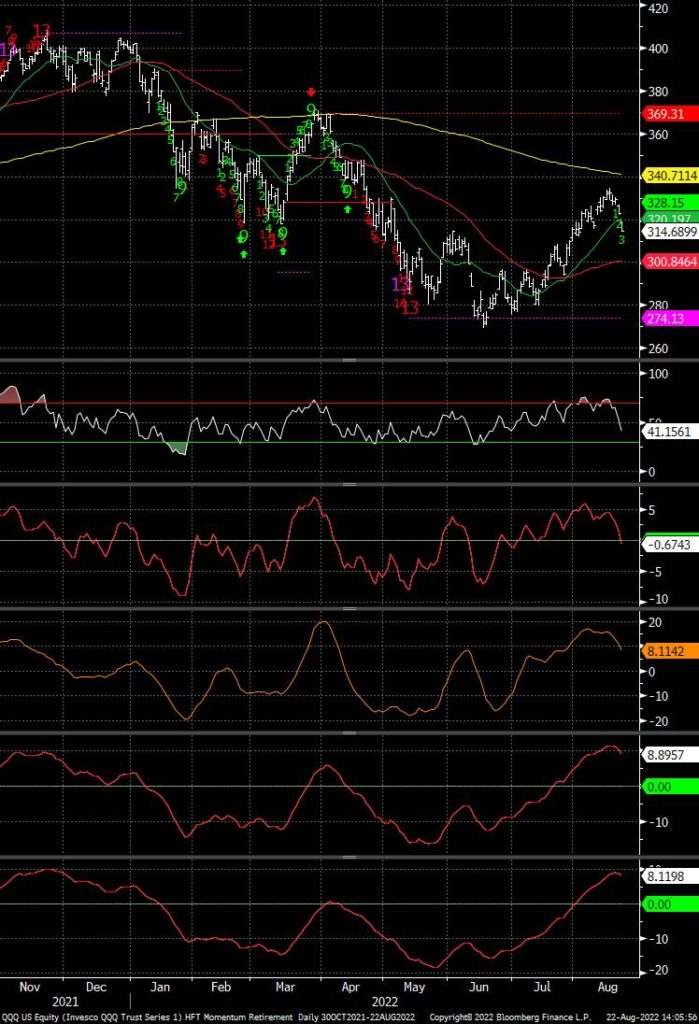
QQQ daily shows two gap down days. A move the 50 day at 300 doesn’t seem that impossible
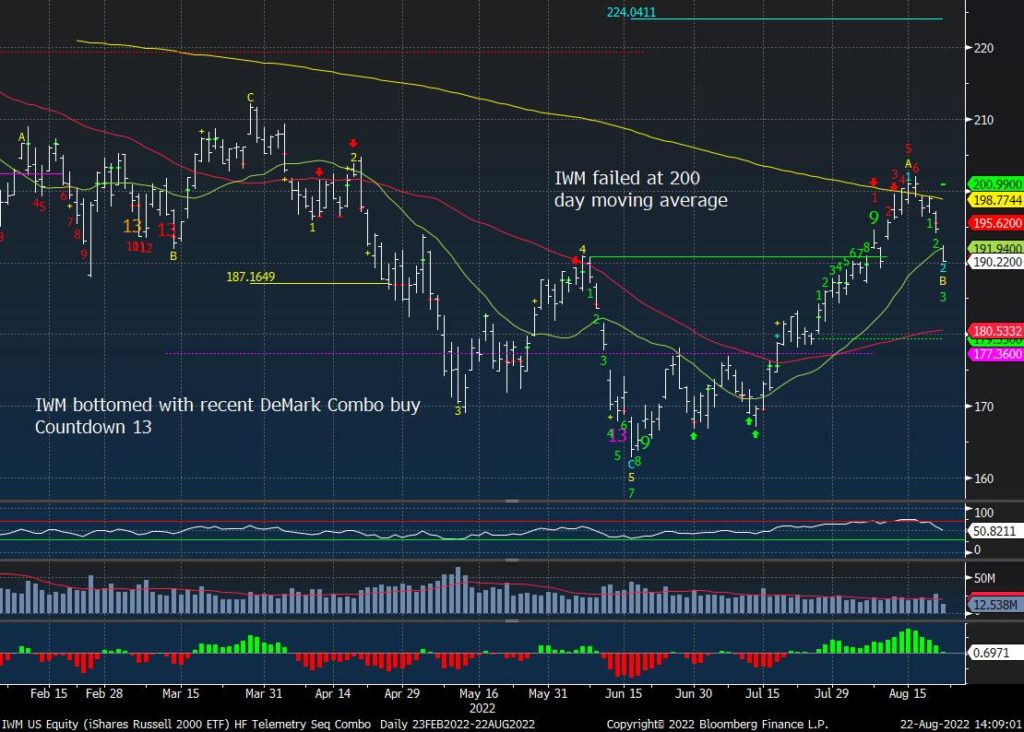
Russell 2000 IWM daily also failed at the 200 day.
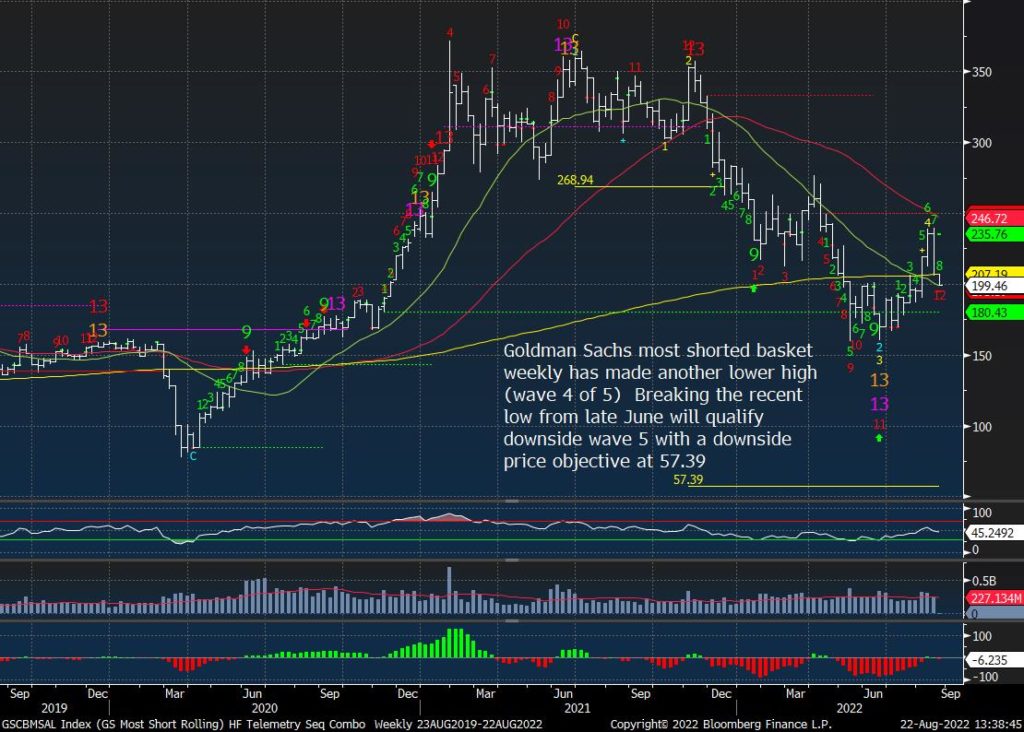
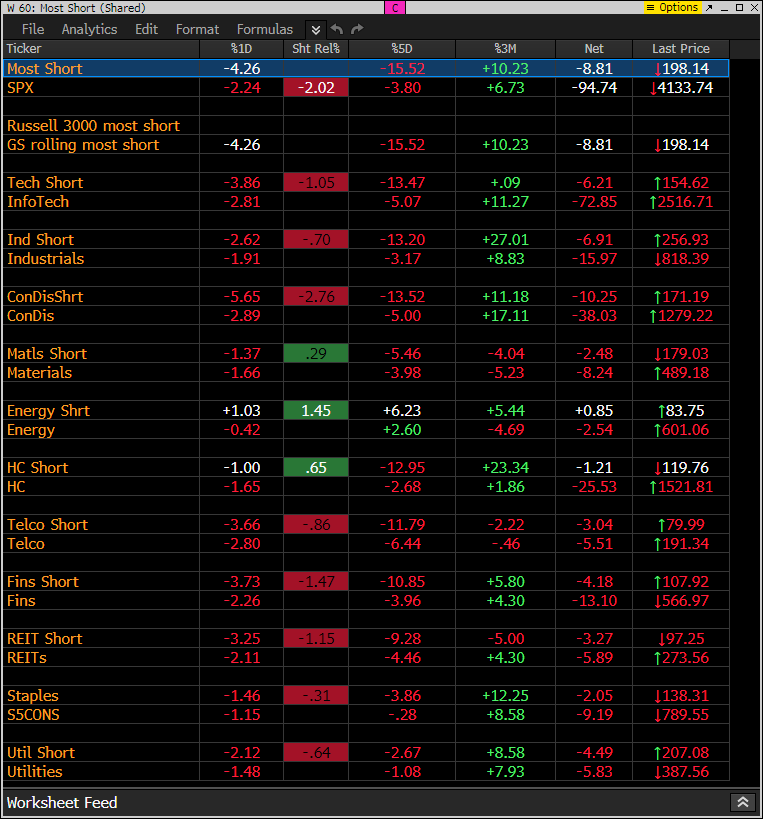
Goldman Sachs most shorted basket weekly with another lower high wave 4 of 5.
Momentum – short term bearish signs
On the site we have this momentum table and I need to do a teach-in on how to use this effectively. There are five short term to intermediate term technical inputs. The ranking is 1 Green Buy, 2, Amber neutral, 3 Red Sell. 1’s are over 50% or the 0 level. 2’s are near those lines and 3’s are under those lines.
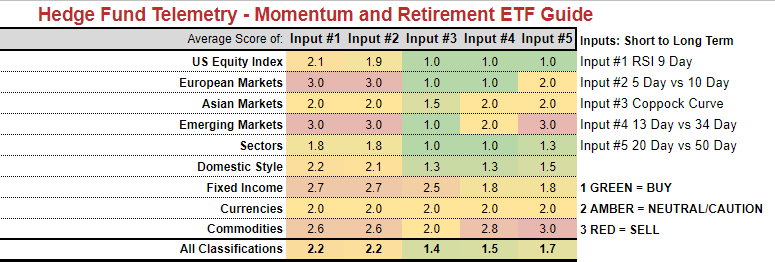
Here’s the full list, and you can see some that have started to turn bearish with the first two shorter-term indicators. Keep an eye on this monitor on the site tomorrow and the coming days to see if the intermediate term indicators turn bearish
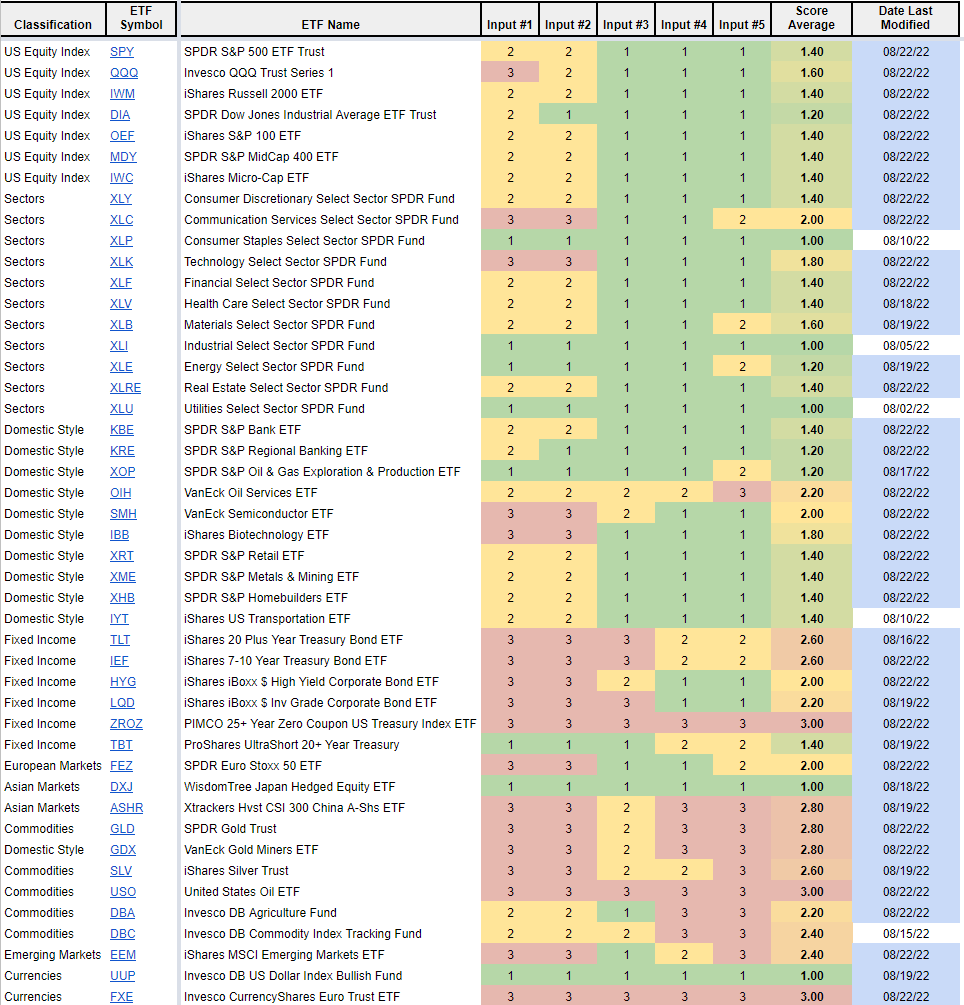
SPY has lost the first two faster indicators (#2 will turn bearish at the close) are bearish, the other longer term are hooking down and will take time to turn bearish
QQQ has lost the first two faster indicators and have turned bearish, the other longer term are hooking down and will take time to turn bearish
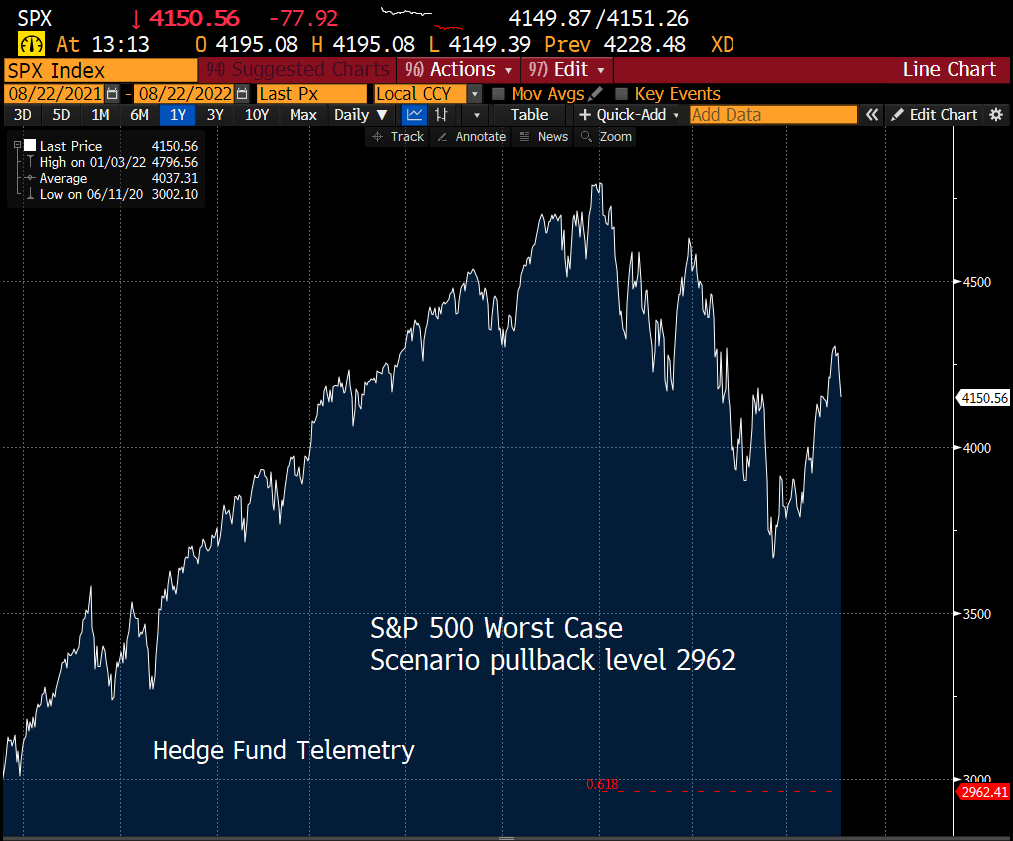
Worst case scenario
I was interviewed for Business Insider today and asked what the worst-case scenario is for the S&P 500. This is a DeMark Absolute Retracement off the highs. I said I would aggressively buy if we even got near this price. I’m not sure this will happen, but I did this years ago in 2007 when my junior traders asked me what the worst-case scenario was, and I said S&P 690 using the same indicator. The S&P was near 1500 at the time. They had a good laugh at me. “He’s crazy!”
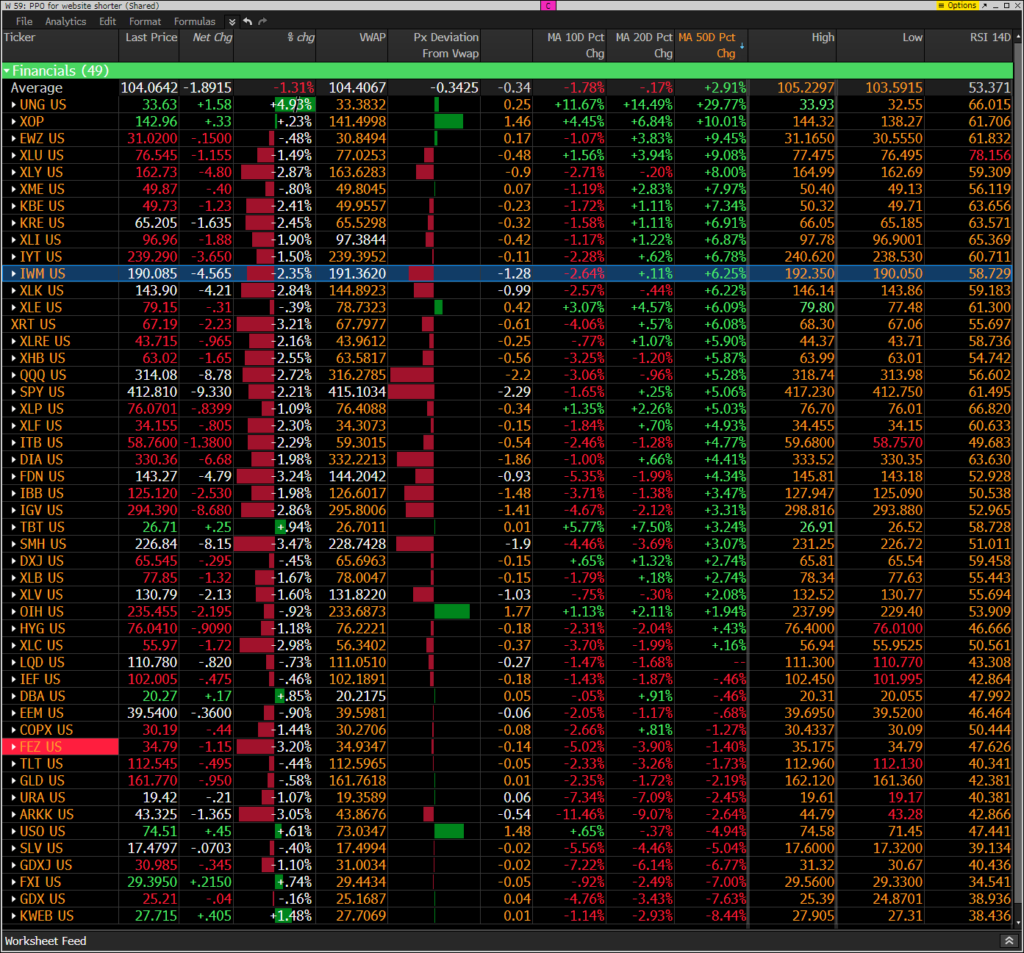
FACTORS, ETFs, GOLDMAN SACHS SHORT BASKETS AND PPO MONITOR UPDATE
The 5 day rolling is nearly all red, and the 1 month big gains have given back a lot already
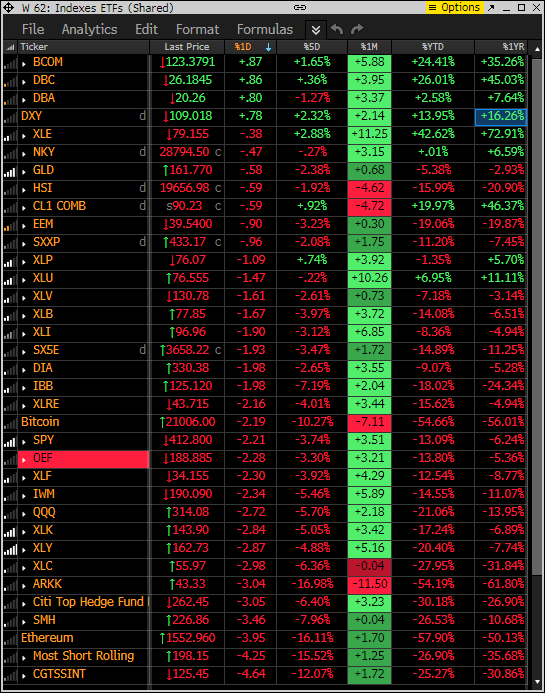
This monitor has the S&P indexes and the Goldman Sachs most shorted baskets. Today the shorts are winning again with the rolling 5 day shorts -15%.
The PPO monitor (percentage price oscillator) force ranks ETF’s by percentage above/below the 50 day moving average. For information on this monitor please refer to this primer. This monitor is offered to Hedge Fund Telemetry subscribers who are on Bloomberg. Ugly price action well under today’s VWAP levels.