
I was thinking of doing a market webinar tomorrow morning. Lee Ann has informed me that I have a grandparent’s day tomorrow morning at my grandson’s preschool, and tomorrow’s Mid Morning will be out a little late. Let me see if I can get the webinar set up for Wednesday. By the way, I can’t believe I am a grandfather. What a joy!
Quick Market Views
Stocks: Everything has become very oversold with internals and other indicators (see below). I still would like more downside DeMark exhaustion signals pending on the indexes. Regardless, I am setting up longer on the Trade Ideas sheet. Breadth is very strong, combined with good upside gains with follow-through essential tomorrow. It’s not all clear as there remain a lot of risks, including earnings guidance cuts, Putin and his threats of using nukes, and liquidity issues at major banks/asset managers. One of the issues within the earnings/guidance is the FX markets with the US dollar strength. The ISM manufacturing data came in lower at 50.9 vs. 52 expectations. A significant low in the mid to low 40s would signify an economic low. The positive from the report that is lifting the markets is the employment data in the report was much weaker, which could be a precursor for this Friday’s or future employment data weakening. Cantor Fitz bearish strategist turned bullish and has a conference call at 11:30 am ET today.
Bonds: Bonds are significantly bouncing, with the 2-year and 10-year yield both lower by 23bps. The 2/10 spread is at 45bps now.
Commodities: Crude is ripping higher with potential for OPEC+ output cuts coming. Gold is continuing higher helping our GDX long trade.
Currencies: The US dollar is down moderately with Sterling up nearly at 1.13.
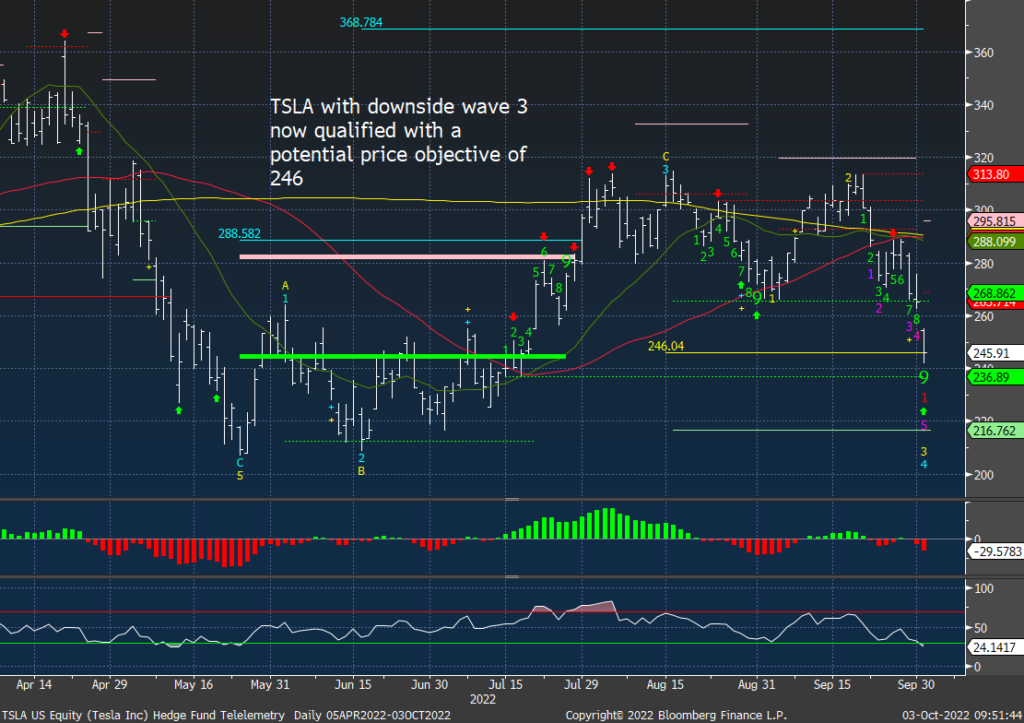
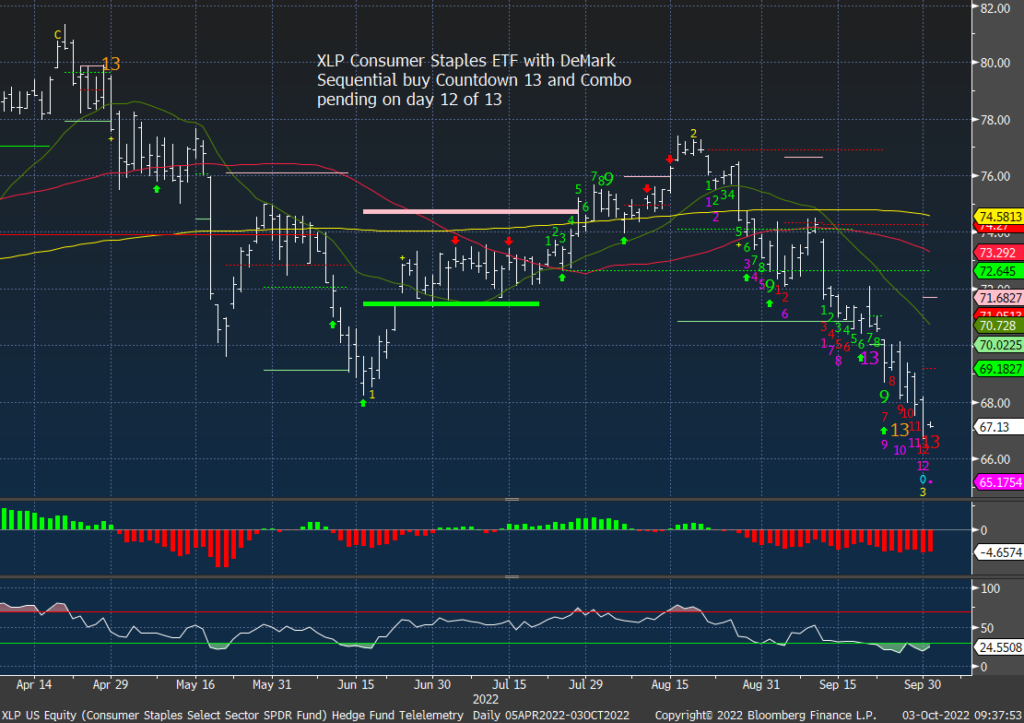
Trade Ideas Sheet: I am adding 2% long positions today: PG, XLP, XLU. As mentioned earlier on First Call, I did take profits on the TSLA 265-240 put spread which was a nice way to start the week.
US Market Indexes and Sentiment
Here is a primer on how we use Daily Sentiment Index charts. Lower on this note is bond, currency, and commodity sentiment.
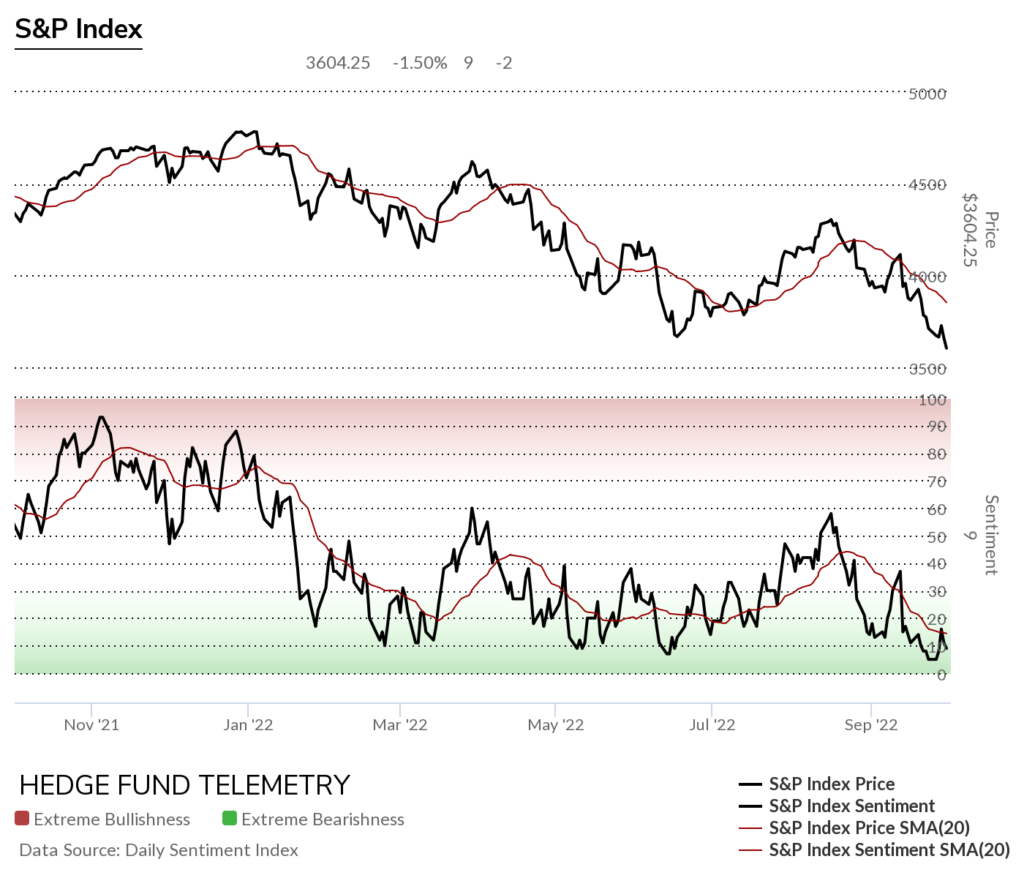
S&P bullish sentiment and Nasdaq bullish sentiment remain in extreme oversold zone
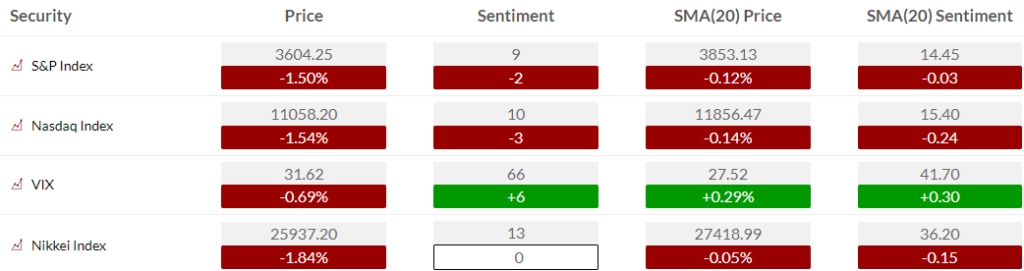
S&P bullish sentiment with a small potential positive divergence as the index hit a new low while the 5% extreme low seen last week held.
Here is a primer on the DeMark Setup and Sequential indicators.
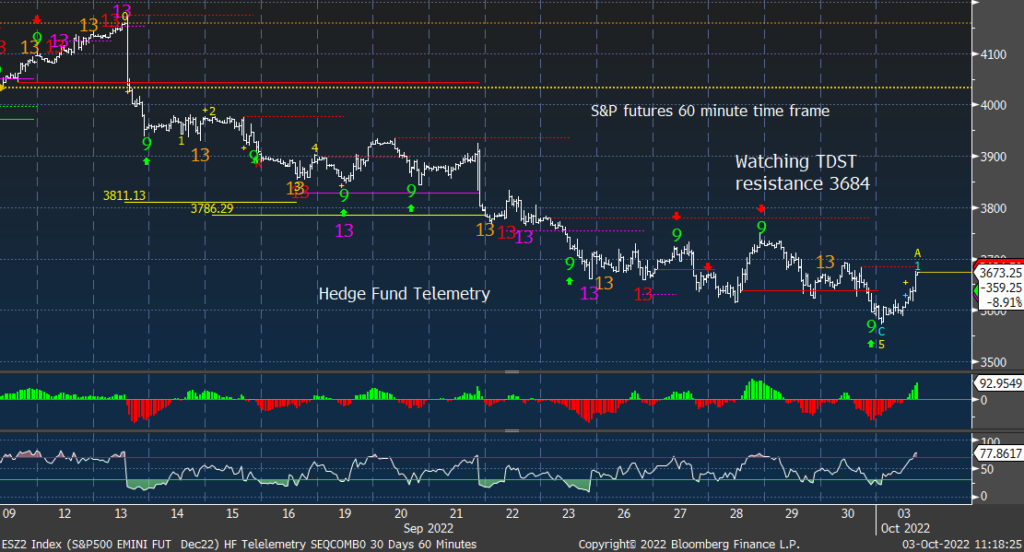
S&P futures 60-minute time frame nearing upside resistance I mentioned earlier on First Call note.
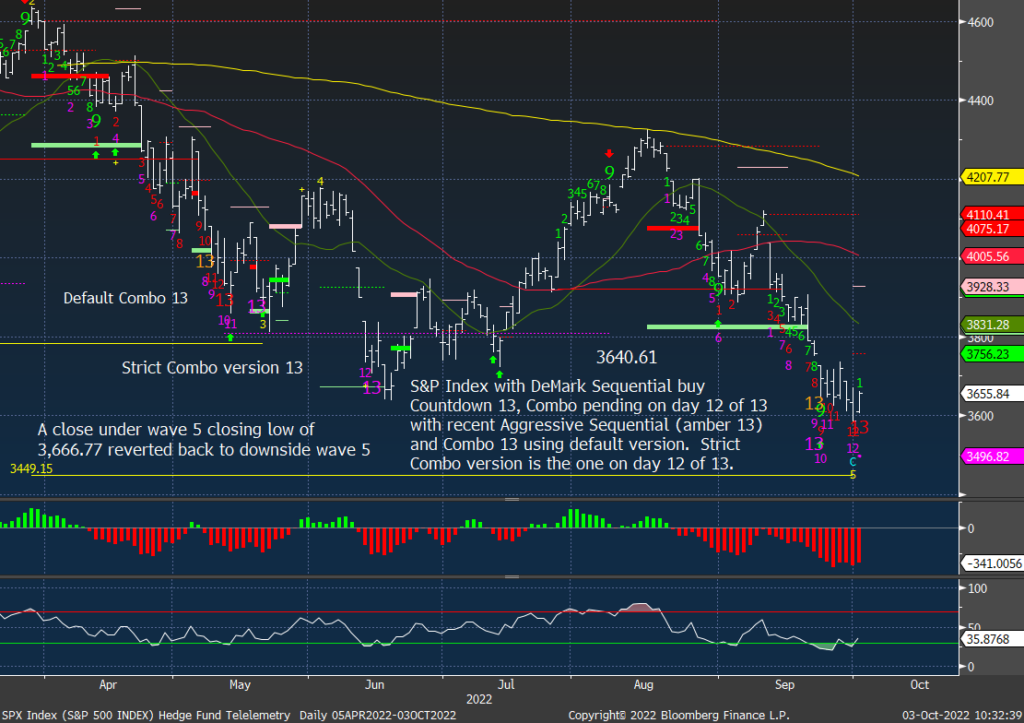
S&P 500 Index daily with the Sequential buy Countdown 13 and price flip up. Importantly seeing continuation after the price flip is essential.
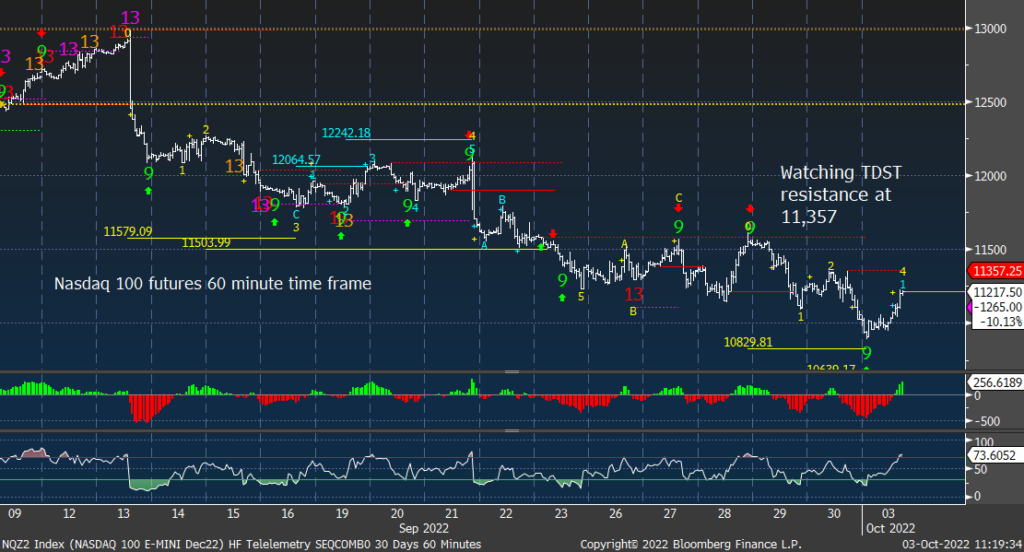
Nasdaq 100 futures 60-minute time frame bouncing after buy Setup 9 from Friday
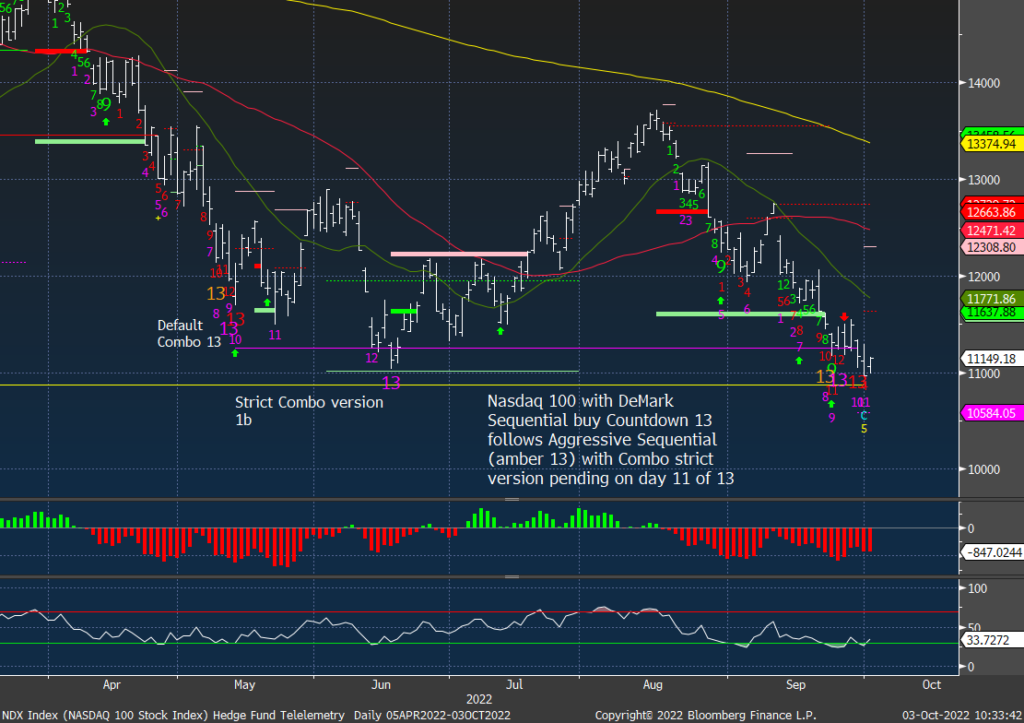
Nasdaq 100 Index daily also with a new Sequential buy Countdown 13. No price flip yet
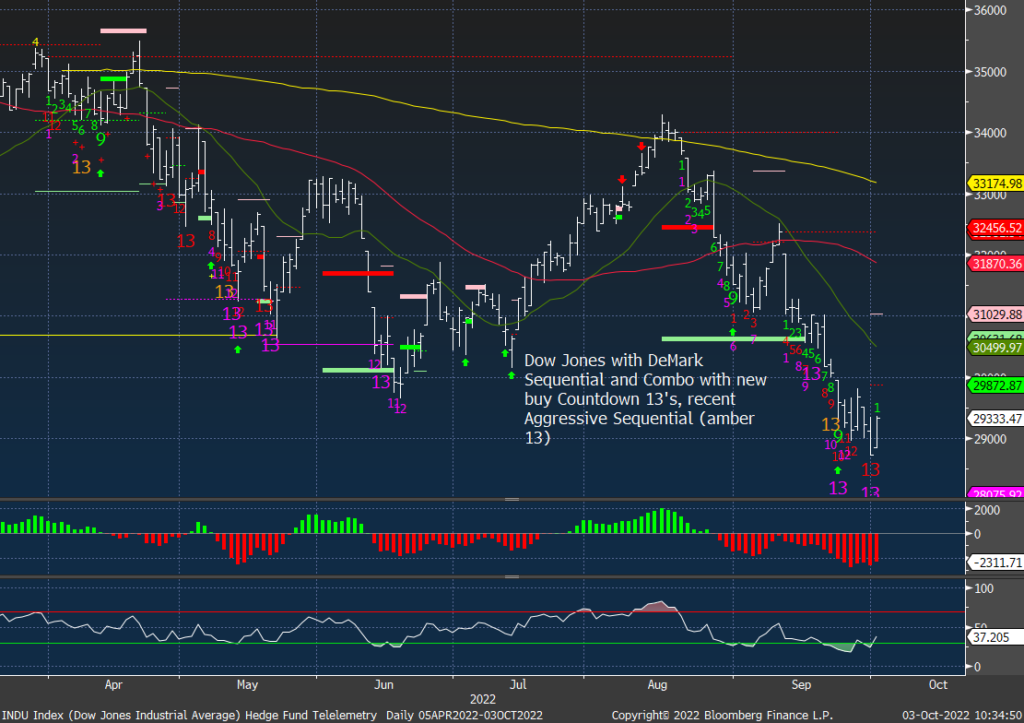
Dow Jones did get the Sequential and Combo 13’s and has a price flip up today.
Trade ideas
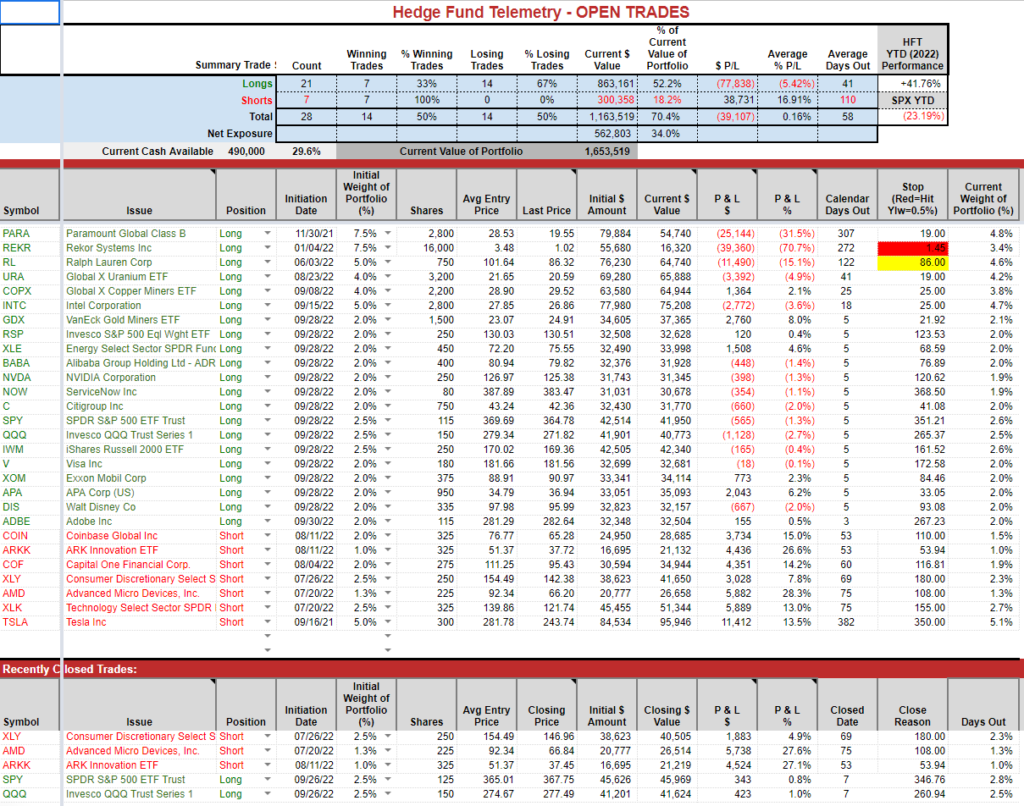
I typically am early when I start to scale into and out of positions. I remain confident the recent long ideas that were added will work. Many already are with today’s gains. I have kept sizing small in order to ride through some volatility and give it time for these to sprout. Shorts continue to work well with TSLA down hard. Some of the longer term long ideas PARA, REKR, RL, INTC are still in need of a lot of work ahead and I continue to believe in them. Despite these dogs, the overall YTD gain remains strong. I am looking to build on these gains to end the year higher.
Tesla missed delivery guidance by a decent amount. They reported 344k deliveries vs 358k consensus. That consensus estimate dropped significantly in the last week with some dropping their estimates from near 400 or 380 into the 350 levels. Wonder how they knew? I took off the put spread I added Friday with a nice gain. The chart now has the price at the downside wave 3 price objective of 246 that I had been watching. There is a Setup 9 and if this continues lower a new downside Sequential will begin. The next support level to watch is 236.89 the TDST support line. If this loses the May/June lows, big IF, then a lot of unwind could happen. Since TSLA is such a big weight in the indexes it could cause more downside to the indexes if this breaks.
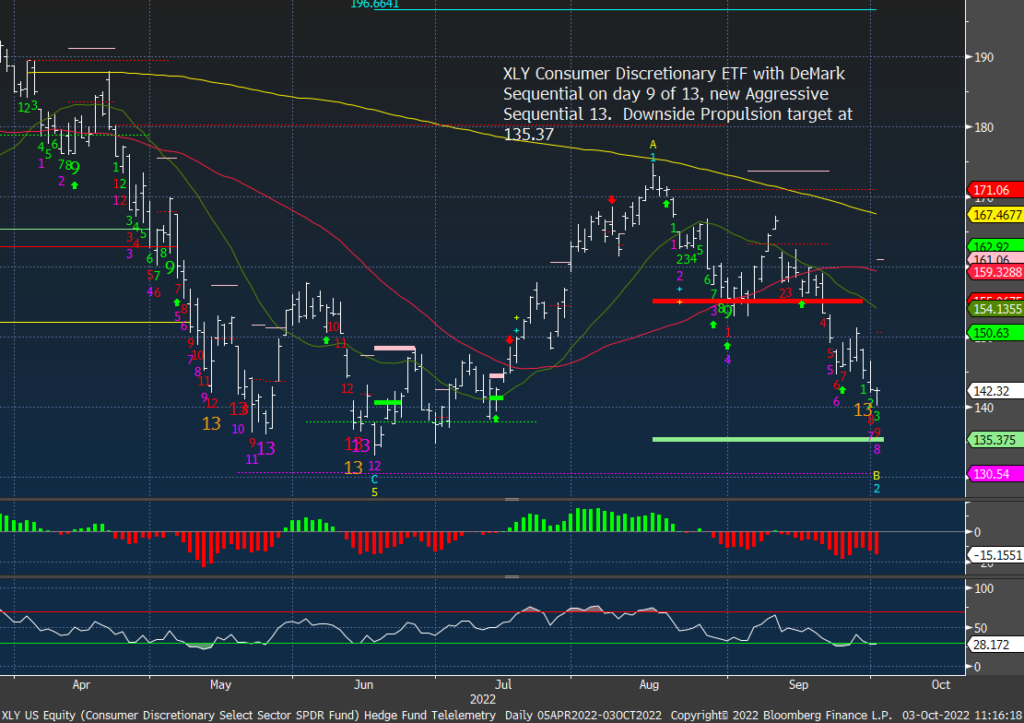
I remain short XLY partly due to TSLA being a top holding. The DeMark countdowns are not yet complete and are in progress.
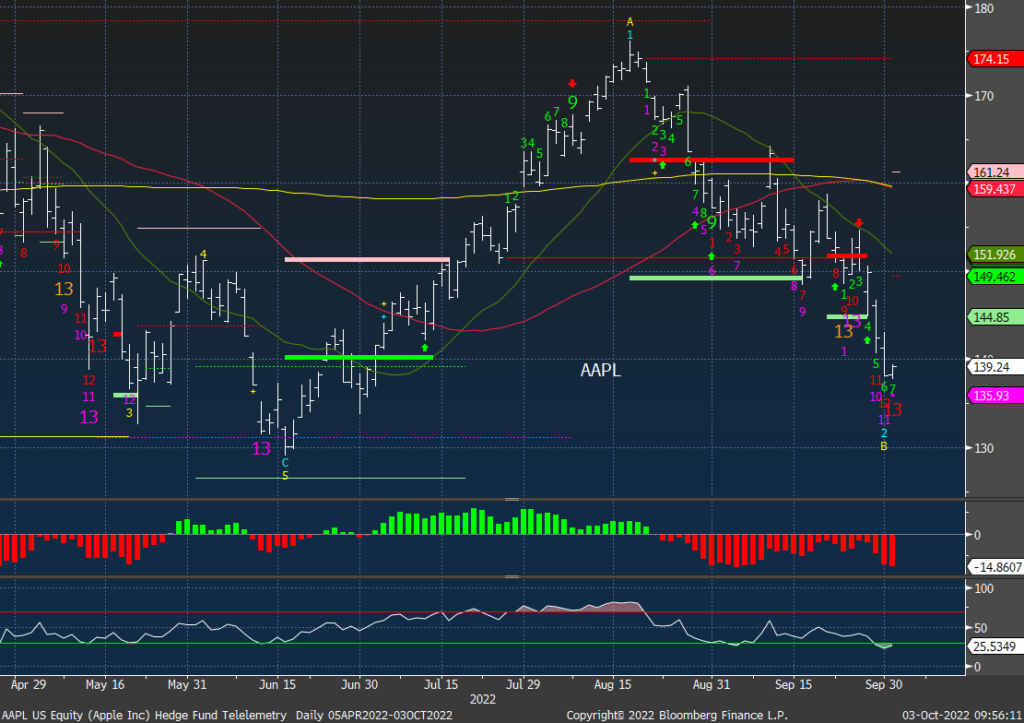
AAPL is a war zone with a lot of people trading it on the short side. There is a new Sequential 13 with the Combo only on day 11 of 13. I wouldn’t short this here just because it’s crowded and could squeeze. That doesn’t mean I don’t think it can go lower.
XLP Staples has a new Sequential buy Countdown 13 with a Combo near. I am adding a 2% long position today.
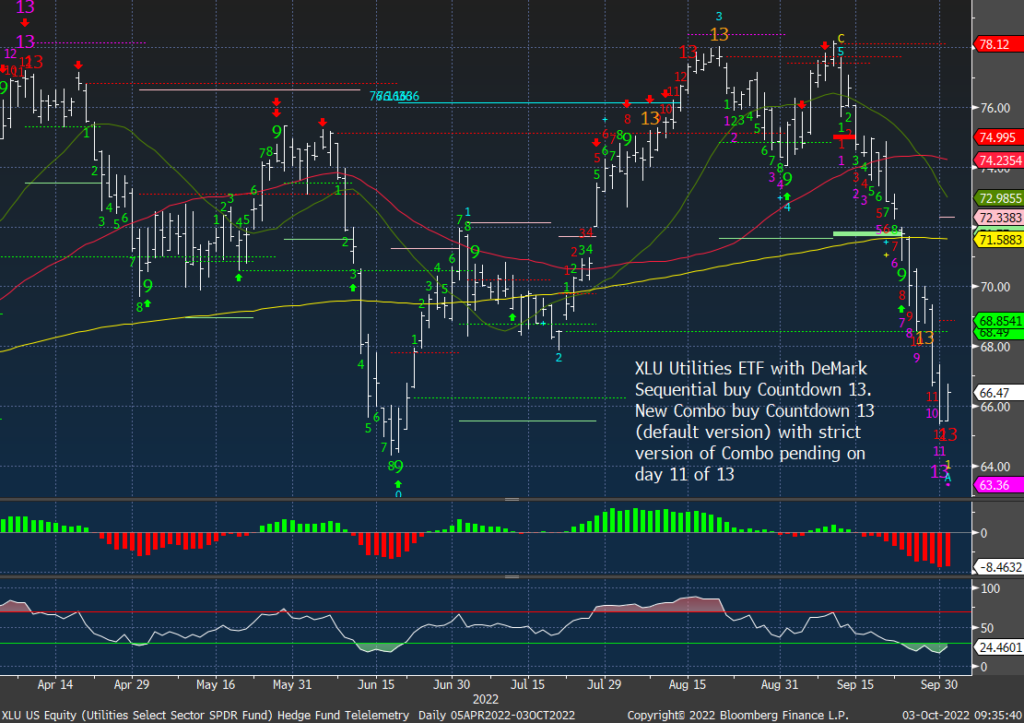
XLU has a new Sequential and Combo buy Countdown 13. I am adding a 2% long position today.
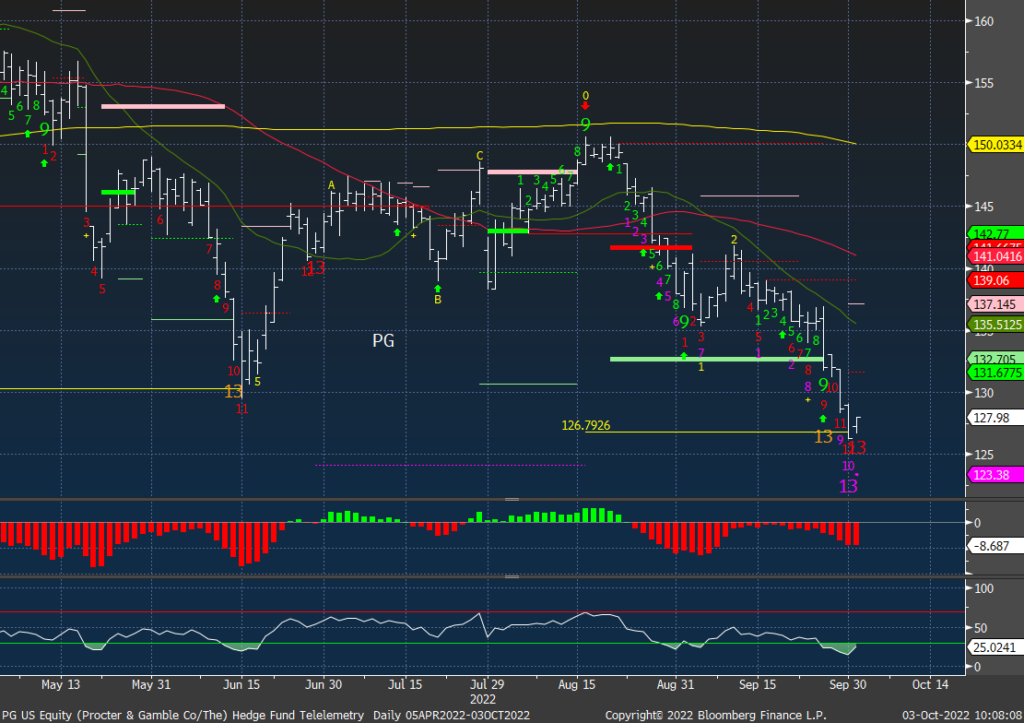
PG like XLP has some exhaustion signals in play. I am adding a 2% long position today.
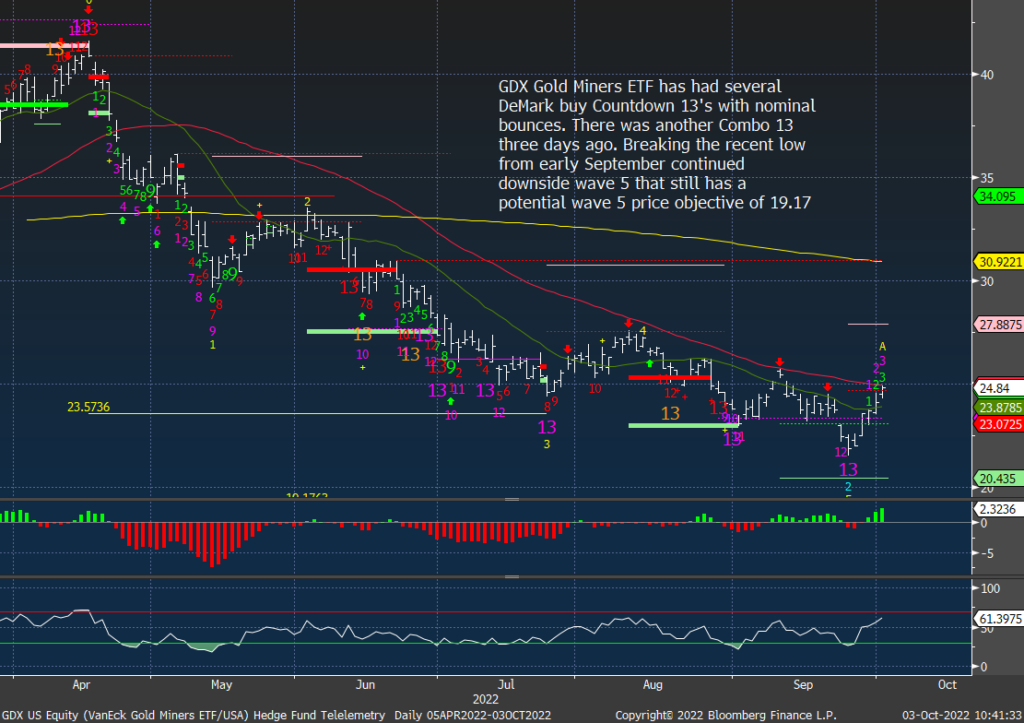
GDX Gold miners are continuing to lift after the recent DeMark Combo buy Countdown 13. I remain long with a 2% sized position. That’s enough as we’ve seen a lot of false starts.
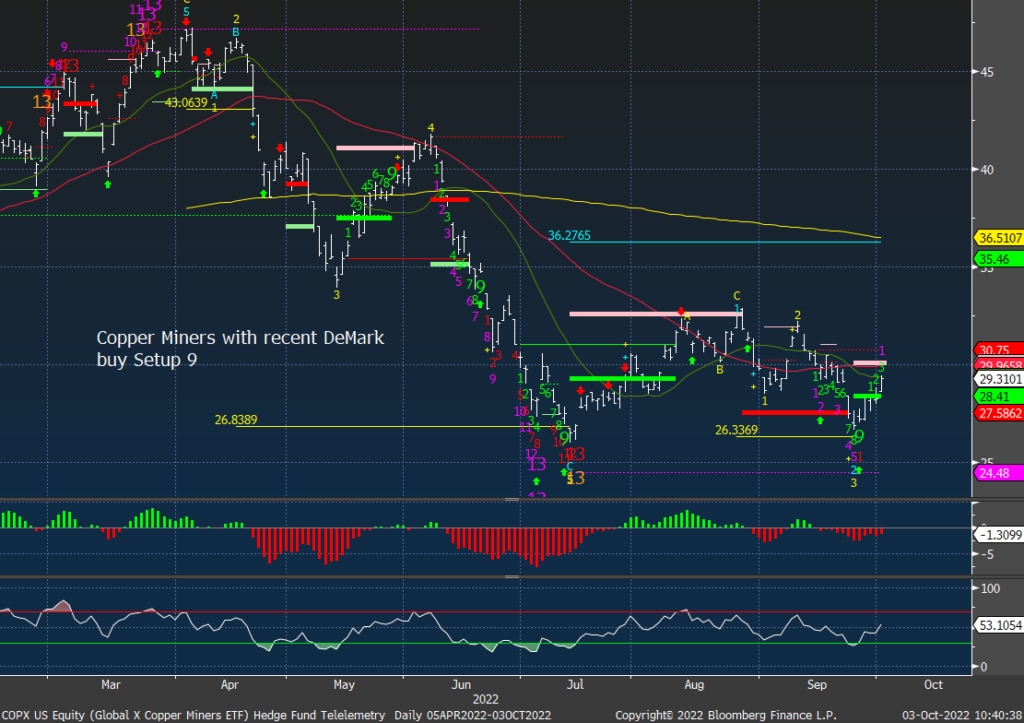
I added last week to the COPX Copper miners long and it really needs to clear the recent highs to add to my conviction.
internals are oversold… very oversold
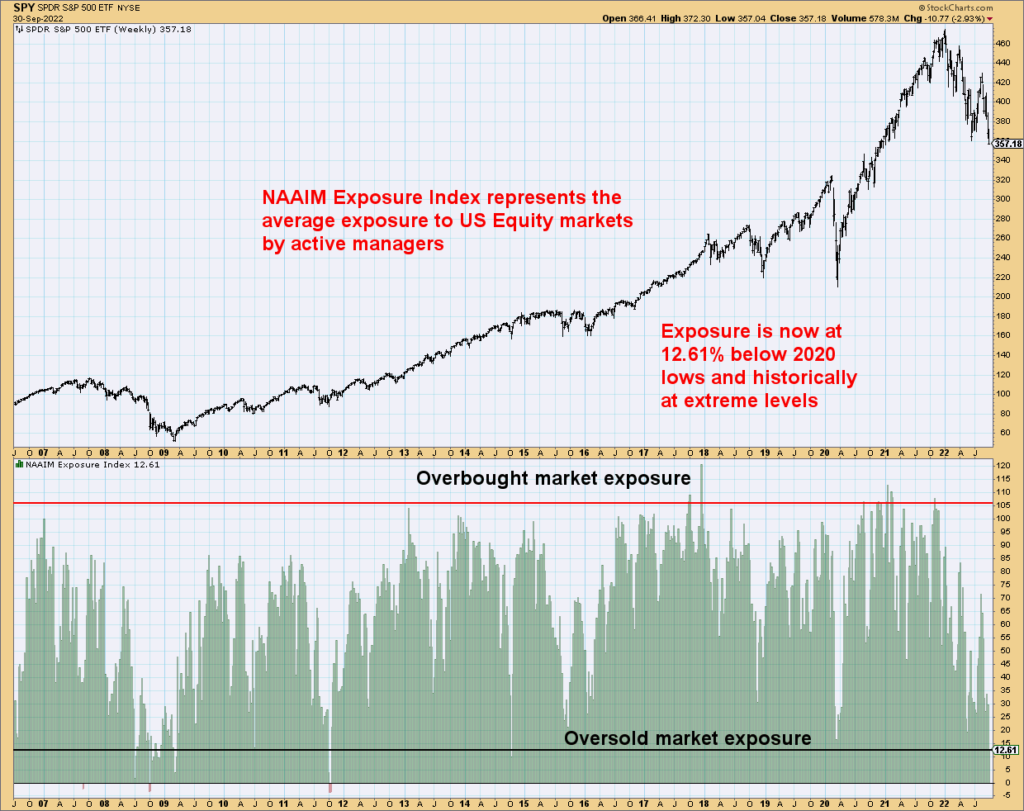
Active managers have lower market exposure vs March 2020. This doesn’t mean it will go up as it stayed low in the 2008-2009 period, but this could see a significant bounce if managers come back.
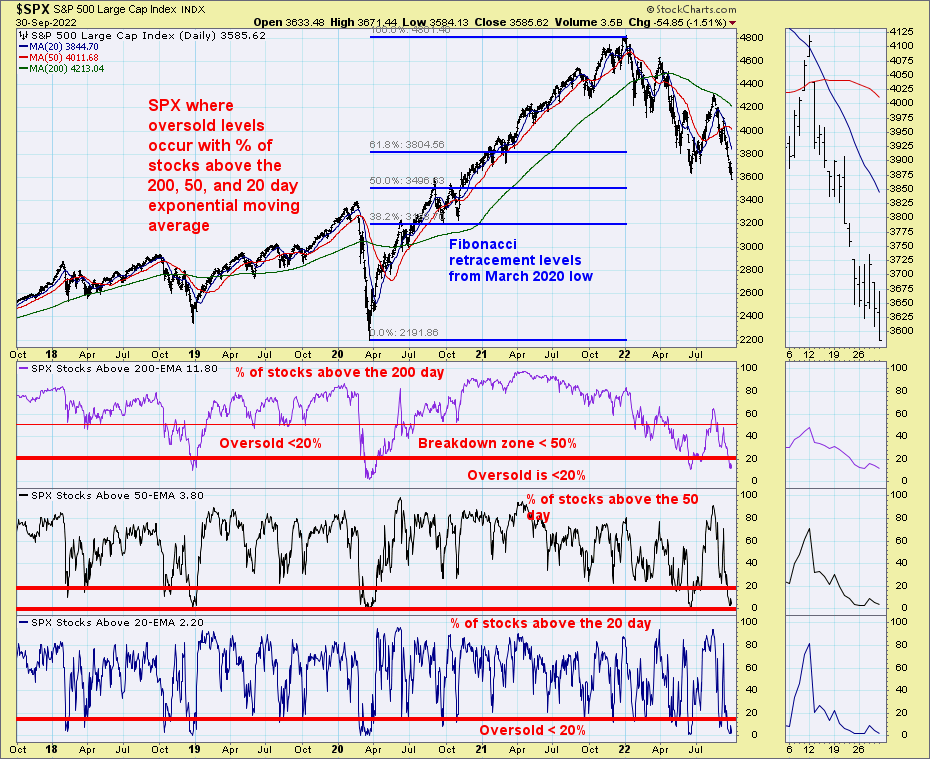
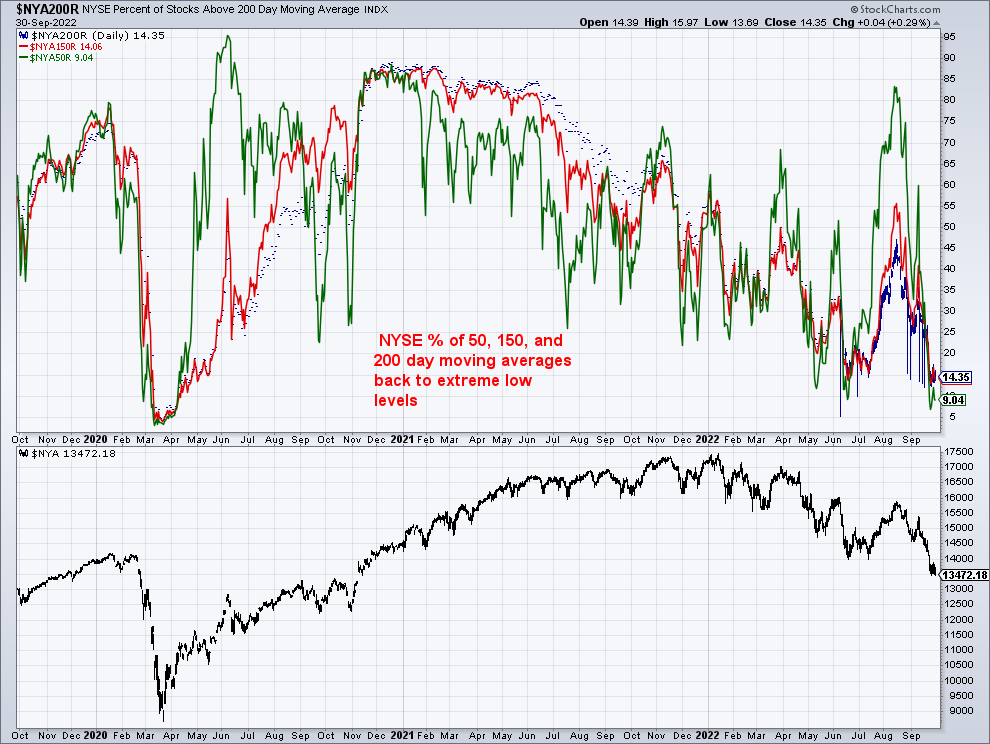
I use this simple look to determine oversold levels. The percentage of stocks within the S&P above the 20, 50 and 200-day moving averages is at extreme lows. 3.8% above the 50-day and 2.2% above the 20-day is very oversold.
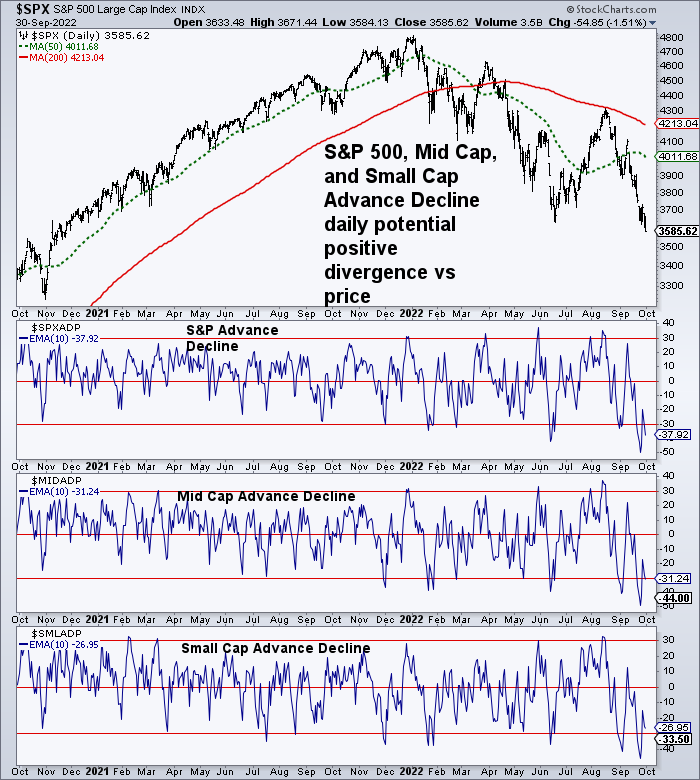
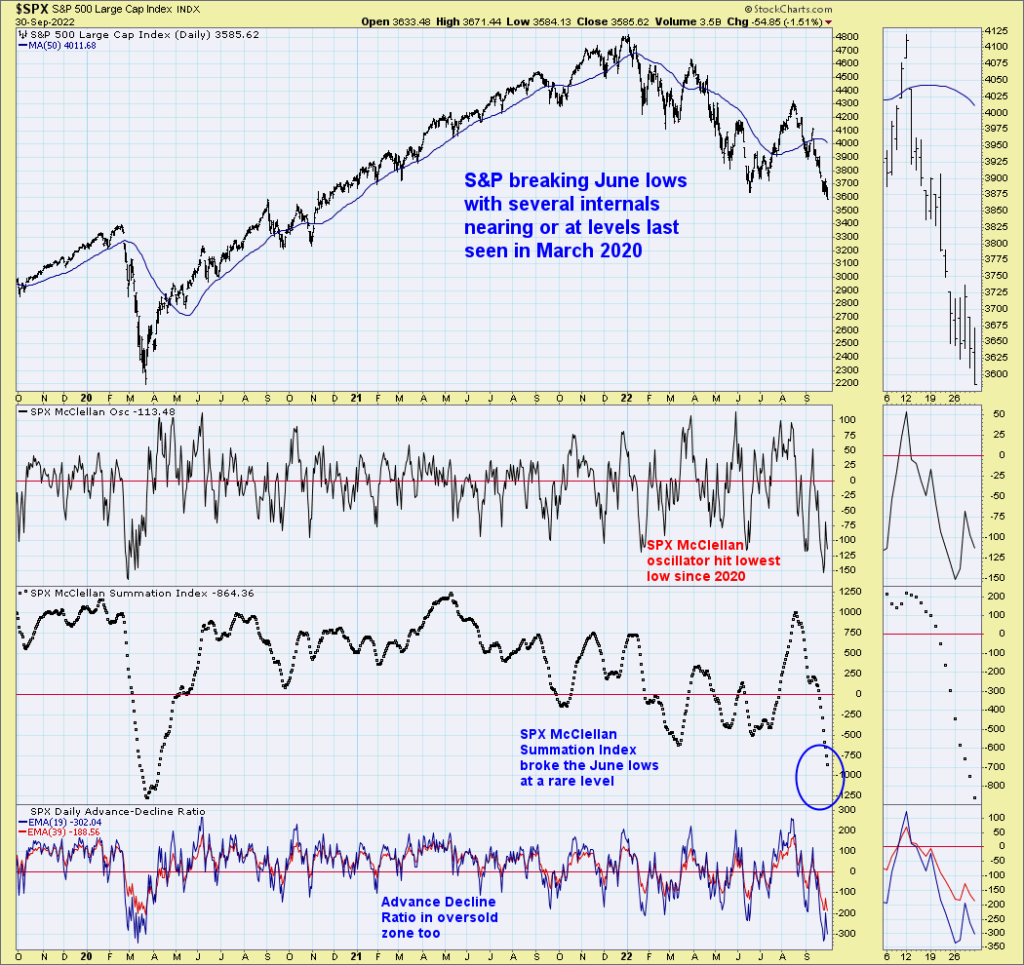
The advance decline data reached deep oversold levels last week. Keep an eye on this as I will post more this week on the notes.
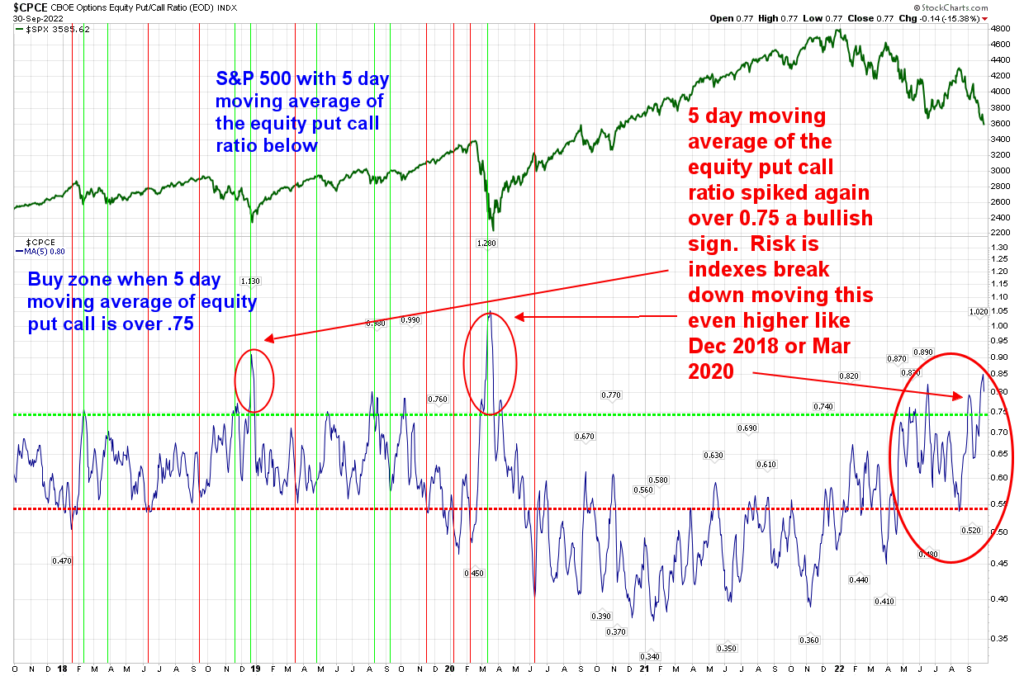
The 5-day moving average of the equity put-call ratio is in the extreme zone. This could see a bounce develop although it’s been higher on more capitulation-like lows seen in Dec 2018 and March 2020.
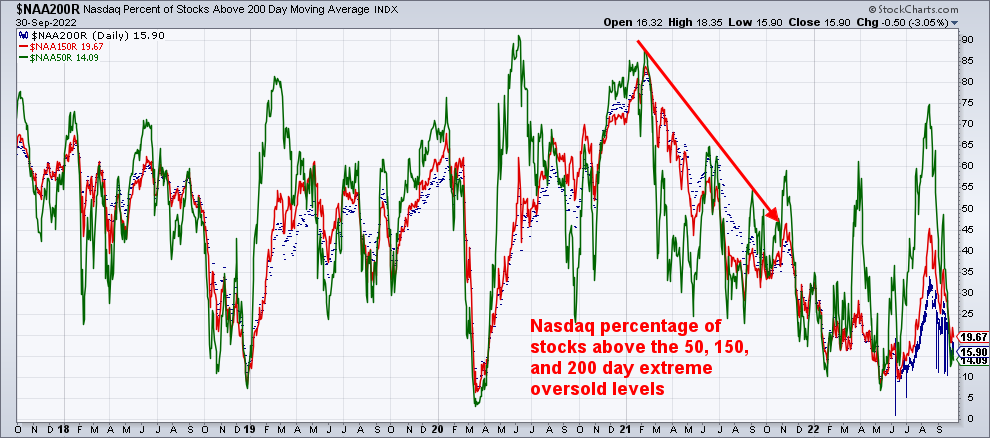
NYSE and Nasdaq percentage of stocks above 50, 150, and 200 day are back in the extreme zone.
S&P 500 with McClellan oscillator and summation indexes at oversold levels.
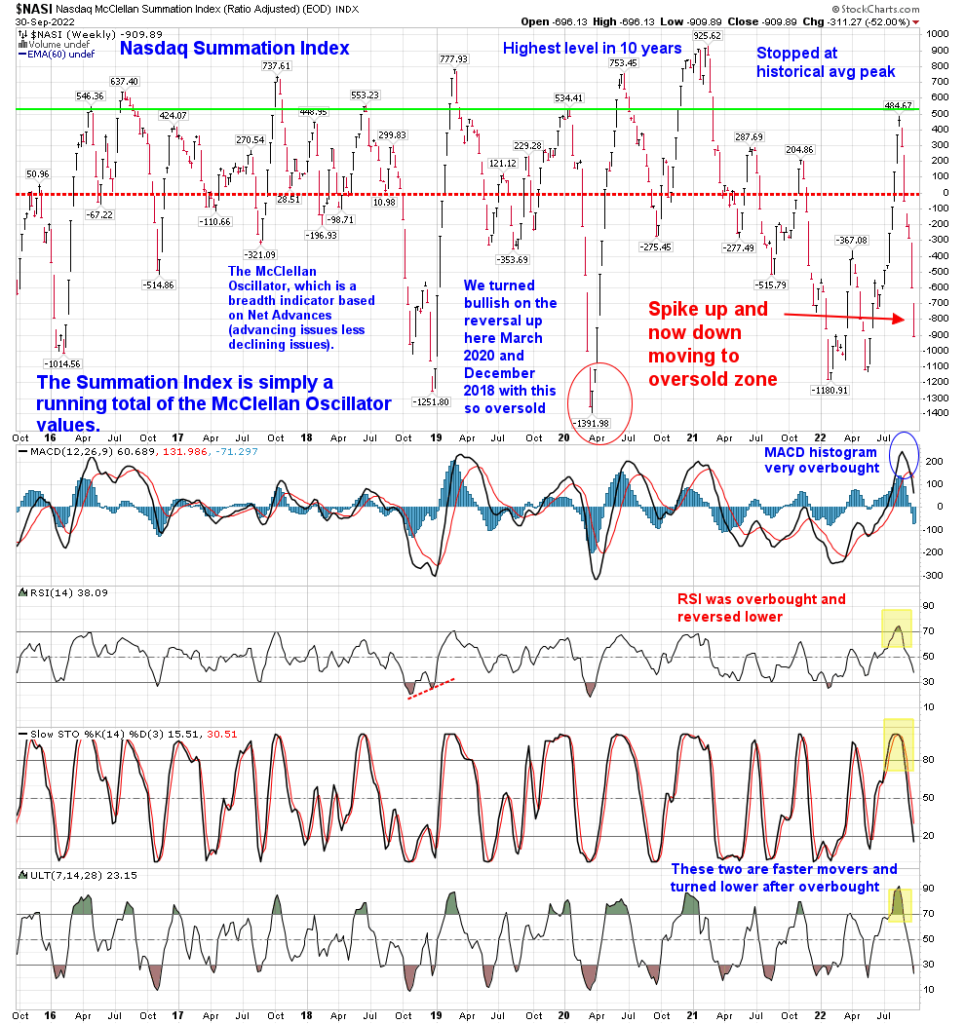
The Nasdaq summation index weekly also is in the oversold zone nearing -1000
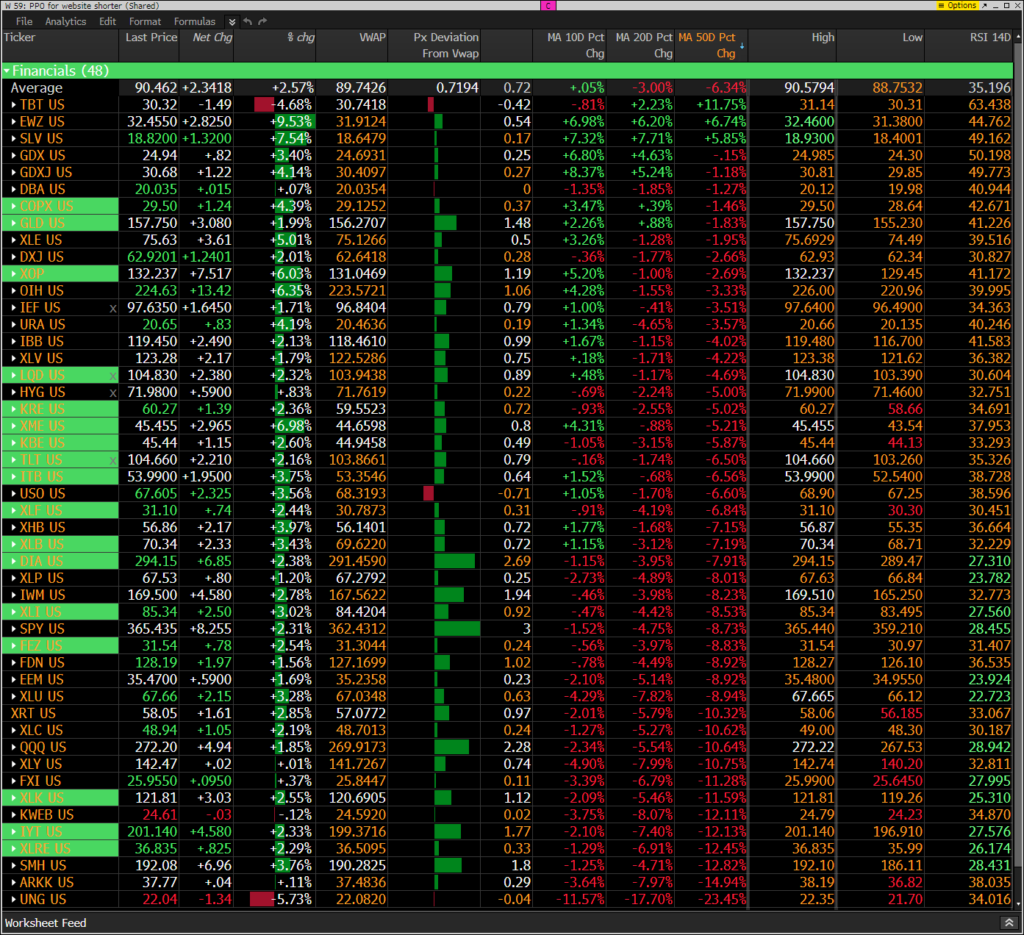
Hedge Fund Telemetry ETF Percentage Price Oscillator Monitor
The PPO monitor (percentage price oscillator) force ranks ETFs by percentage above/below the 50-day moving average. For information on this monitor please refer to this primer. This monitor is offered to Hedge Fund Telemetry subscribers who are on Bloomberg. Strong gains across the monitor with most also above today’s VWAP levels.
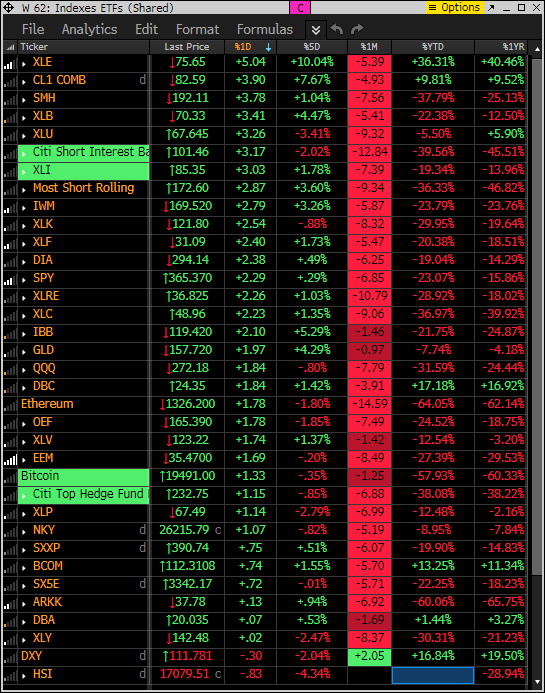
Index ETF and select factor performance
This ranks today’s performance and has 5-day, 1-month, and 1-year rolling performance YTD. Very strong gains today and surprisingly the rolling 5 day period also is showing gains on many ETF’s
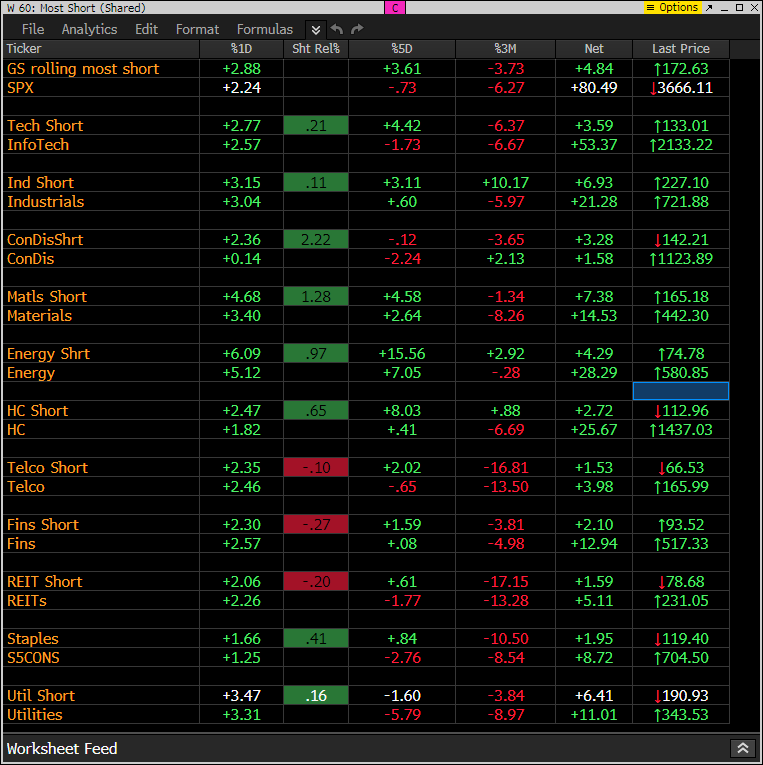
Goldman Sachs Most Shorted baskets vs S&P Indexes
This monitor has the S&P indexes and the Goldman Sachs most shorted baskets. Today the shorts are getting squeezed as I do believe shorts piled on last week. The strength overall with the S&P sectors is a sign I believe is real money buying and not just shorts covering.
DeMark Observations
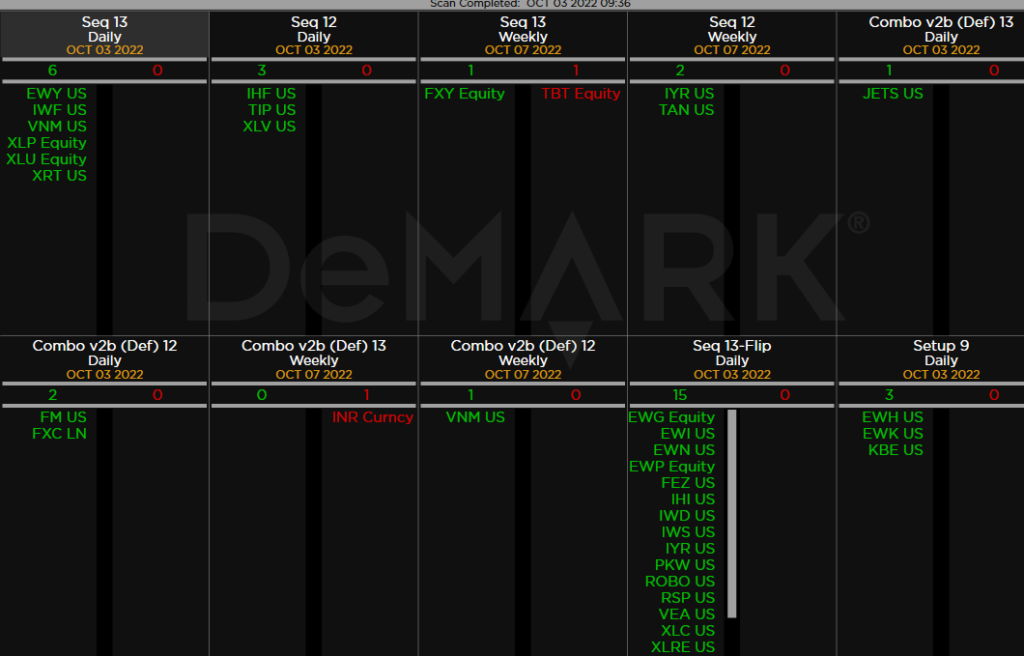
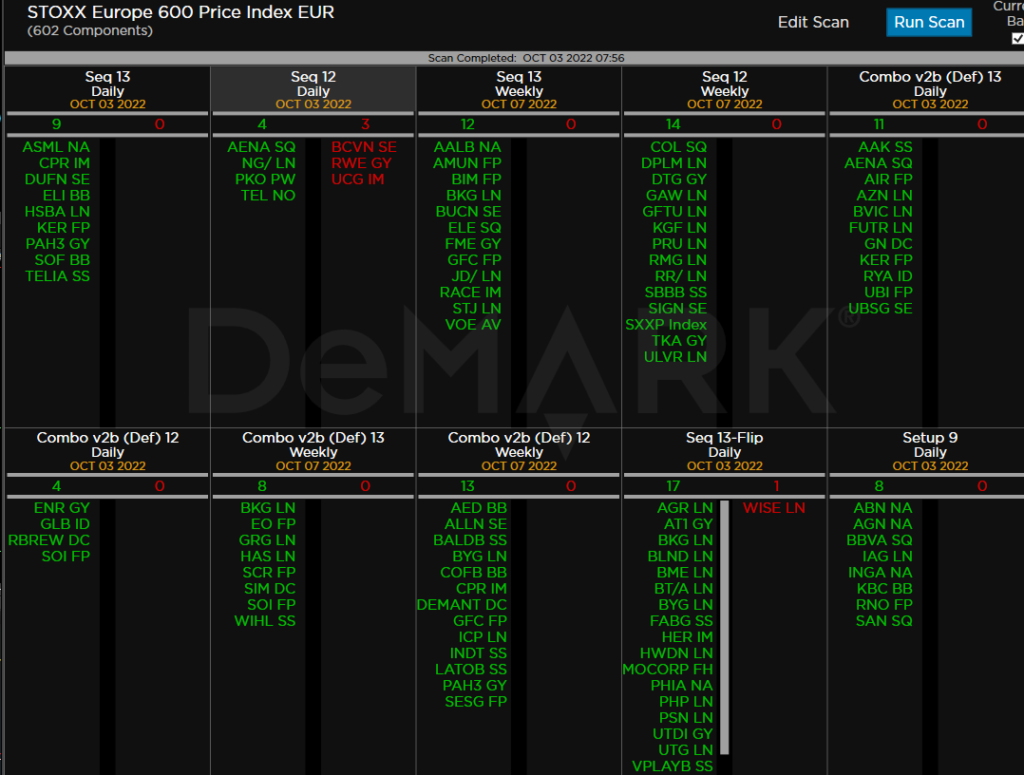
Within the S&P the DeMark Sequential and Combo Countdown 13’s and 12/13’s on daily and weekly time periods. For information on how to use the DeMark Observations please refer to this primer. The extra letters at the end of the symbols are just a Bloomberg thing. Worth noting: Continued many new DeMark buy Countdown 13’s and on deck 12’s. This is a good thing however seeing the price flip up adds to conviction. A “price flip” is defined as a contra-trend move identified by a close higher than the close four price bars earlier. To complete the Setup 9 there must be nine consecutive closes higher than the close four price bars earlier. If this pattern is interrupted the Setup will cancel and disappear from the chart
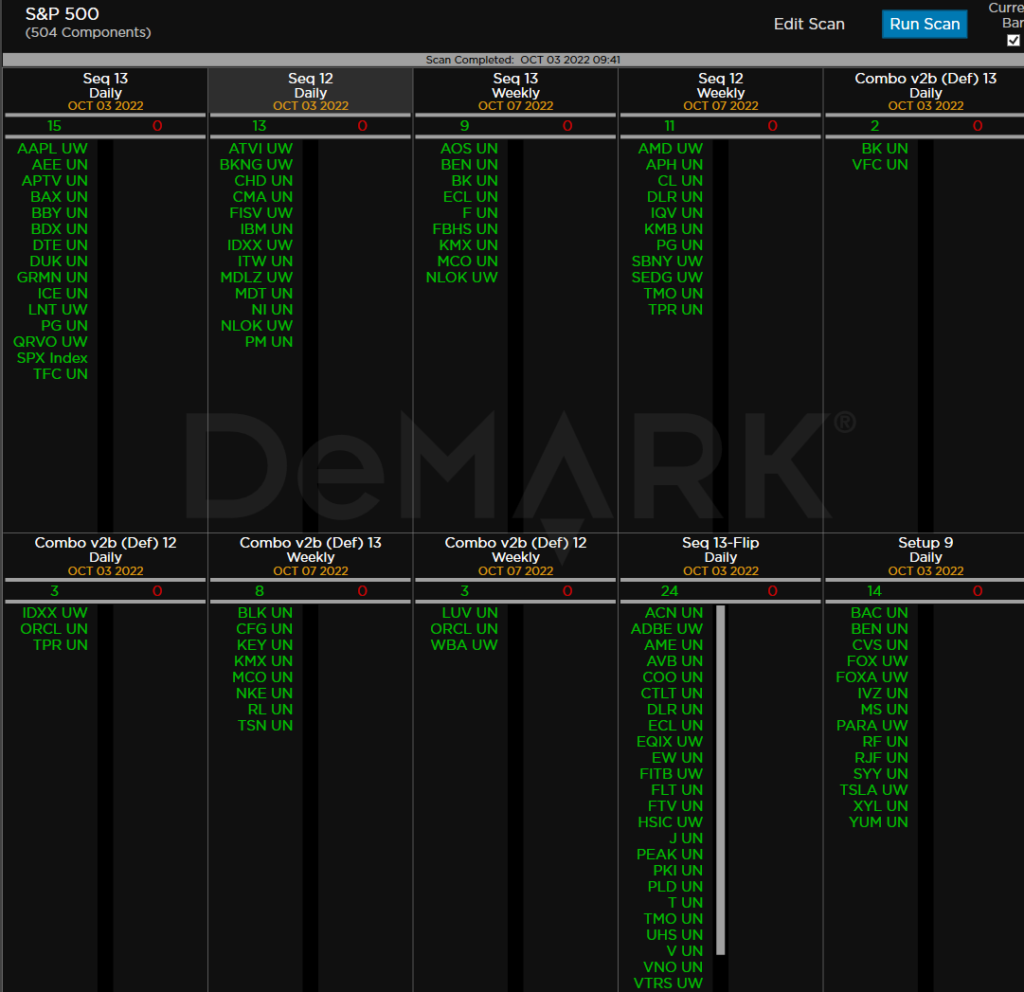
Major ETFs among a 160+ ETF universe.
Euro Stoxx 600
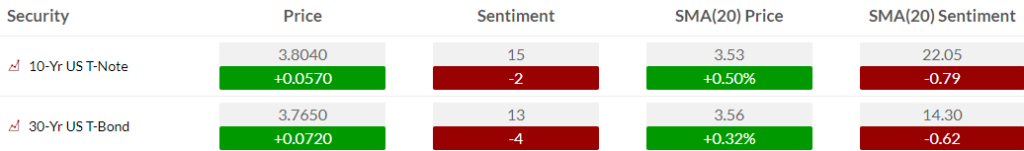
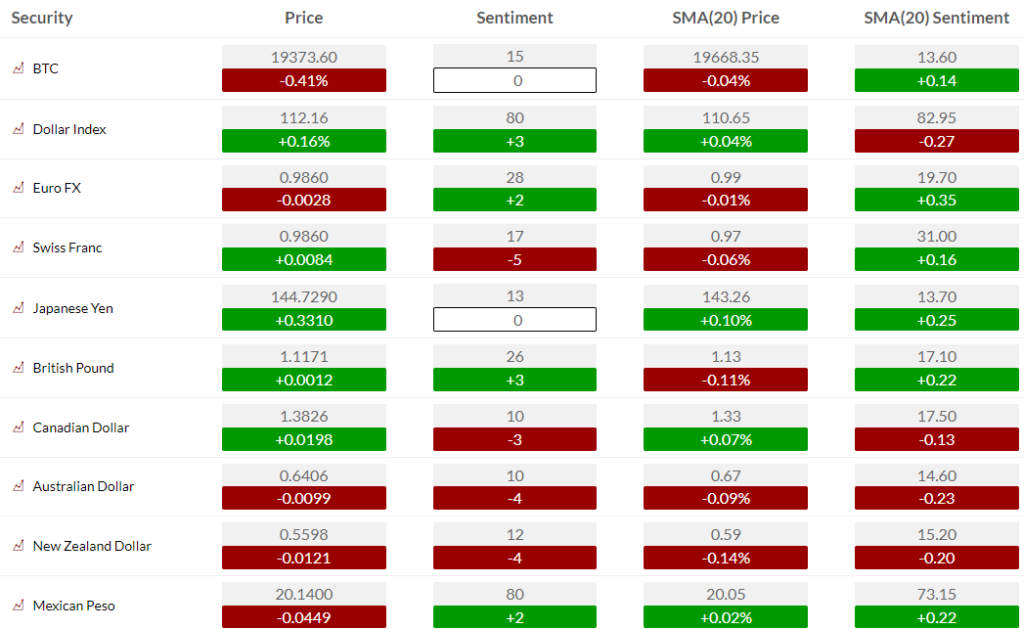
Bond, Currency, and Commodity Bullish Sentiment
Bond bullish sentiment remains depressed in the oversold zone. We could see a decent bounce with todays’ action
Currency bullish sentiment
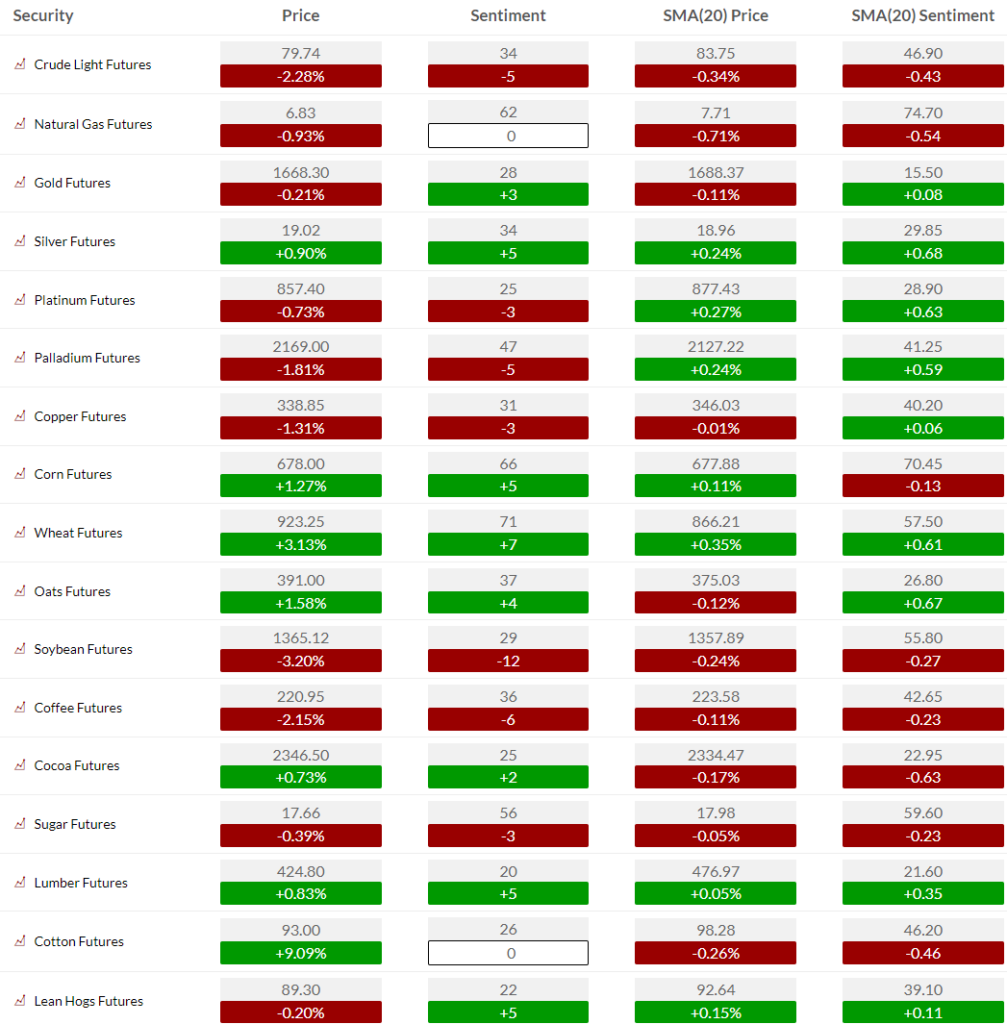
Commodity bullish sentiment
If you have any questions or comments please email us. Data sources: Bloomberg, DeMark Analytics, Goldman Sachs, Street Account, Vital Knowledge, Daily Sentiment Index, and Erlanger Research