
Quick Market Views
Stocks: US equity markets are down small and up from the premarket futures lows. Breadth is moderately weaker. Tech is pausing today after the narrative of rates dropping being stimulative for the sector. Both NVDA and AMD have DeMark exhaustion signals in play. Financials are under stress again, dragging down other sectors like energy, materials, and consumer. The risk to the downside in the markets remains with the S&P cash index with a DeMark Countdown Sequential on the downside in progress and the Nasdaq 100 with a recent Sequential sell Countdown 13.
Bonds: Rates are down across the curve. The 2/10 yield spread is -33bps. I saw a banner ad for Pimco saying, “Bonds are back,” after one of the fastest and strongest bond market rallies I’ve ever seen. The risk of a backup in rates might seem low; however, this would cause the most damage to the markets if that occurs. Is inflation under control? Or is financial stability the paramount priority right now?
Commodities: Energy is down and off the lows. Natural Gas is up 2%, and WTI Crude is down 2% now. Gold is flat. Wheat woke up today and is up 2.5%. I have more thoughts on crude below.
Currencies: The US Dollar Index is up again today, +0.7%. Bitcoin is down 1%.
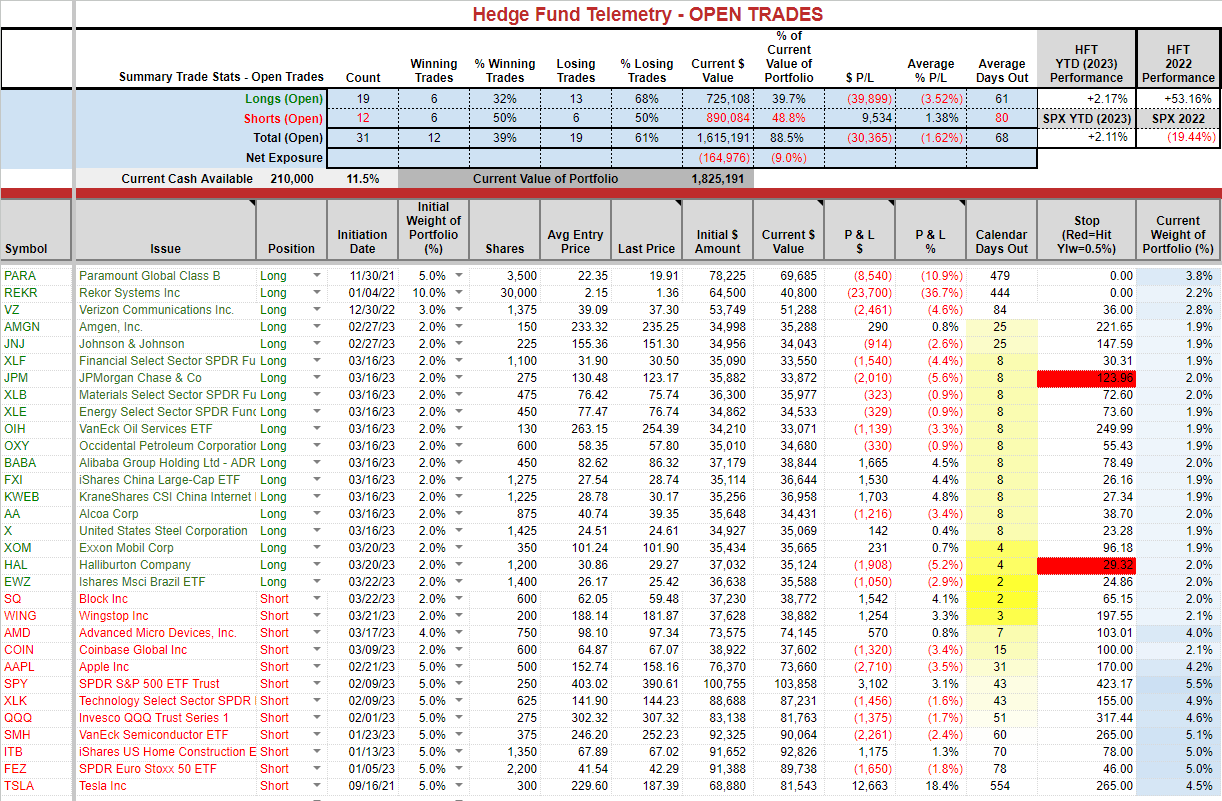
Trade Ideas Sheet: Cutting some long exposure. There is a reason why most longs have had 2% weights. Being able to cut if wrong with nominal loss.
Changes:
- I will sell these 2% sized longs: XLF -4.5%, JPM -5%
- I will also take gains on BABA +5%, FXI +4.5%, KWEB +5.5. I will revisit this as I like this longer-term; however, these will not be spared if markets move lower.
- I will add back a 2% sized short position in NVDA
- I am widening a few stops in energy and materials as I plan on buying more soon.
Thoughts: Several longs are getting hit, which is disappointing, although not unexpected. Shorts are hedging out long declines as the PNL remains steady. Right now that’s about all we can expect.
This will be the last note for today as I am headed into NYC to meet clients and I am on Fox Business at 2:45 ET. Have a great weekend.
US Market Indexes and Sentiment
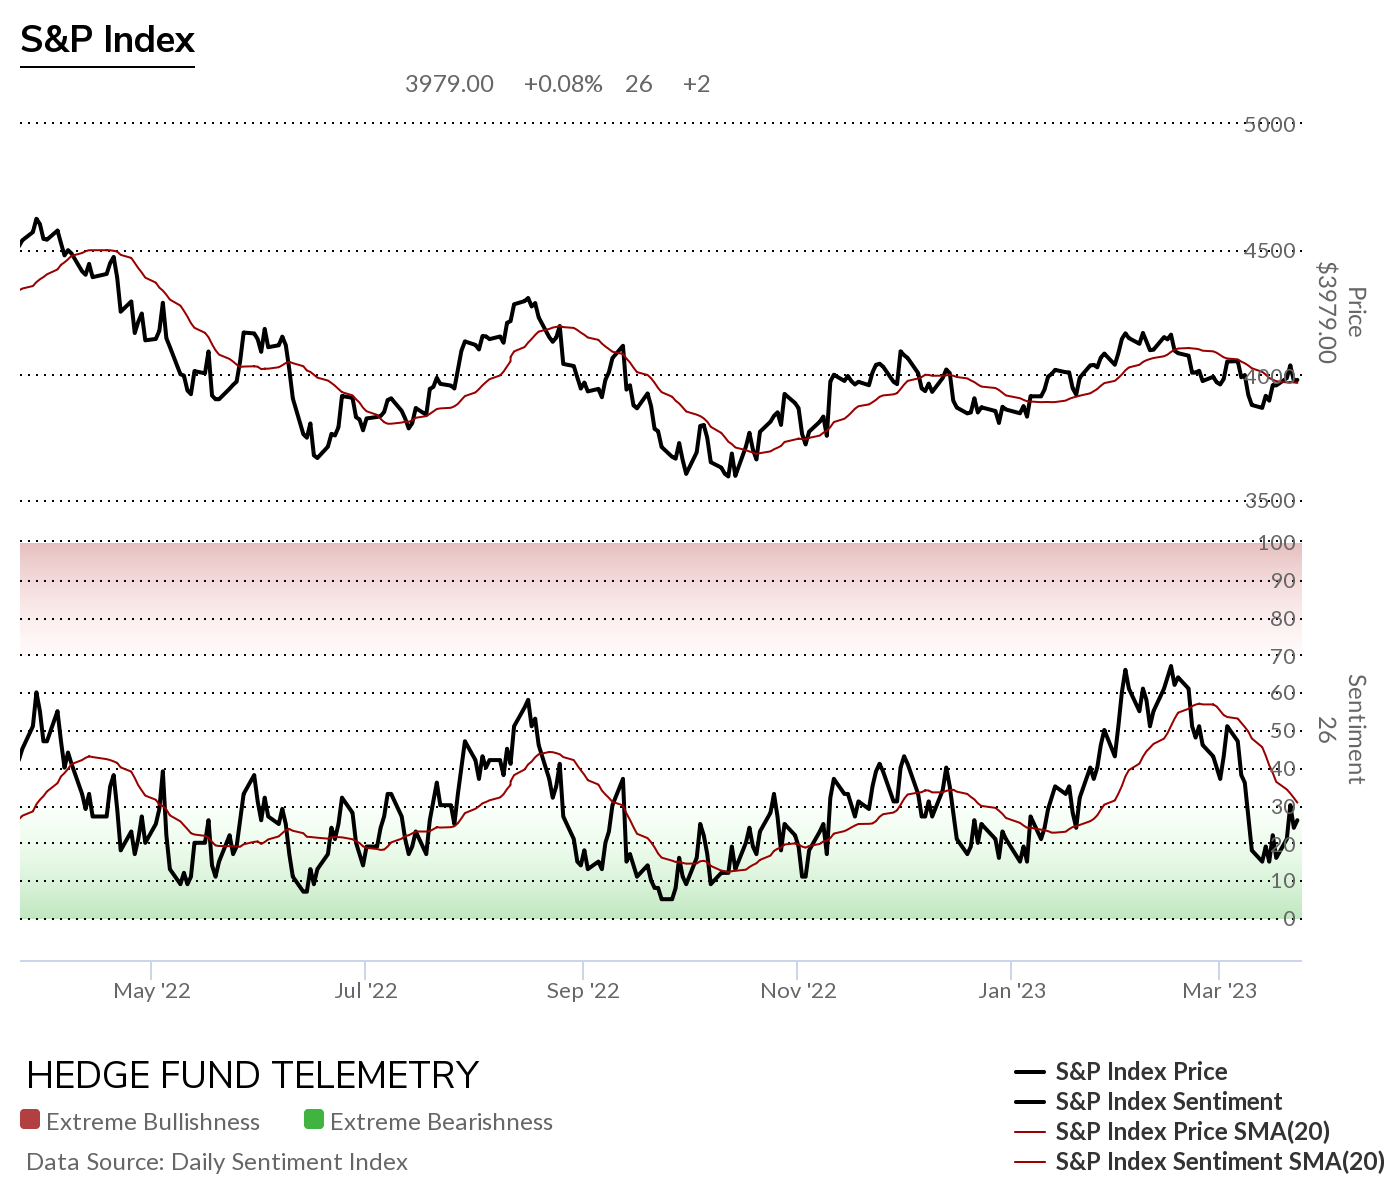
Here is a primer on how we use Daily Sentiment Index charts. Bond, currency, and commodity sentiment are posted on the website.
S&P bullish sentiment and Nasdaq bullish sentiment have rarely been this divergent. Let’s see if the Nasdaq bullish sentiment at 50% midpoint fails in the next week.
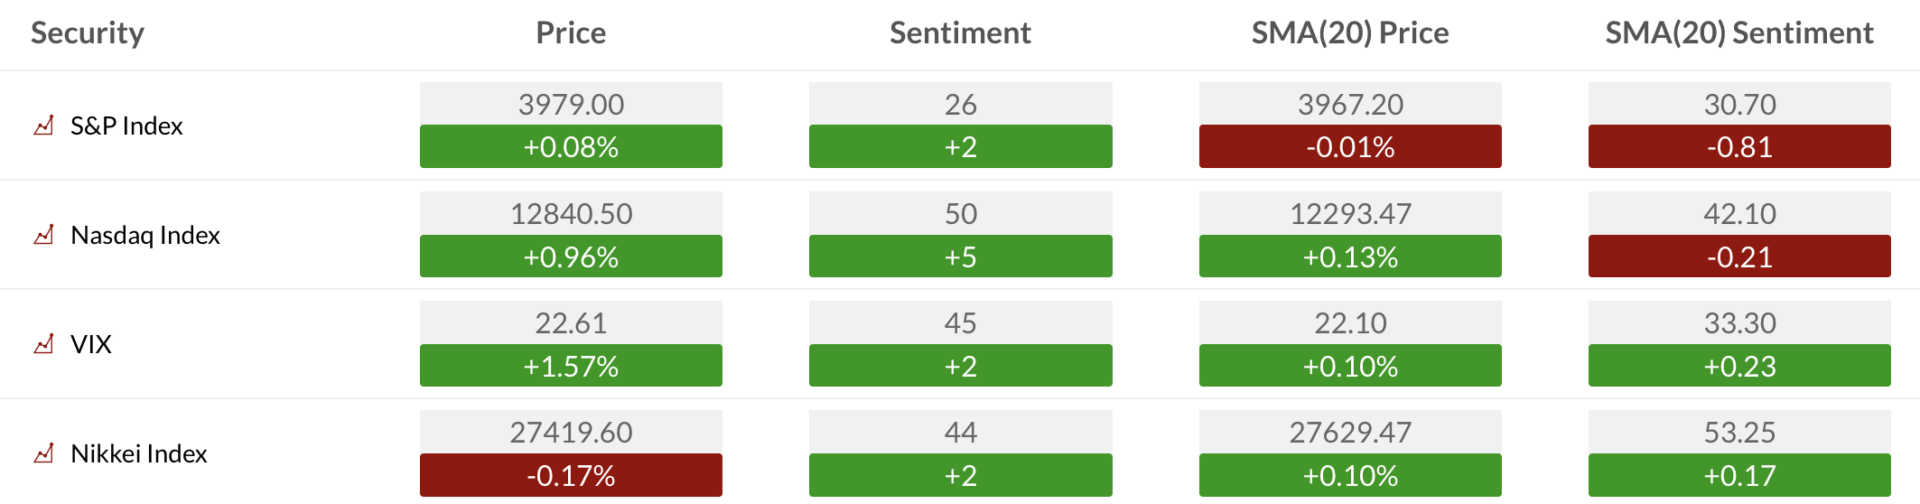
S&P bullish sentiment remains under pressure below the 20 day moving average of bullish sentiment
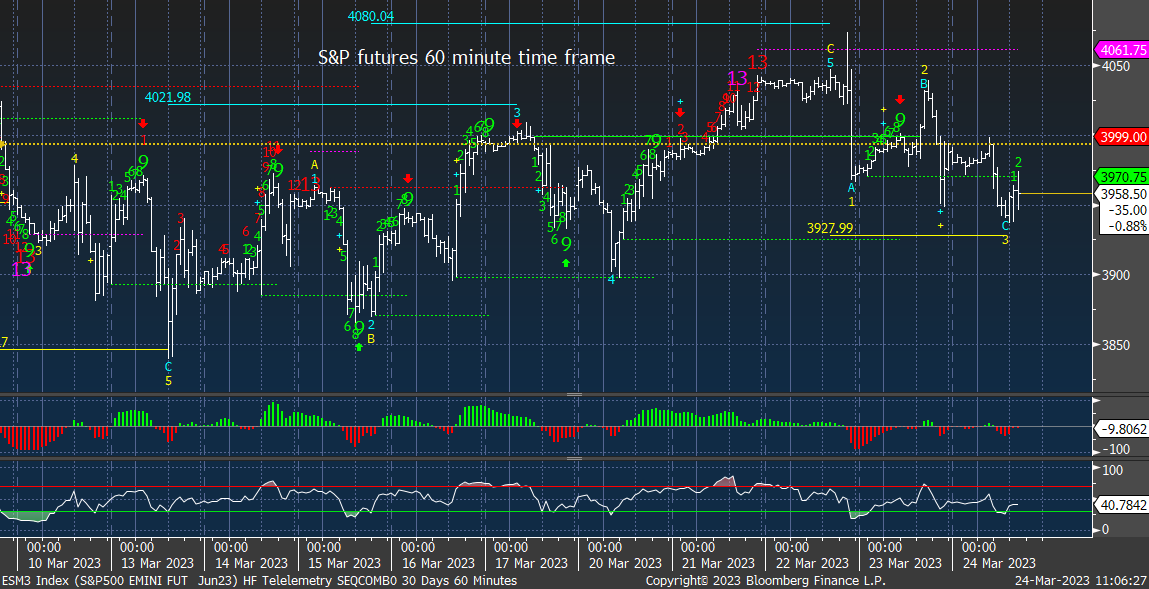
Here is a primer on the DeMark Setup and Sequential indicators.
S&P futures 60-minute time frame
S&P 500 Index daily has support at 3900 (big round number will get a lot of eyeballs watching it) The downside DeMark Sequential Countdown is now on day 8 of 13 with another lower high.
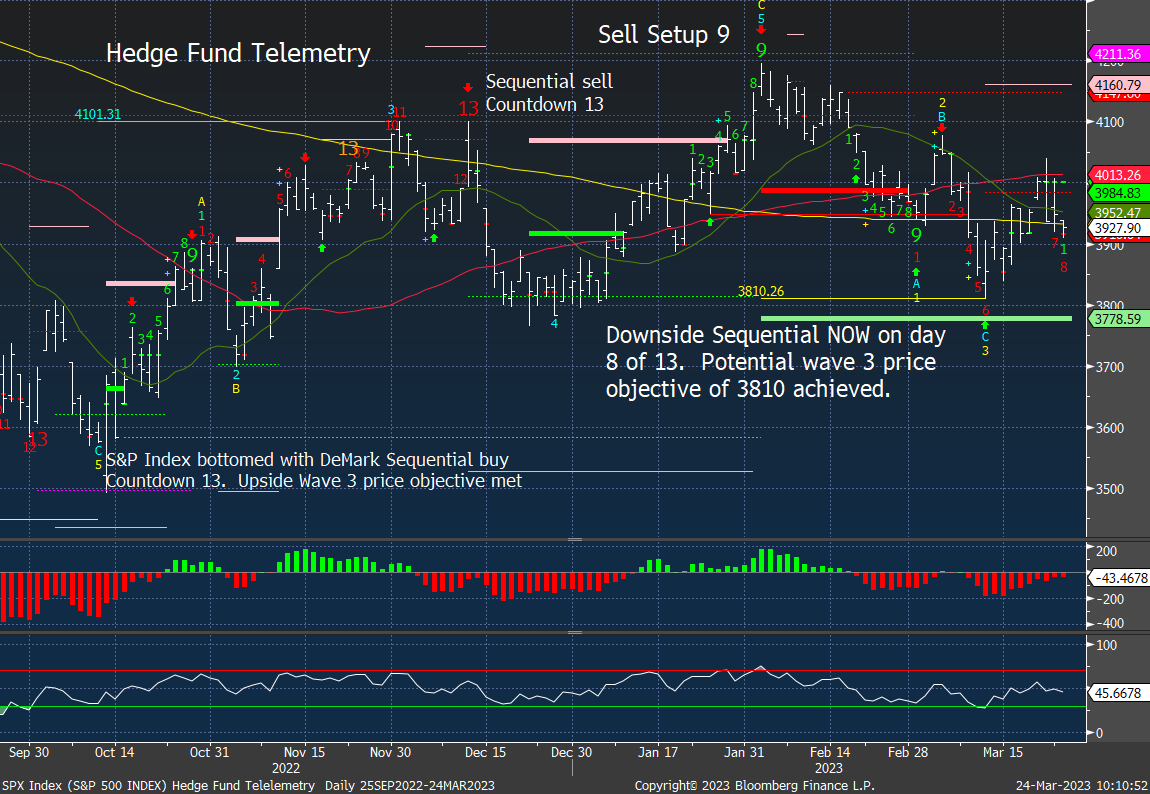
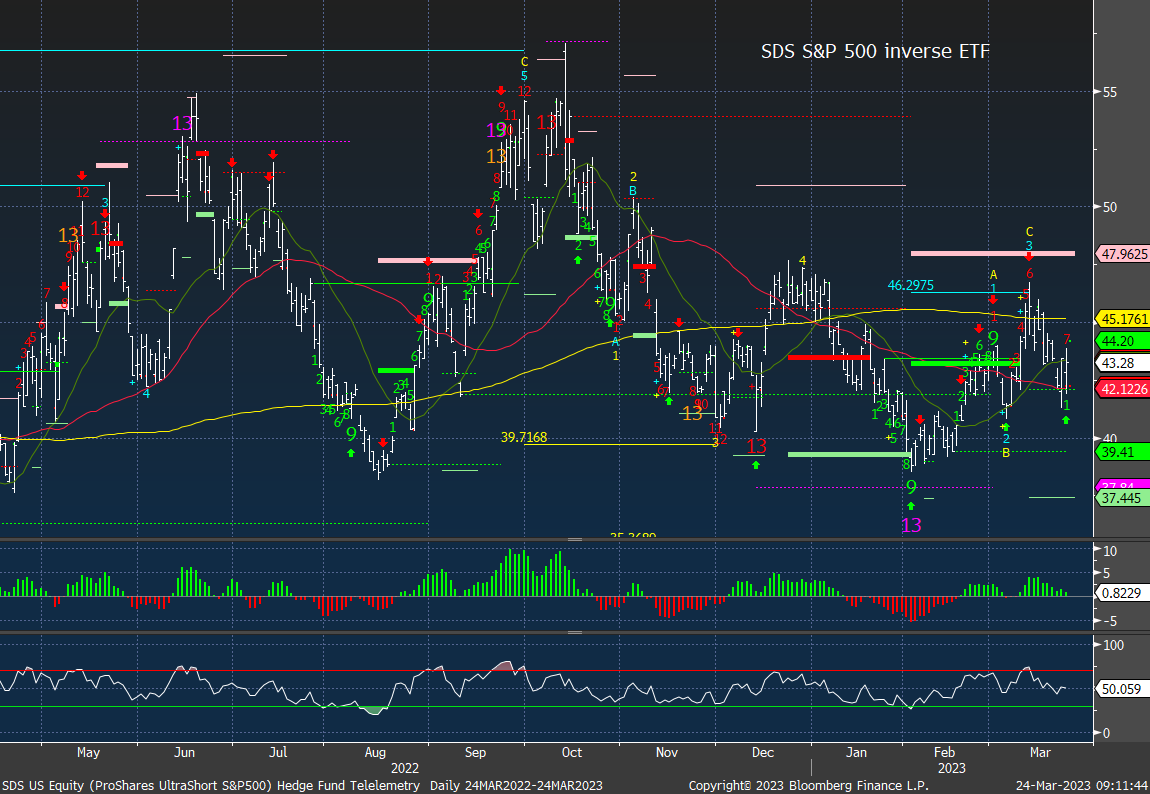
The inverse S&P ETF is on day 7 of 13 with the Sequential.
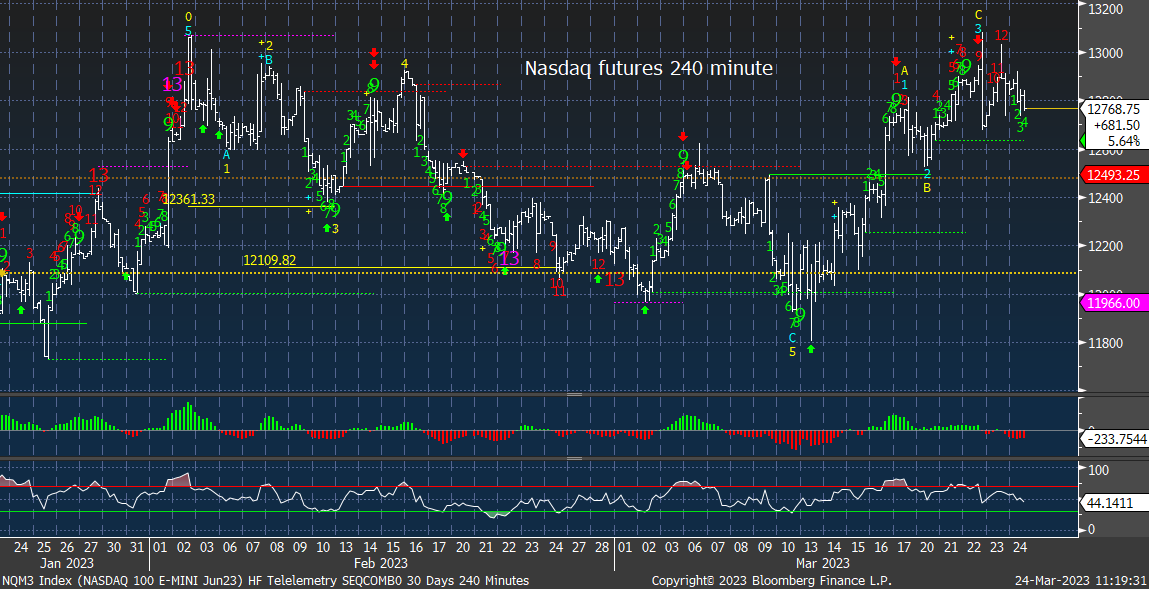
Nasdaq 100 futures 240-minute time frame nearly qualified the upside DeMark Sequential sell Countdown 13. The 240-minute time frame has less frequent Countdown 13’s however, they have been very effective for buy and sell signals
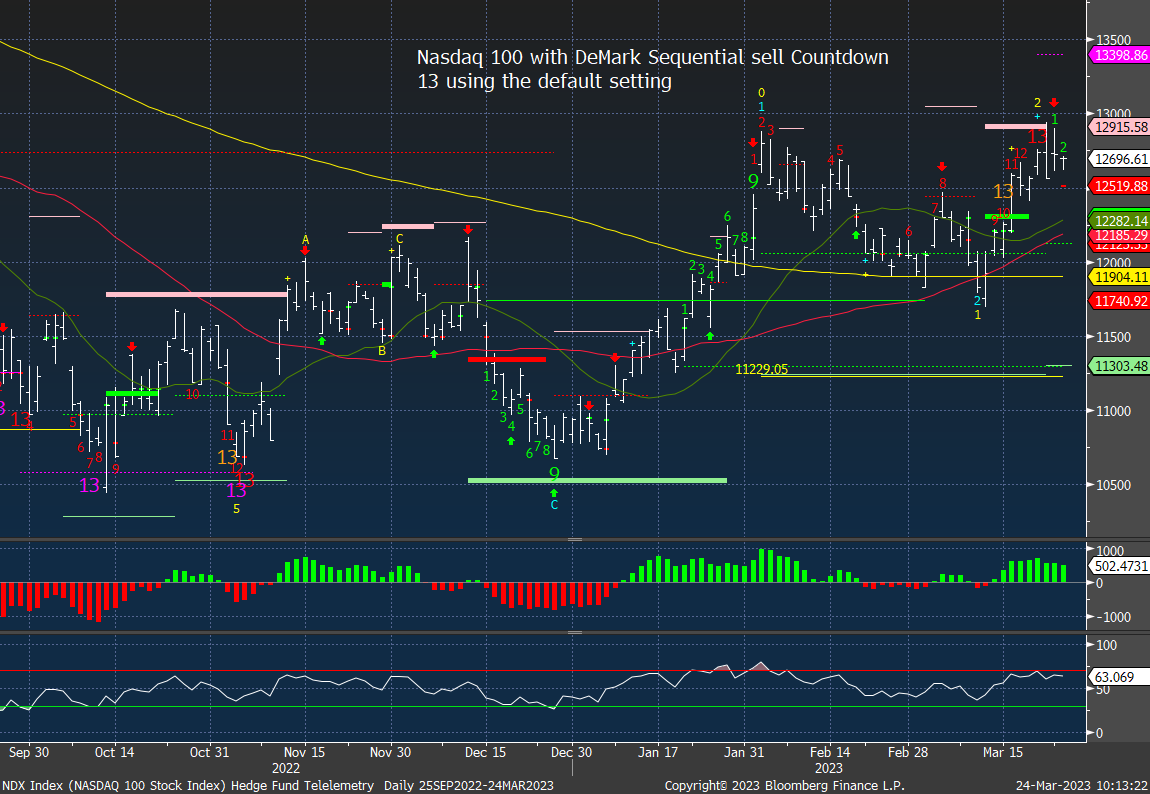
Nasdaq 100 Index daily with new DeMark Sequential sell Countdown 13 in play. A break of 12,500 would add to conviction for a lower move.
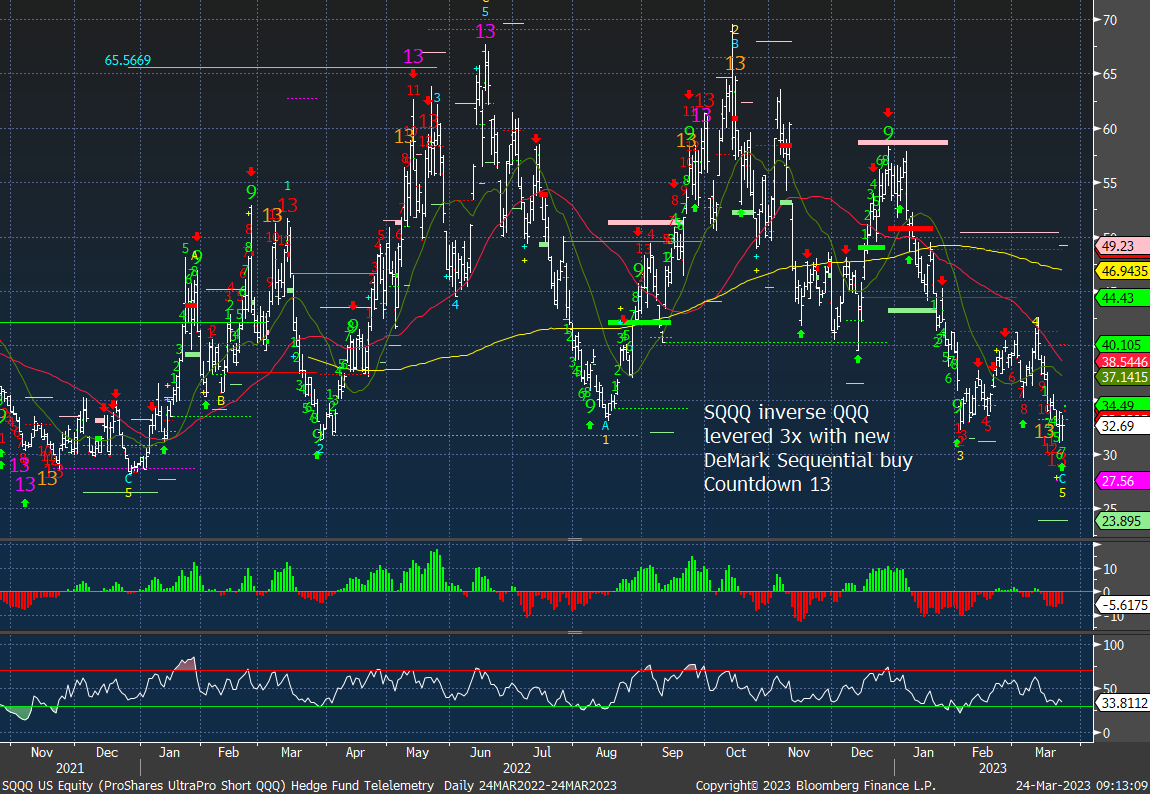
SQQQ inverse NDX QQQ with a recent DeMark buy Countdown 13
Trade Ideas Sheet
Pre changes
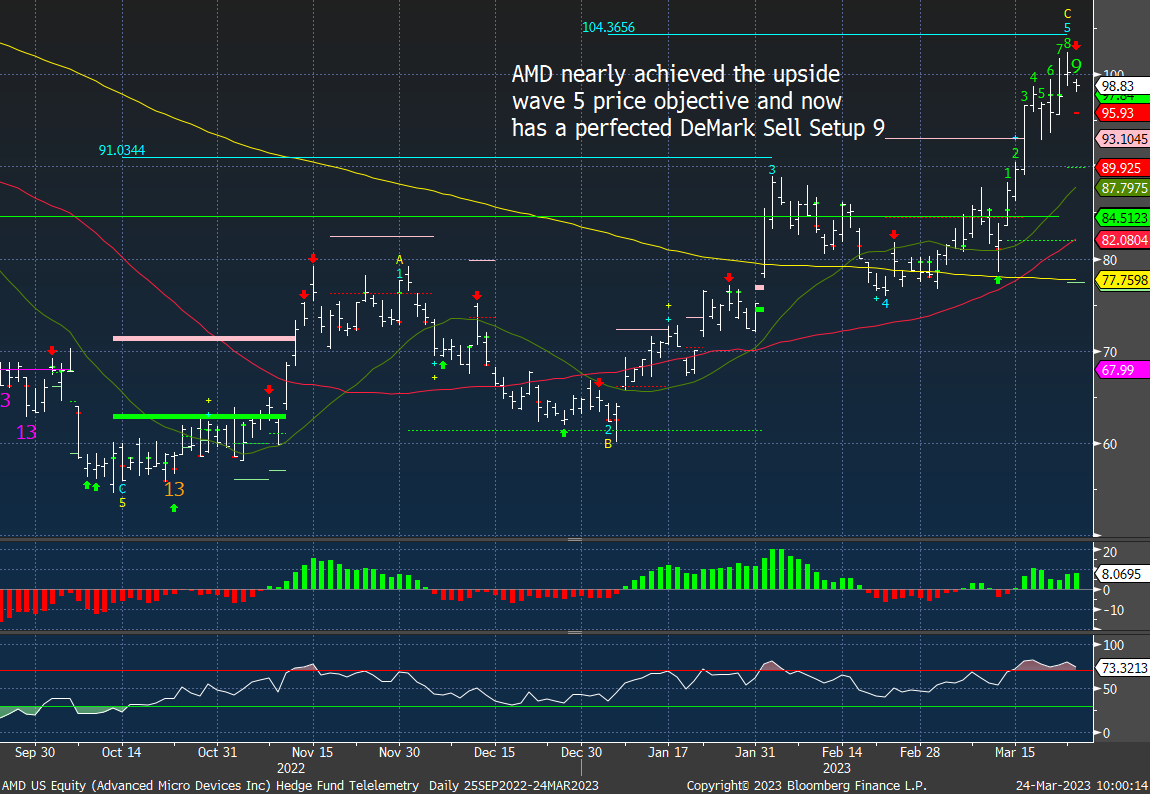
Two of the poster children for the tech rally AMD and NVDA should pull back at these levels with the new DeMark exhaustion signals.
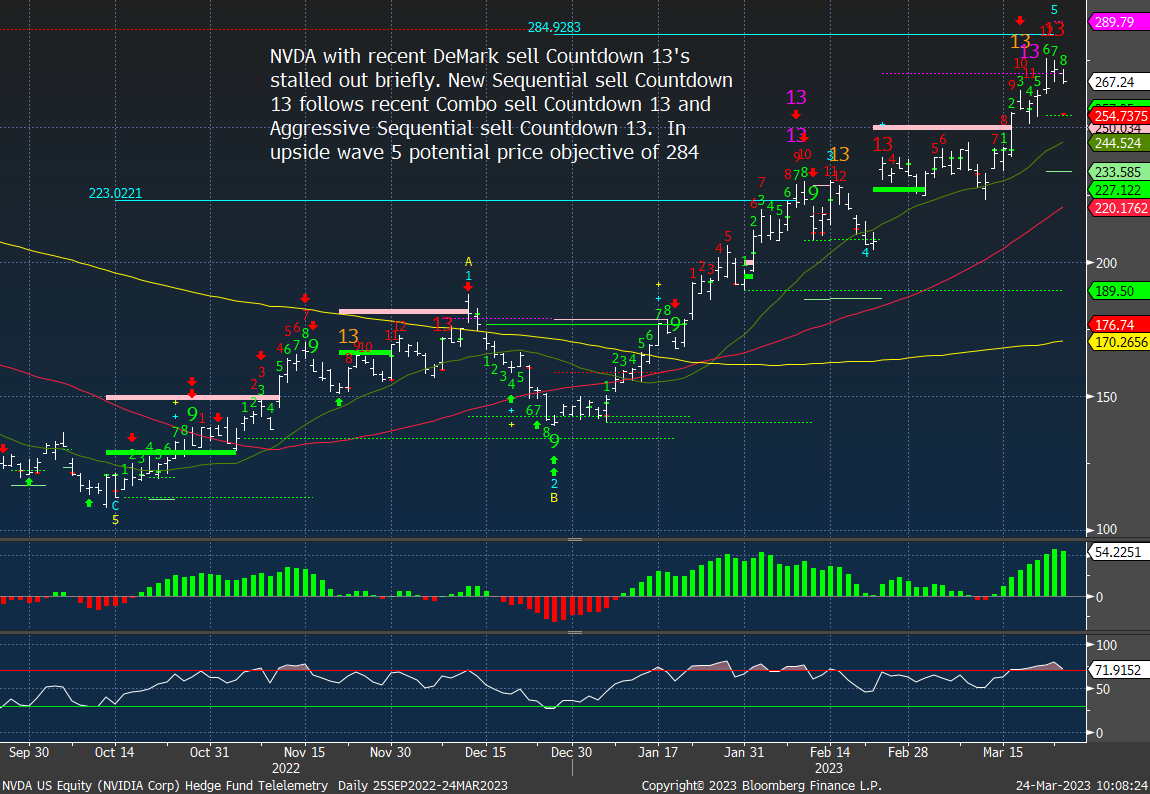
NVDA with recent Sequential Sell Countdown 13. Previous Sequentials pulled back or stalled. Now in upside final wave 5. I am adding back a 2% short position.
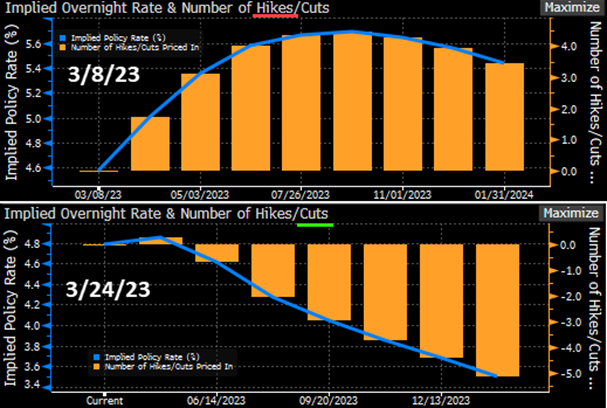
Fed capitulation?
Here are a couple of charts and thoughts from Charlie McElligott from Nomura: “Cumulatively, this is not only adding to the increased market pricing of an accelerated Fed policy capitulation from TIGHTENING to EASING, but even going so far as to price small delta of an April INTERMEETING CUT from the Fed, while I can kinda back into a May FF pricing which looks a bit like ~50% “Pause,” 35% “Hike 25bps” and 15% “Cut 50bps”
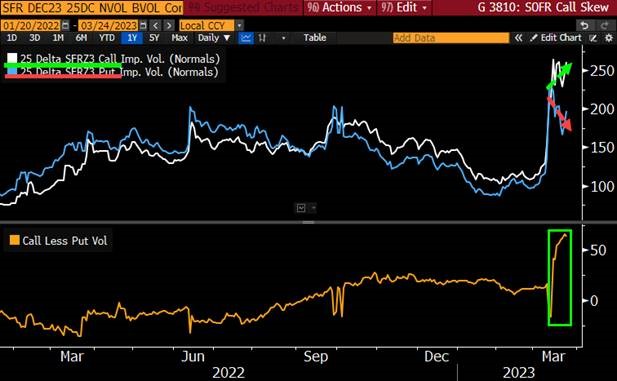
SOFR Dec23 Skew shows the incessant demand into UPSIDE (bets on lower interest rates / yields down), as the Call iVol vs Put iVol spread blows out
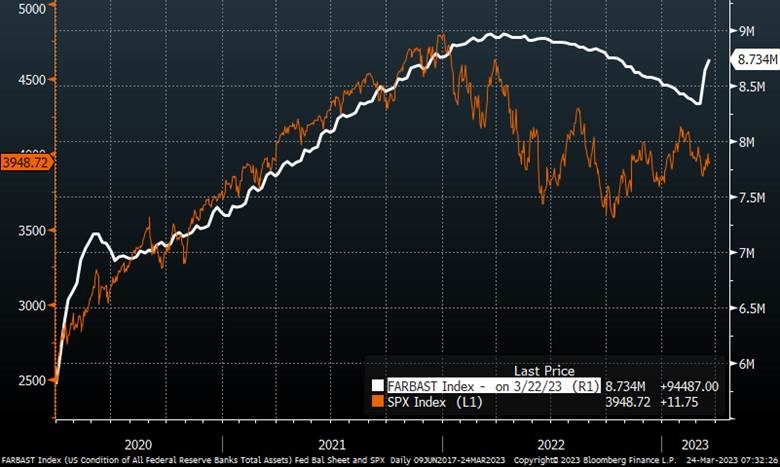
The Fed has reversed 2/3 of QT on the banking crisis. The Fed’s balance sheet increased for a second week by another $100b (8.783t from 8.689t week prior). They continued trimming securities held outright (QT), while increasing their loans/repos outstanding – SPX to follow? (ht Dave Lutz)
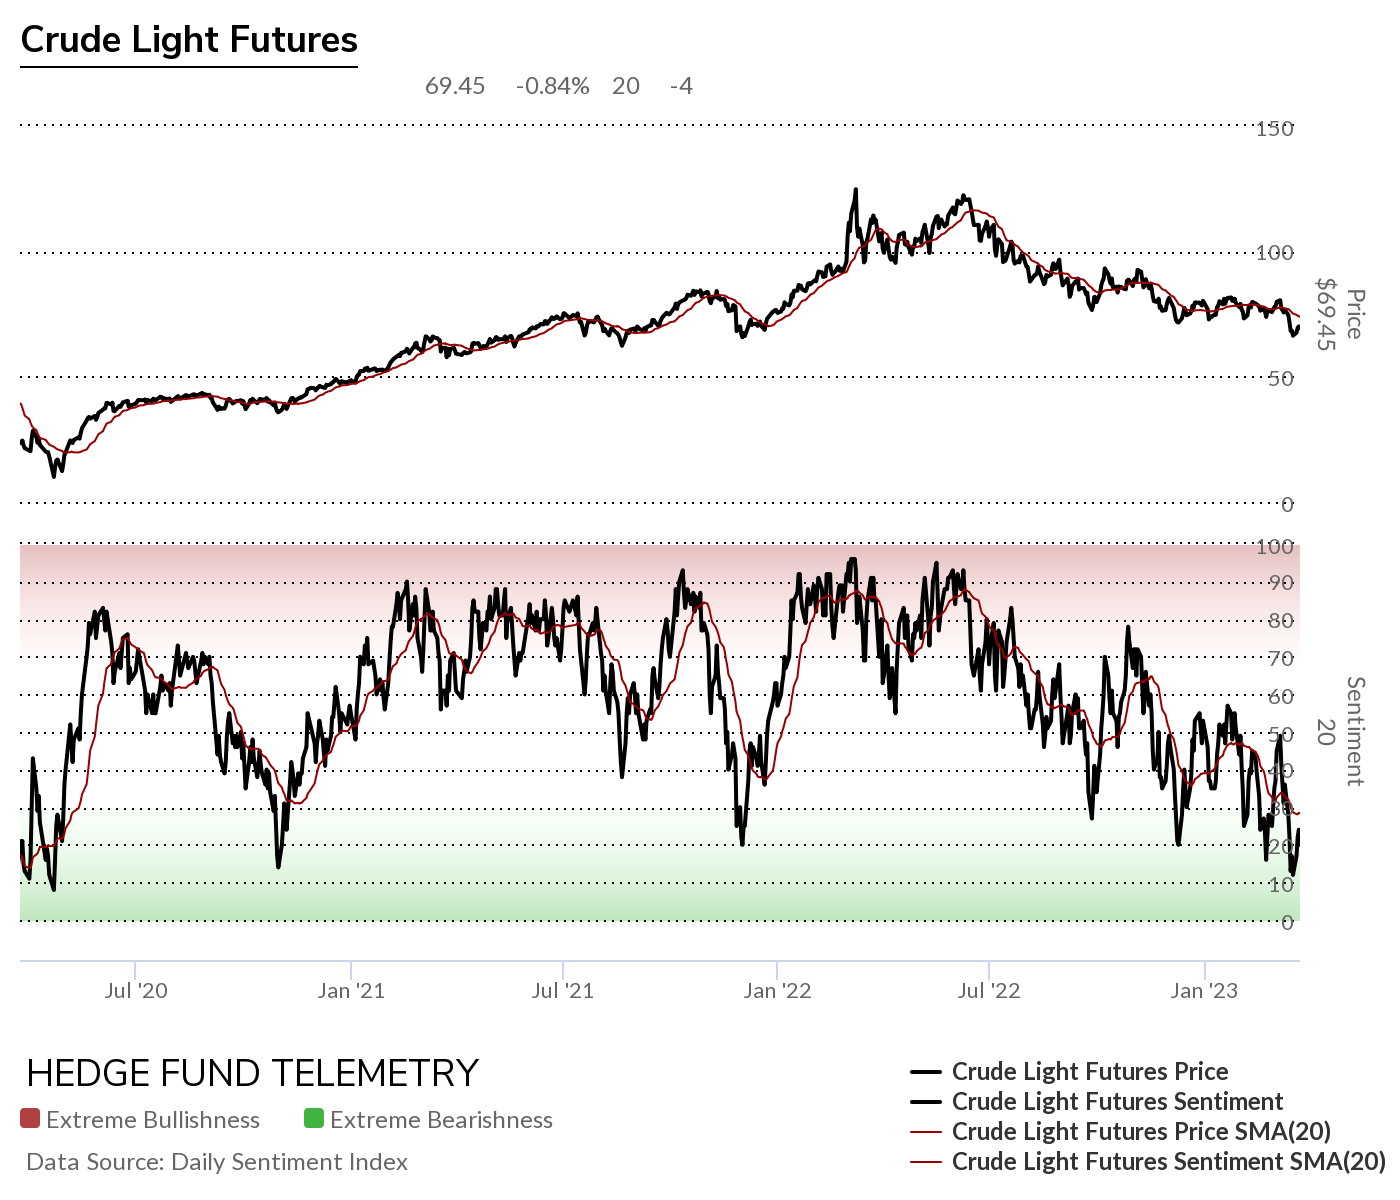
Crude thoughts
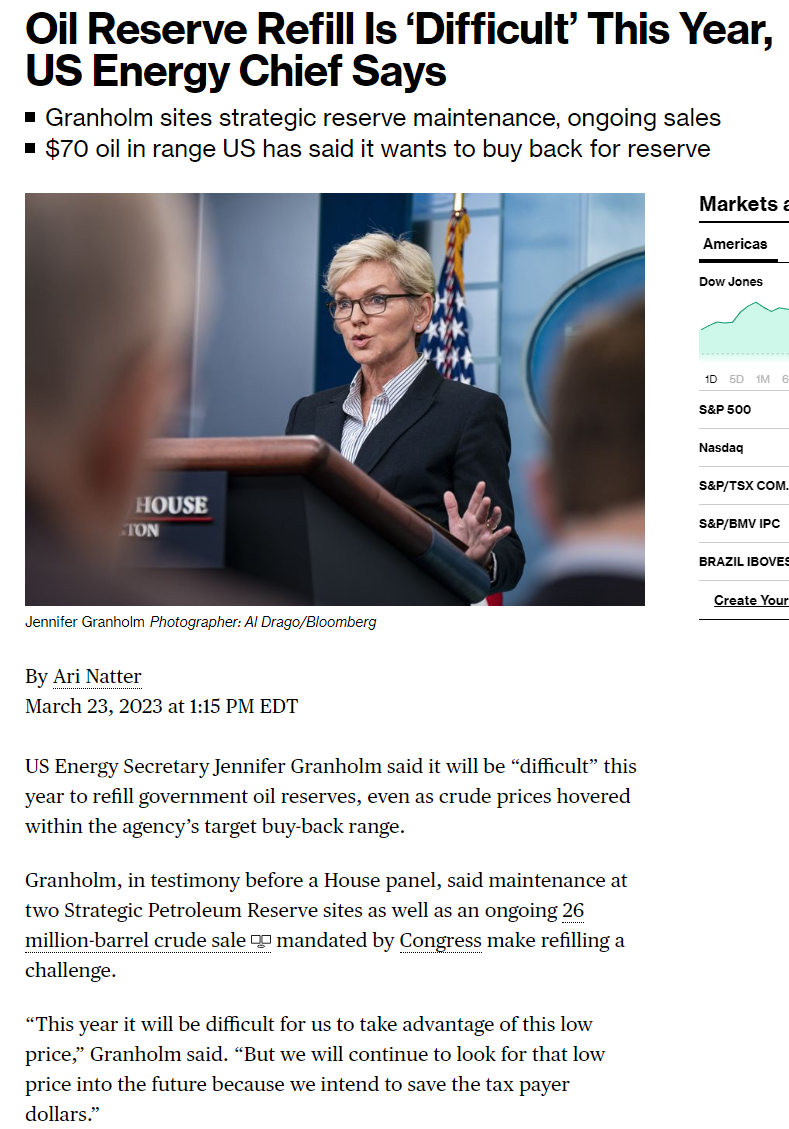
Where would inflation be today if the US Government didn’t drain half of the strategic oil reserve? It was asked several times if this was a political move and quickly denied. Ya right. It worked, however, as gasoline prices are lower, which is the main inflationary trigger point for the public. The Secretary of Energy is now saying it will be “difficult this year” to refill the SPR even if crude is under $70, the target zone. The current administration will probably leave this to the next President to refill the SPR. If the administration were smart and thinking politically, they would start to refill in 2023 because doing it next year during a Presidential campaign would be in my view, more “difficult.” Let’s never forget the Secretary of Energy on Bloomberg TV.
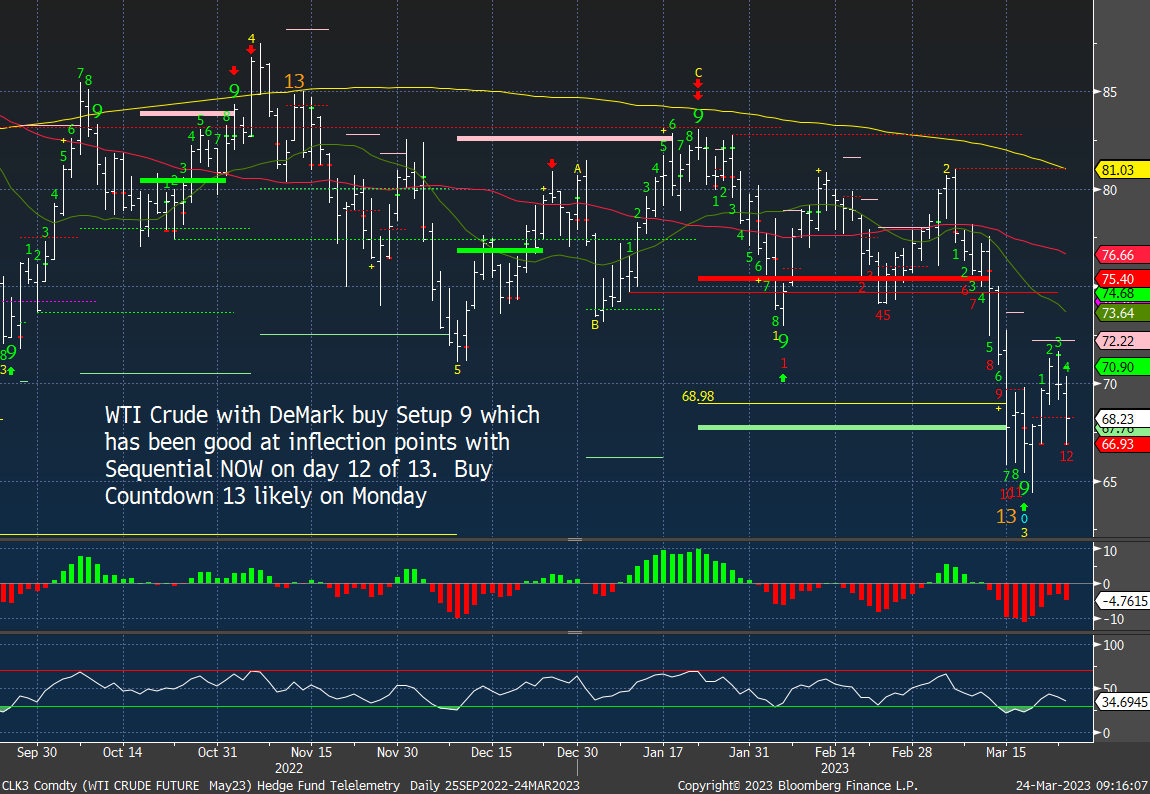
WTI Crude is on day 12 of 13 with the DeMark Sequential Countdown. This will qualify the buy Countdown 13 Monday if the price is less than or equal to the close of the 8th bar (should be easy), and the normal pattern of the 13th bar must be less than or equal to the low of two earlier bars.
Crude bullish sentiment has moved down under 20% several times in the last 3 years. I can’t say this will V bottom like the other times however it’s oversold enough for a near-term bounce.
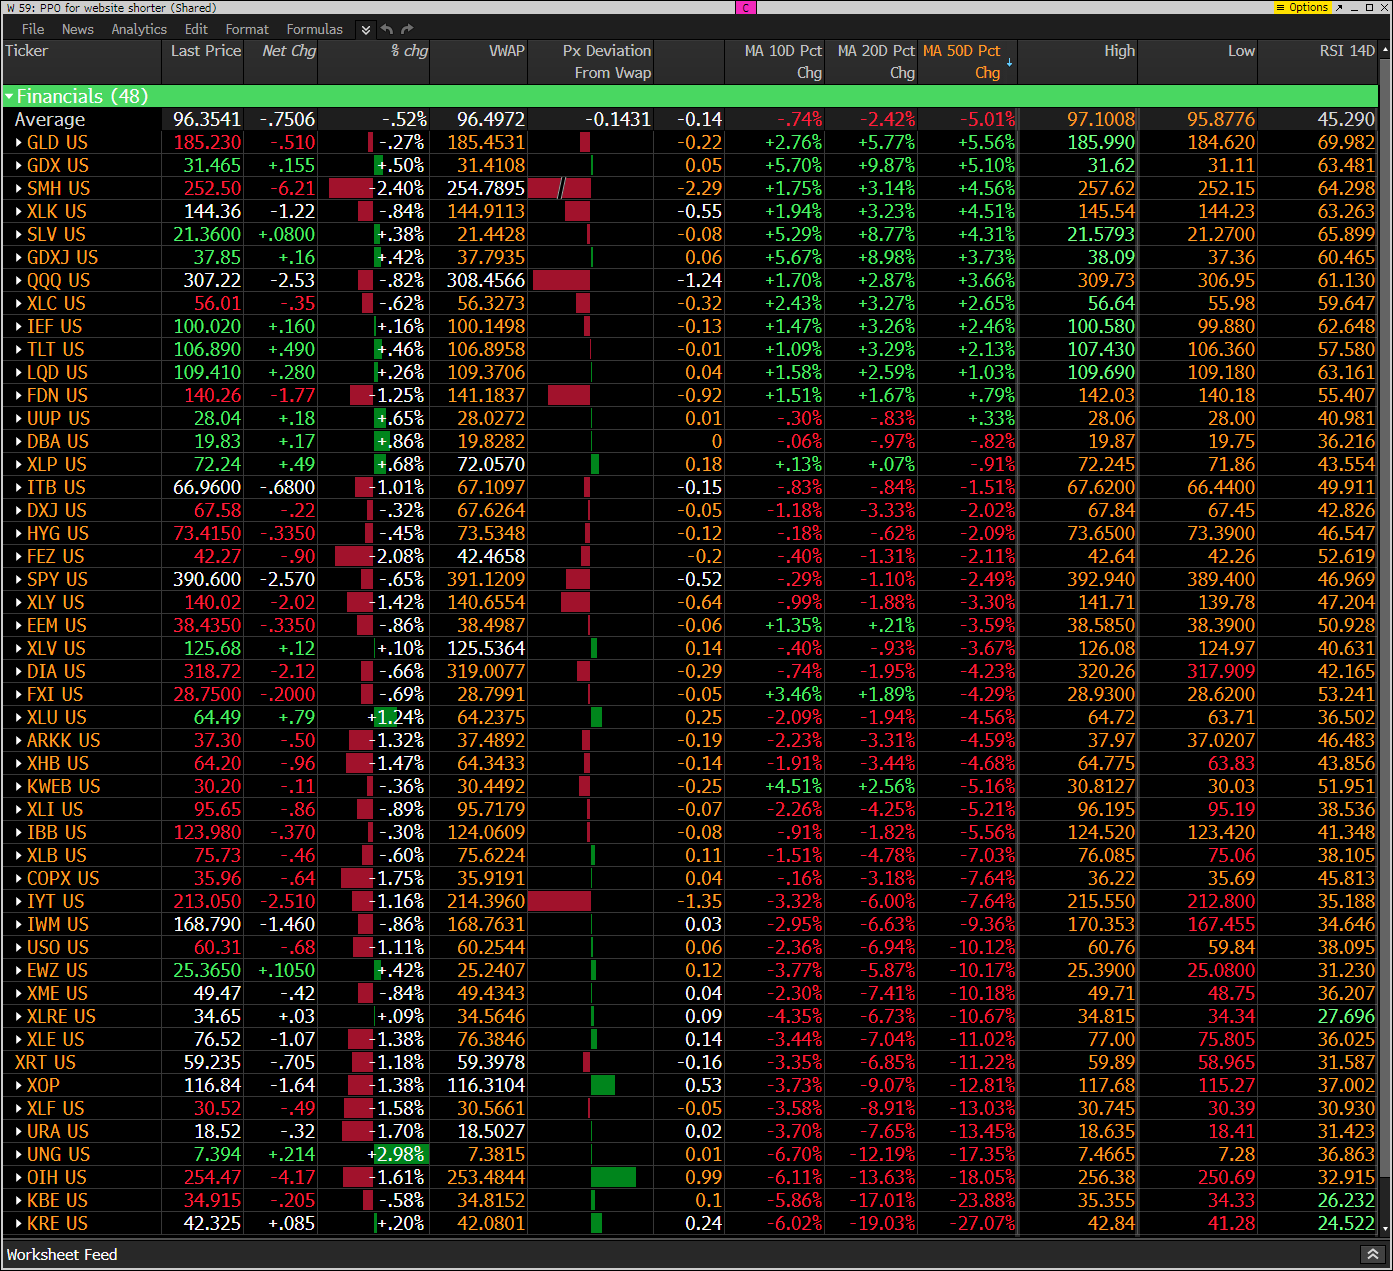
Hedge Fund Telemetry ETF Percentage Price Oscillator Monitor
The PPO monitor (percentage price oscillator) force ranks ETFs by percentage above/below the 50-day moving average. For information on this monitor, please refer to this primer. This monitor is offered to Hedge Fund Telemetry subscribers who are on Bloomberg. Mostly a weak day combined with many under today’s VWAP support levels.
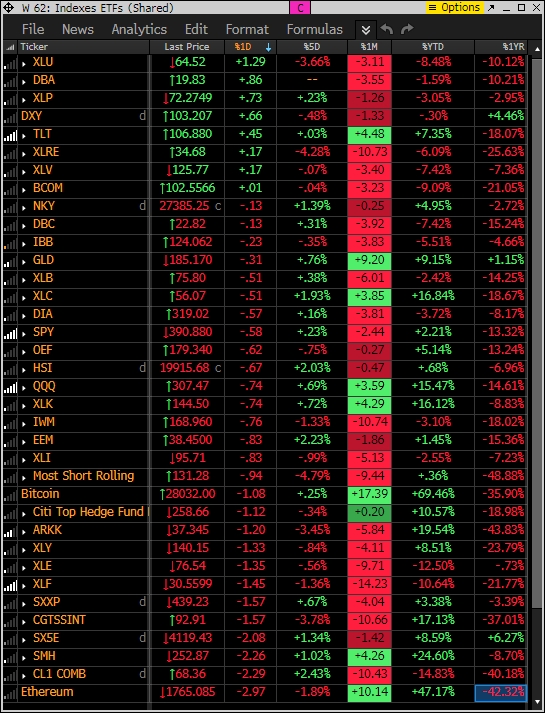
Index ETF and select factor performance
This ranks today’s performance with 5-day, 1-month, and 1-year rolling performance YTD. Defensive strength today.
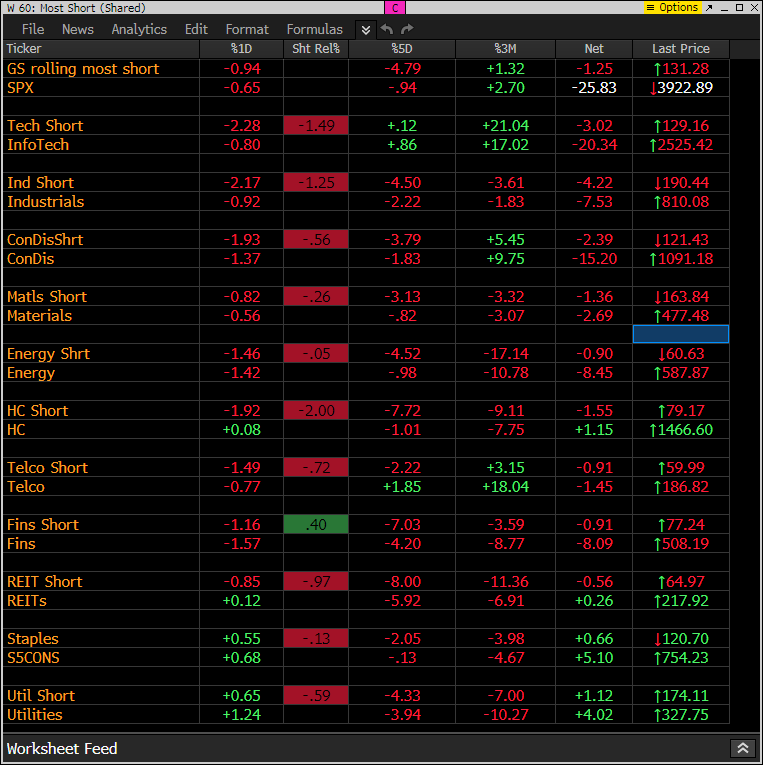
Goldman Sachs Most Shorted baskets vs. S&P Indexes
This monitor has the S&P indexes and the Goldman Sachs most shorted baskets. Shorts are making money today with a clear bid to defensive sectors staples and utilities.
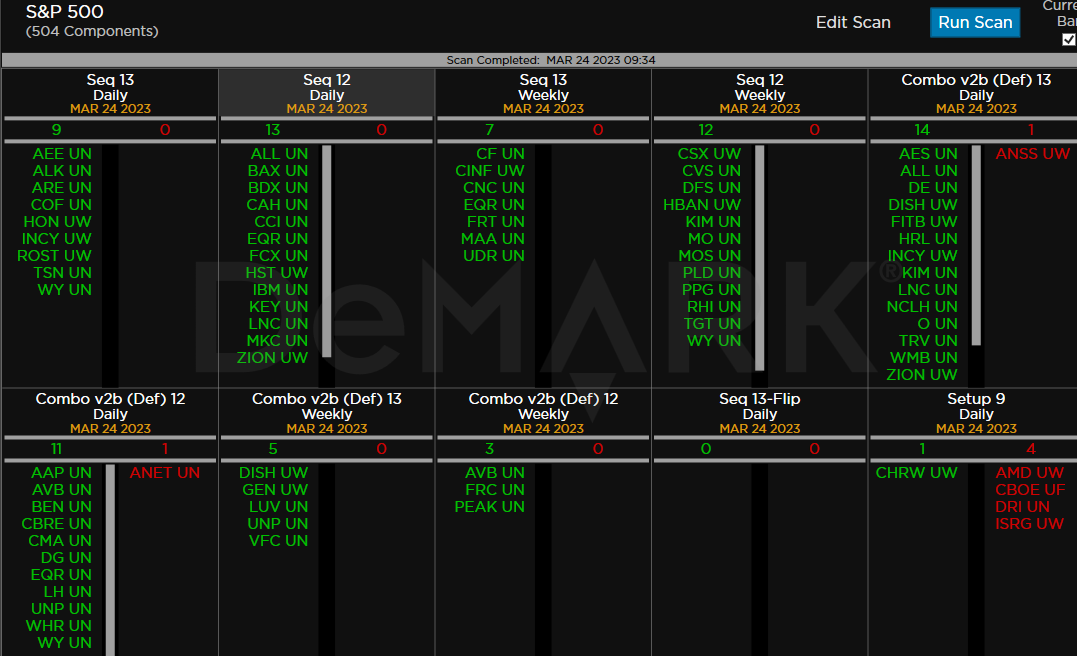
DeMark Observations
Within the S&P the DeMark Sequential and Combo Countdown 13s and 12/13s on daily and weekly periods. Please refer to this primer for information on how to use the DeMark Observations. The extra letters at the end of the symbols are just a Bloomberg thing. Worth noting: We are starting to see larger numbers of buy Countdown 13’s develop that doesn’t mean we have bottomed as I want to see
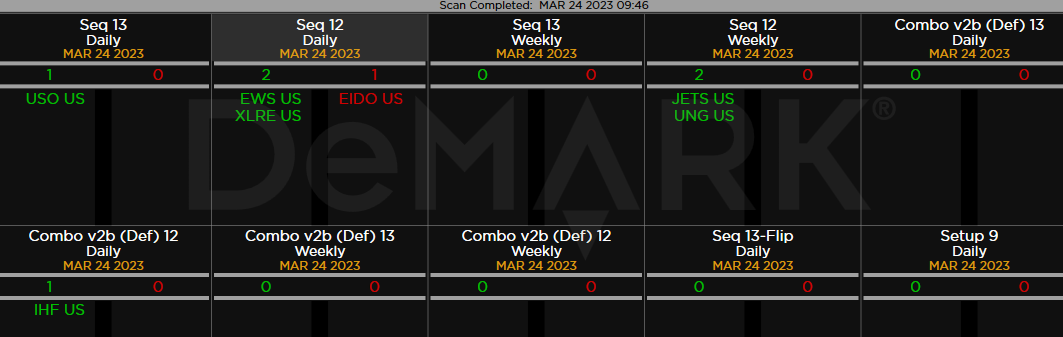
Major ETFs among a 160+ ETF universe. USO Crude ETF with DeMark Sequential buy Countdown 13
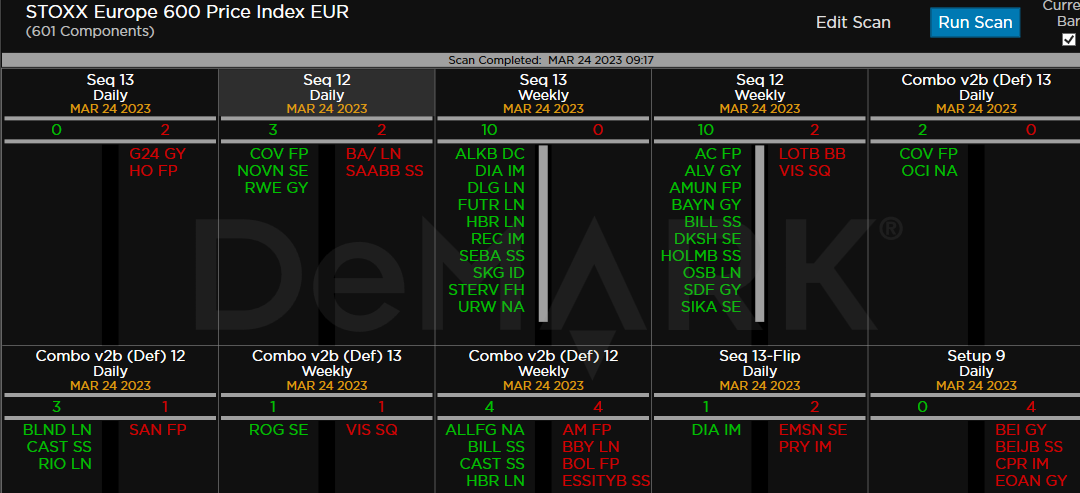
Euro Stoxx 600
If you have any questions or comments, please email us. Data sources: Bloomberg, DeMark Analytics, Goldman Sachs, Street Account, Vital Knowledge, Daily Sentiment Index, and Erlanger Research