
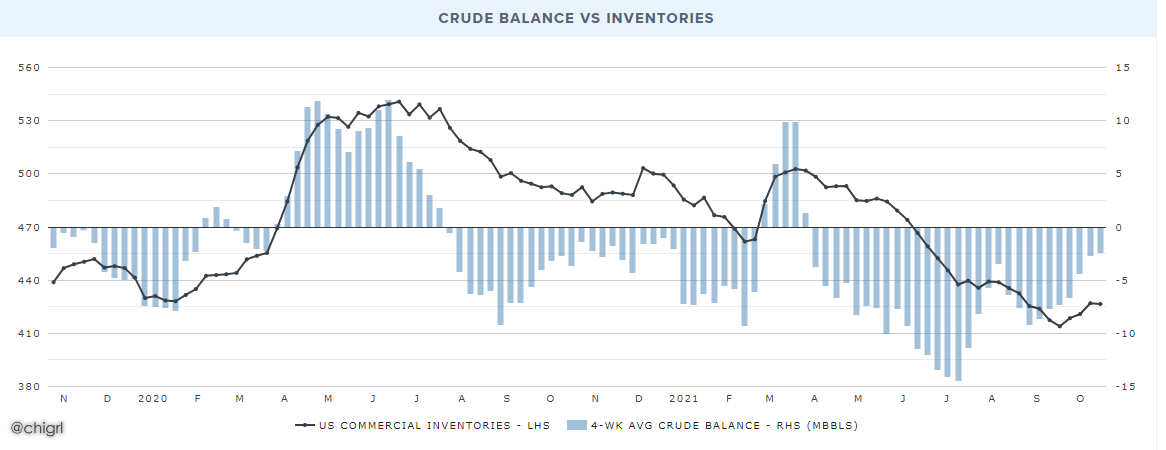
Crude: -0.431M
Cushing: -2.320M
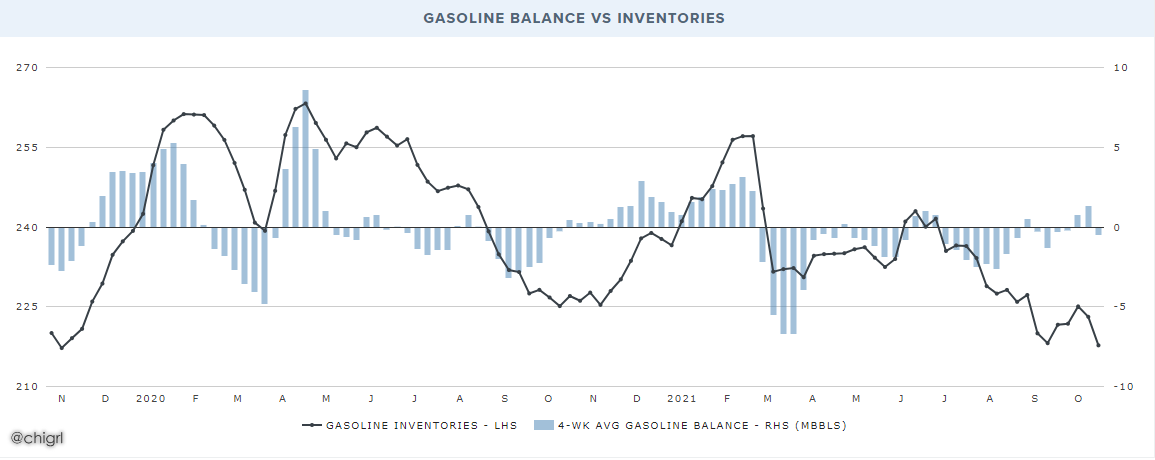
Gasoline: -5.368M
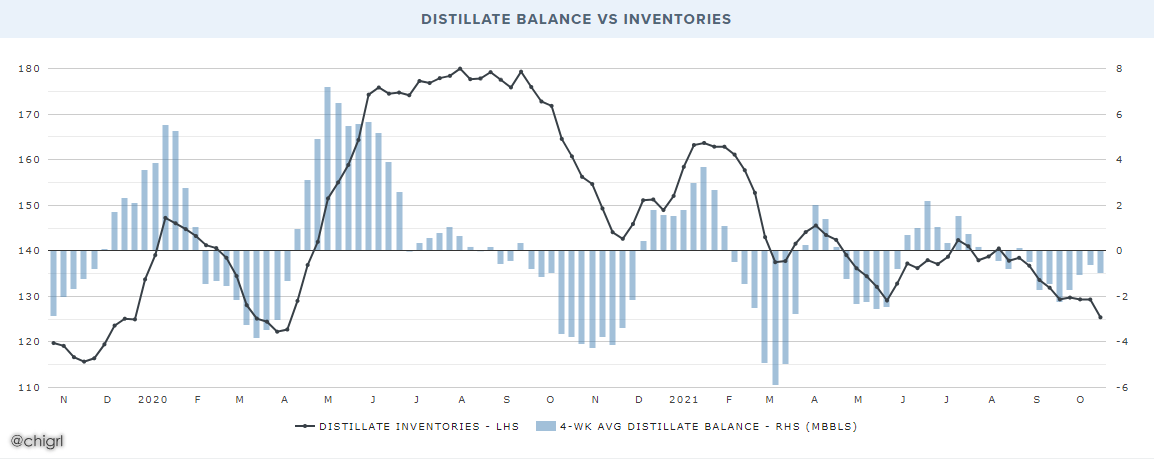
Distillates: -3.913M
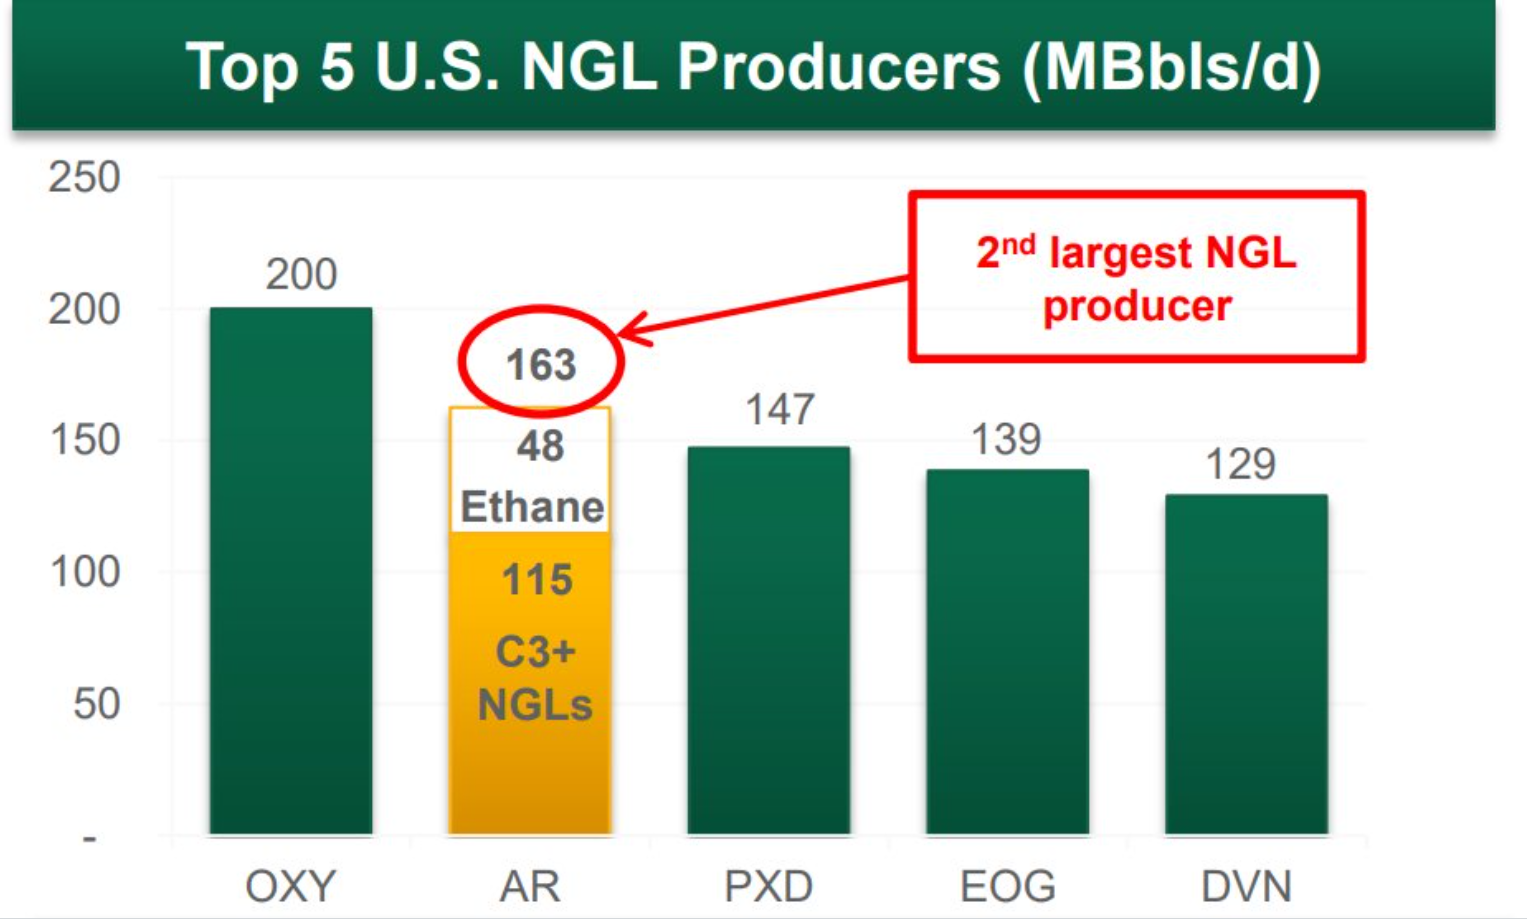
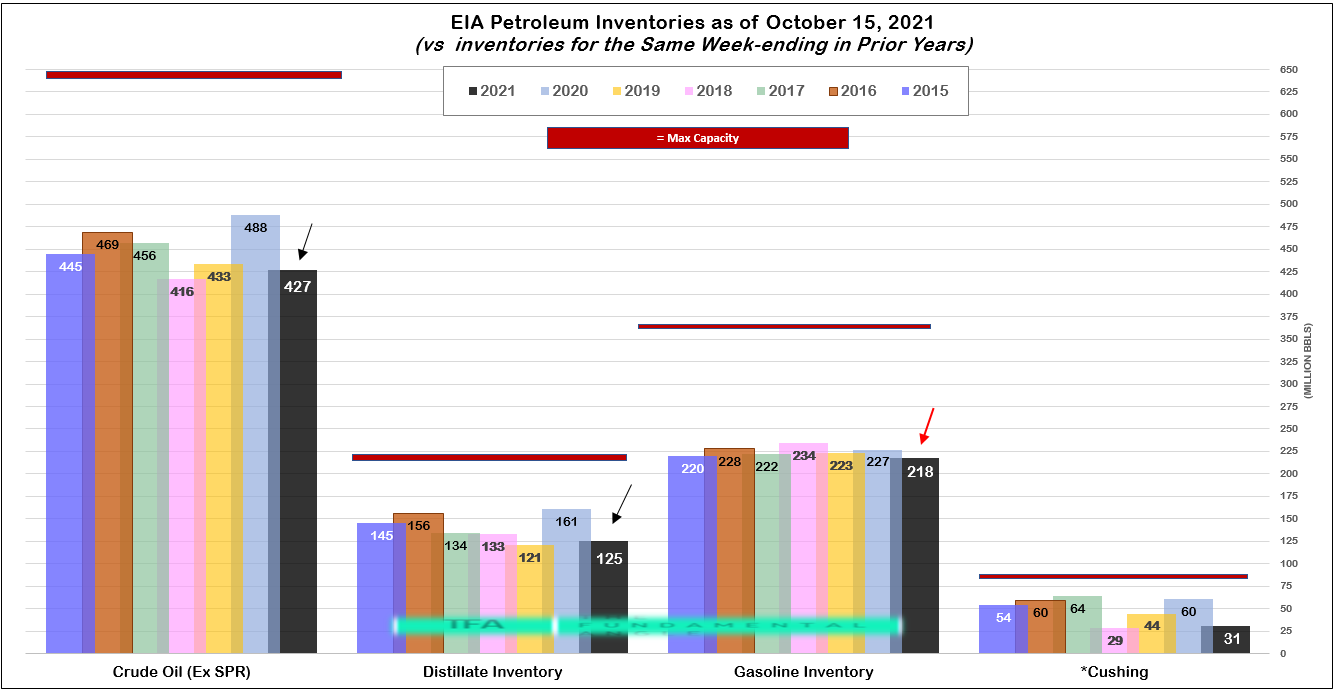
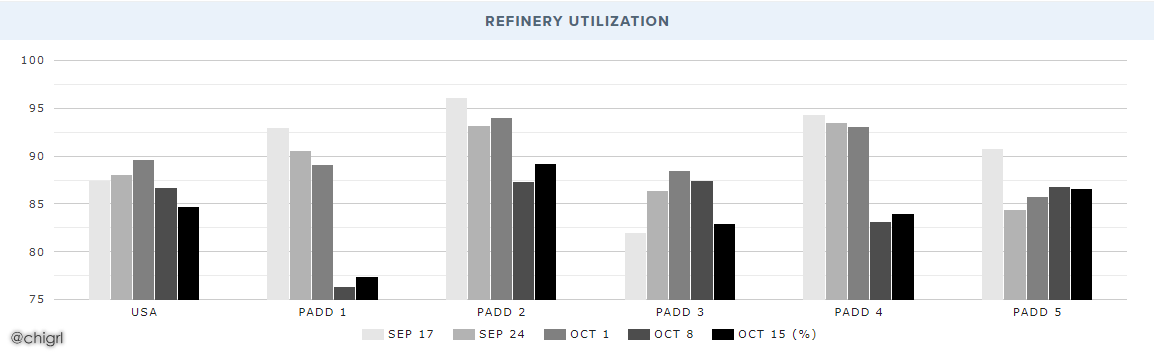
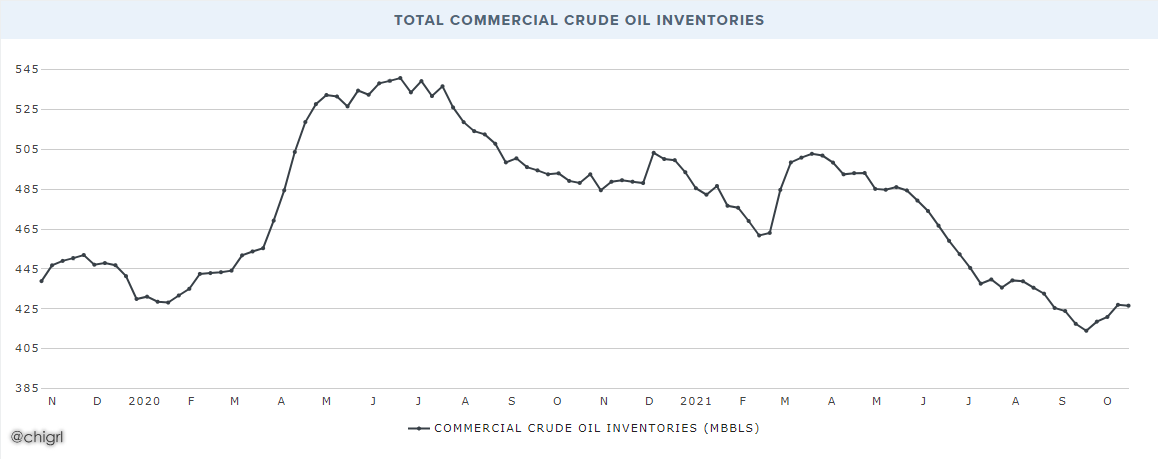
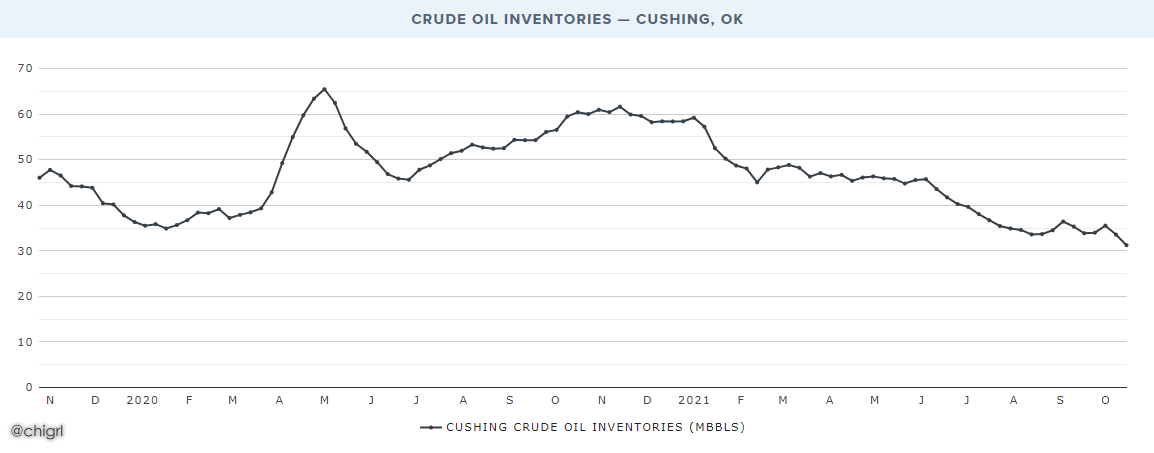
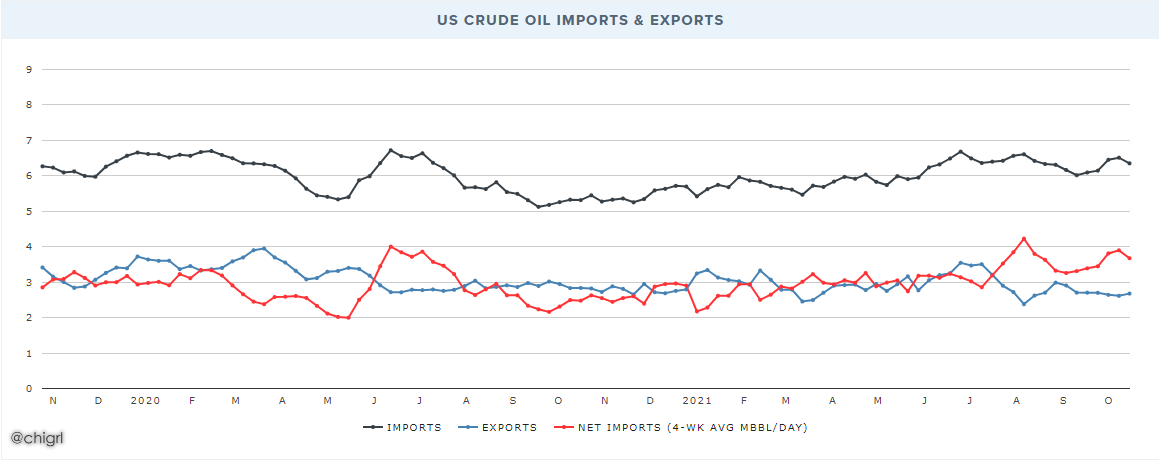
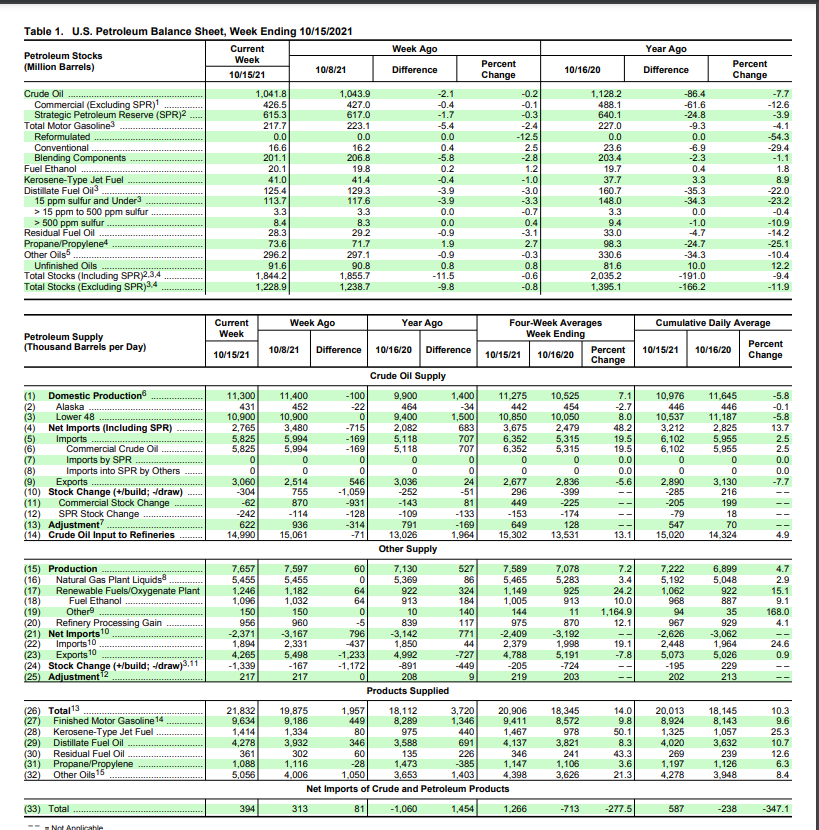
Nice report this week! Small draw this week. Imports were down -16K bpd (1.183M barrels on the week) over last week and exports were up 546K bpd over last week ( 3.822N barrels on the week). EIA showed a production decrease of -100K bpd over last week, to be honest, their stated 11.3M bpd seems too high, we will find out in the monthly report which is more accurate for production. We had another SPR release of 1.694 barrels that were taken out of the reserve and added into commercial crude stocks. At 426.5 million barrels, U.S. crude oil inventories are about 6% below the five-year average for this time of year. Refineries operated at 84.7% of their operable capacity last week this is down from last week, but it is still refinery maintenance season and we had a few unplanned outages this week. Total motor gasoline inventories decreased by 5.4 million barrels last week and are about 3% below the five-year average for this time of year. Gasoline production increased last week, averaging 10.1 million barrels per day, and we still had a huge draw. Demand is strong. This bodes well for refiners even with operating capacity down. I still would like to see over 90% where we were pre-IDA hurricane. Big distillate draw this week putting us about 10% below the five-year average for this time of year. Propane/propylene inventories increased by 1.9 million barrels last week and are about 17% below the five-year average for this time of year. we are slowly inching up, but this is still VERY concerning. I still like NGL producers for this OXY and AR are the largest. Big Cushing draw this week, this is getting very concerning again as we are on the very lower bound of the 5-year average (see charts). Total products supplied (implied demand) averaged 20.9 million barrels a day, this is the highest since September 3rd in a softer demand season. This is super positive.
Top NGL Producers
EIA Petroleum inventories vs inventories this same week ending in prior years
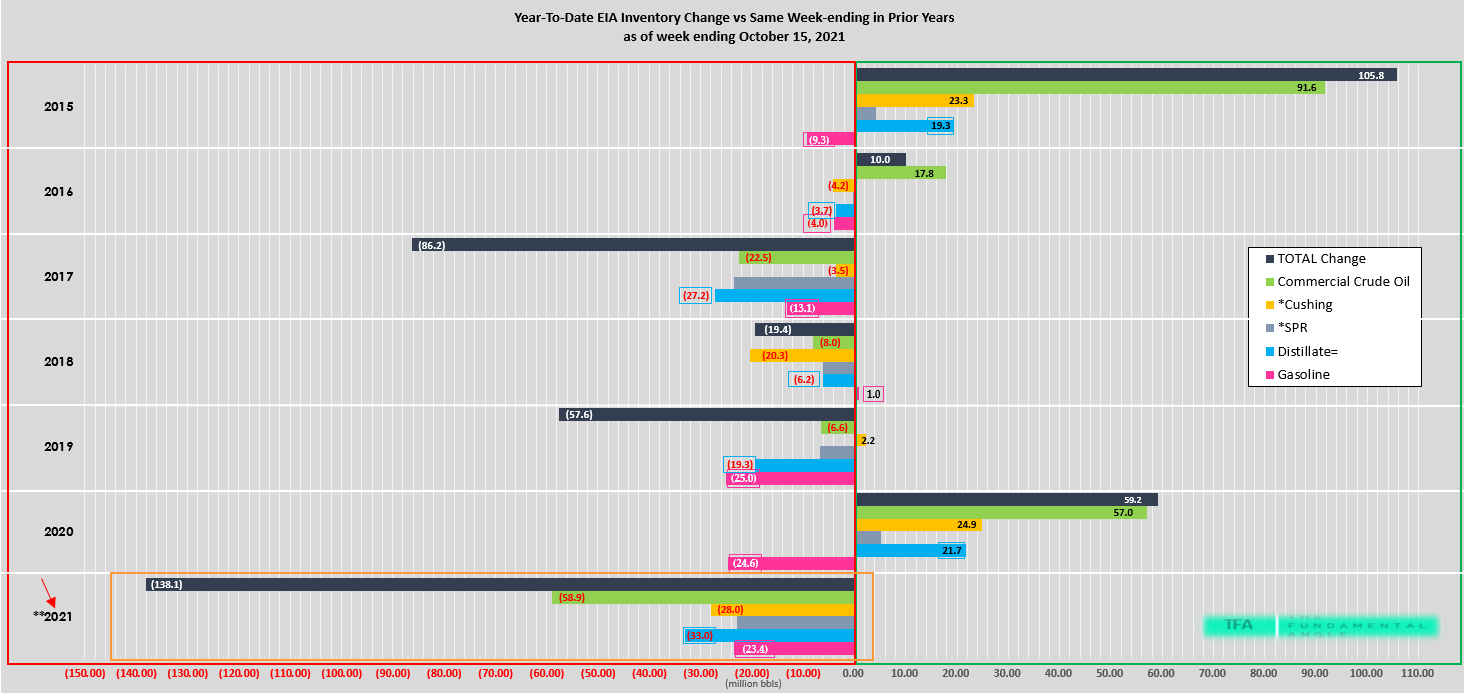
EIA YTD inventory change vs this same week in prior years
THE DEC 21/22 WTI CUSHING SPREAD IS BLOWING OUT- THIS IS PUTTING THE CURVE IN SEVERE BACKWARDATION-SO BULLISH AS YOU ARE PAID ON THE ROLL
REFINERY UTILIZATION
TOTAL COMMERCIAL CRUDE OIL INVENTORIES
CRUDE OIL INVENTORIES — CUSHING, OK
US CRUDE OIL IMPORTS & EXPORTS
CRUDE BALANCE VS INVENTORIES
GASOLINE BALANCE VS INVENTORIES
DISTILLATE BALANCE VS INVENTORIES
TOTAL PRODUCTS CONSUMED
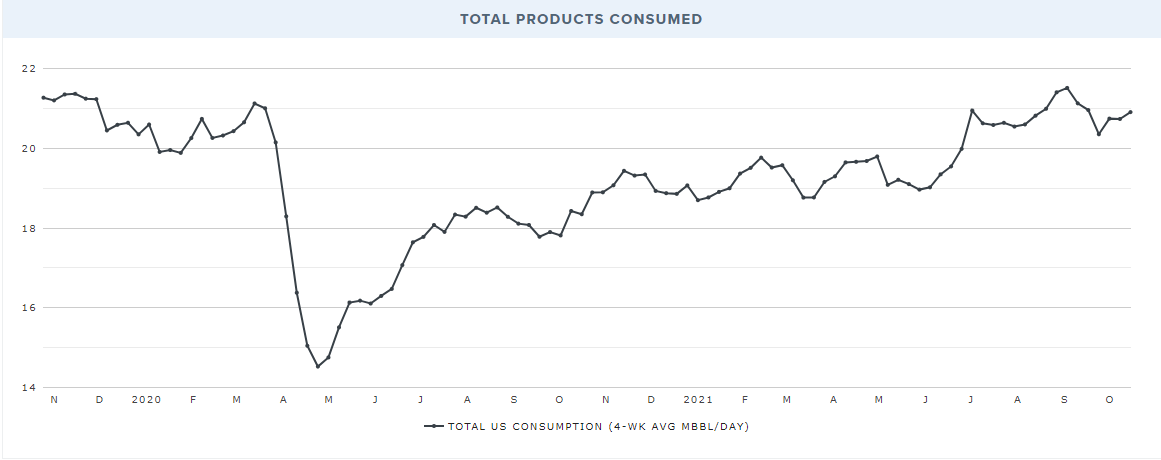
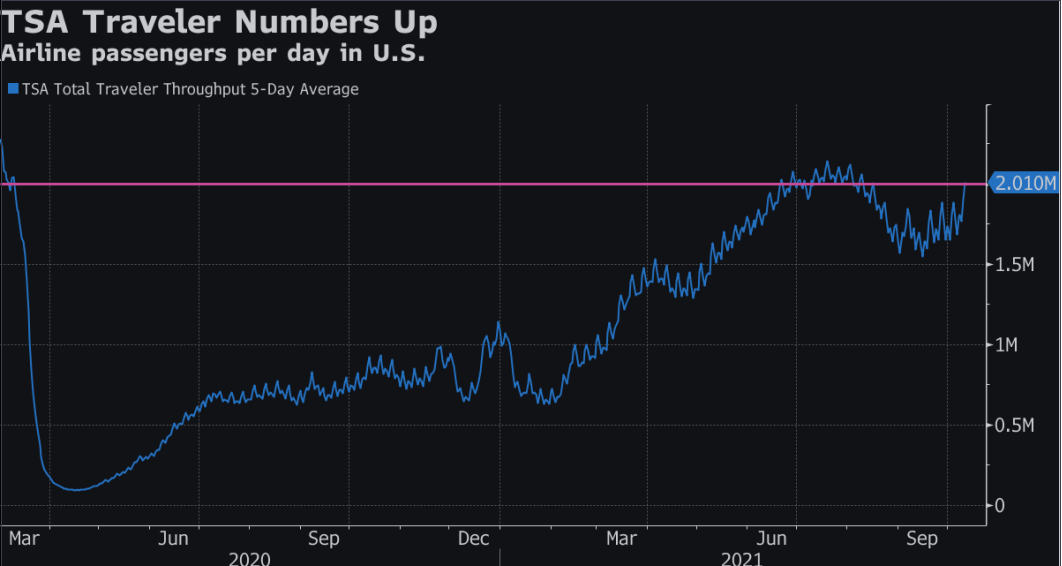
What is interesting about the total products consumed chart is that it looks similar to the TSA chart that I posted this week
EIA
LINK TO FULL REPORT HERE