
Quick Market Views
Stocks: Indexes are little changed off earlier highs and mixed to down small. Breadth is up but just moderately. NYSE up 700 issues and Nasdaq up 450 issues. The Mag 7 index is down 0.8% with only Nvidia up. Meta will likely break the 20 day up streak down nearly 3% today. Equities might be a bit tired after the recent move or perhaps it’s due to rates moving higher. I added some extra stuff on this note including a look as some current ideas, a few highlights of the BofA fund managers survey and ETSY earnings preview.
Bonds: Rates are up 3-5bps across the curve today.
Commodities: Bloomberg Commodity Index is up 1%. Crude is up 1.1%, Natural Gas is up 3.5%, Gold up 1.6%, Silver up 1.4%
Currencies: US dollar index is up 0.4% bouncing after recent weakness. Crypto is lower with Bitcoin relatively outperforming only down 1.4%.
Trade Ideas Sheet: Another good day with the PNL
Changes: Earlier on First Call I covered stupid 1% weight CVNA ahead of earnings this week. I also covered CAT with a decent gain. I’m debating taking off more China exposure with BABA up 45% and FXI and KWEB up nicely too. I’m holding the 2% ETSY long reporting tomorrow and have a preview. OXY reports after the bell and I didn’t do a preview but Berkshire has bought more and it’s been a proxy for energy and our cost isn’t that bad. AMD is getting closer to our cost with a good add at the recent lows after earnings. I still like it.
I am going to add a 1.5% weight to bring ARKK to 5% max weight short. see chart below.
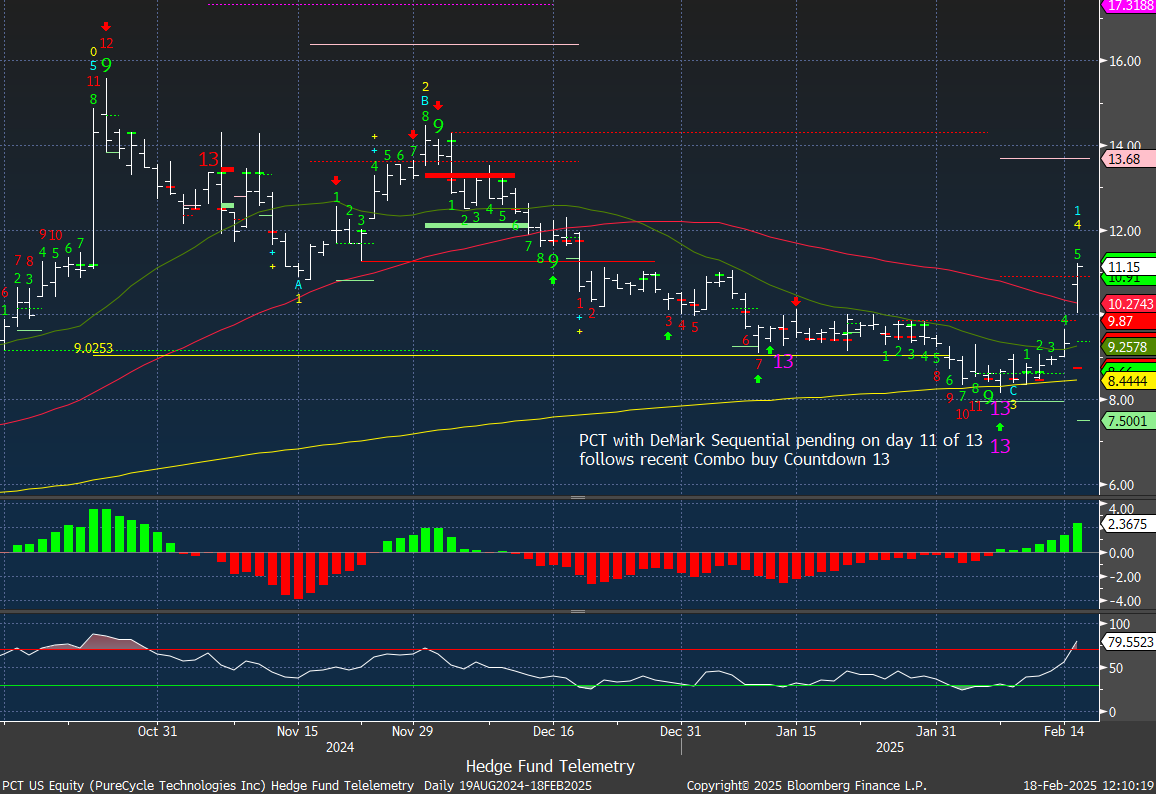
Thoughts: PCT Pure Cycle is the big winner for us today up +20% after Stan Druckenmiller revealed he is now a holder. I believe this validates PCT and expect other long only funds to follow. Add in the huge short position and this has room to run. We added more at 8.48 recently and I have a chart below. REKR is also up nicely on a patent win in Europe. Nothing on the short side is causing any concerns today.
For a few people the First Call note didn’t get delivered today. Here’s the link. This one is on me as I might have not selected everyone for distribution. I’ve been going 100% on resolving the recent issues with the site and I believe we have things fixed with the site clean. A few people using Norton have seen some block notices but they should lift anything in the next day as our site is not on any block list. It’s something that has never happened but we have worked hard and quickly to resolve it. Thanks for your patience.
US INDEXES
Here is a primer on the DeMark Setup and Sequential indicators.
S&P futures 60-minute tactical time frame with small reversal off earlier highs. 6063 is the TDST Setup Trend support to watch if things slip lower.

S&P 500 Index daily stalling today.

Nasdaq 100 futures 60-minute tactical time frame reversed down after the latest Sequential and Combo 13’s.

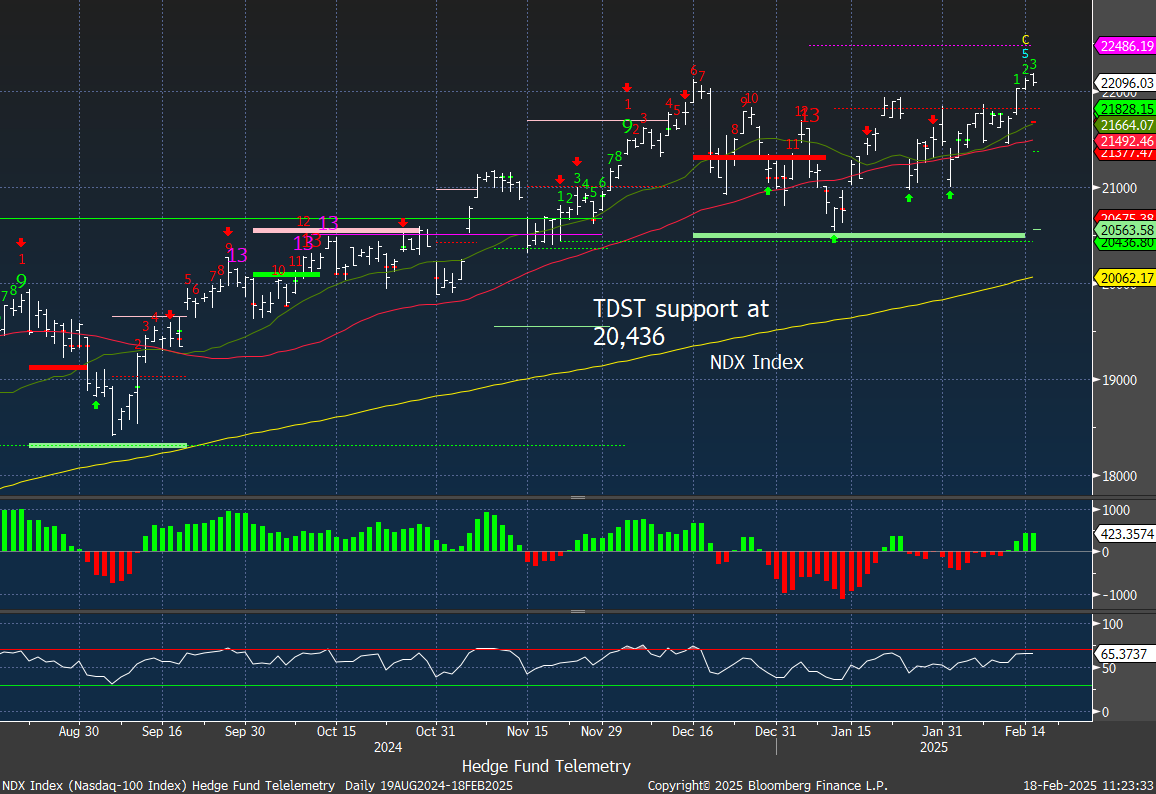
Nasdaq 100 Index daily reversal after poking above the recent range.
IWM Russell 2000 continued to move in a sideways range – although well off highs.

b of A fund managers survey highlights
The first chart highlighted is cash levels at 15 year lows at 3.5%. I’ve highlighted other examples of retail inflows that are off the charts but clearly fund managers are all in too.

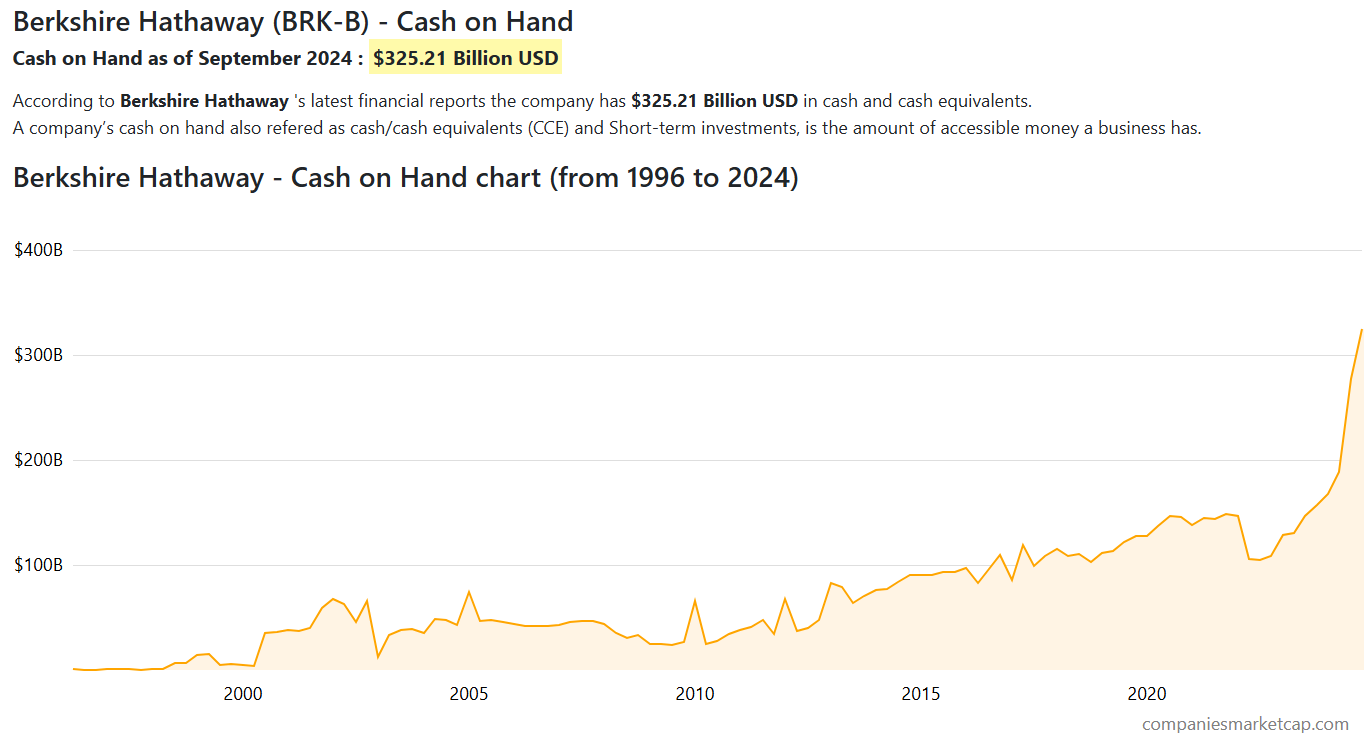
This wasn’t in the fund managers survey but as a reminder Berkshire Hathaway’s cash levels continue to spike to over 1/3 of the market cap. Have fun staying poor Warren.
Investors are bullish and soft or no landing are at combined 93%.
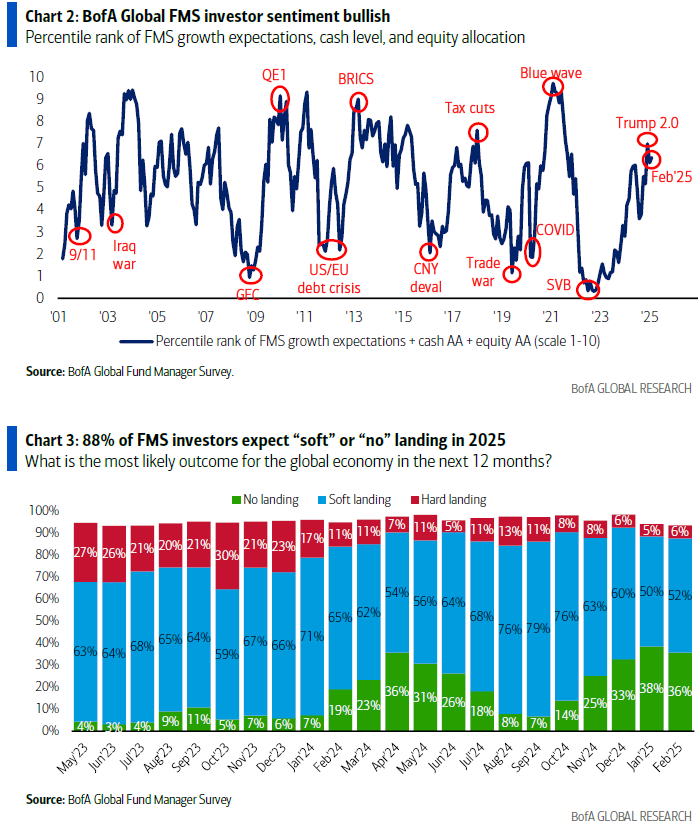
Usually when people expect a recession it’s already priced in. This shows the majority doesn’t expect a recession. If you’re a contrarian, this is a sign recession risks are worth watching out for.

Short China was the biggest crowded trade not so long ago and now expectations and hopes are increasing

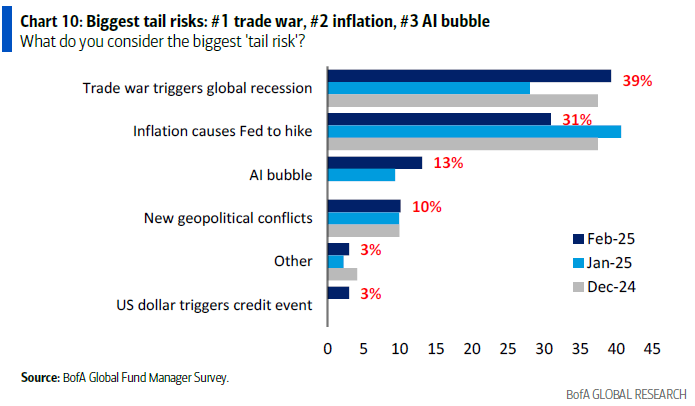
Nobody wants a trade war and inflation risks remain.
No big changes here but I am going to guess this started starts to top since more Mag 7 are down after earnings than up.

Going back to the Berkshire Hathaway cash level chart, Warren Buffet’s metrics for having a large cash allocation is justified when looking at this chart of US equity seen as overvalued. That’s nearly 90% of the fund managers saying US equities are overvalued!

Trade Ideas Sheet

PCT Pure Cycle is up 20% today after Stan Druckenmiller’s firm reported a decent sized new long position. This one remains heavily shorted and I think another day or two of this will squeeze out more shorts. Having Druck in this one also gives some validation for other long only funds to get involved too. I added to this one with the Combo 13 at 8.48 bringing position size up to 4%. I wanted the Sequential 13 which was left pending on day 11 of 13 and now with this move that pending Sequential is likely to cancel in the coming days.
We are nearing our cost basis on AMD ~115 and doubling up the position on the Sequential 13 might have been a decent move. This needs to clear the 20 day (green line) then the 50 day (red line) for a clear trend change.

ARKK has new Combo 13’s and should pullback.

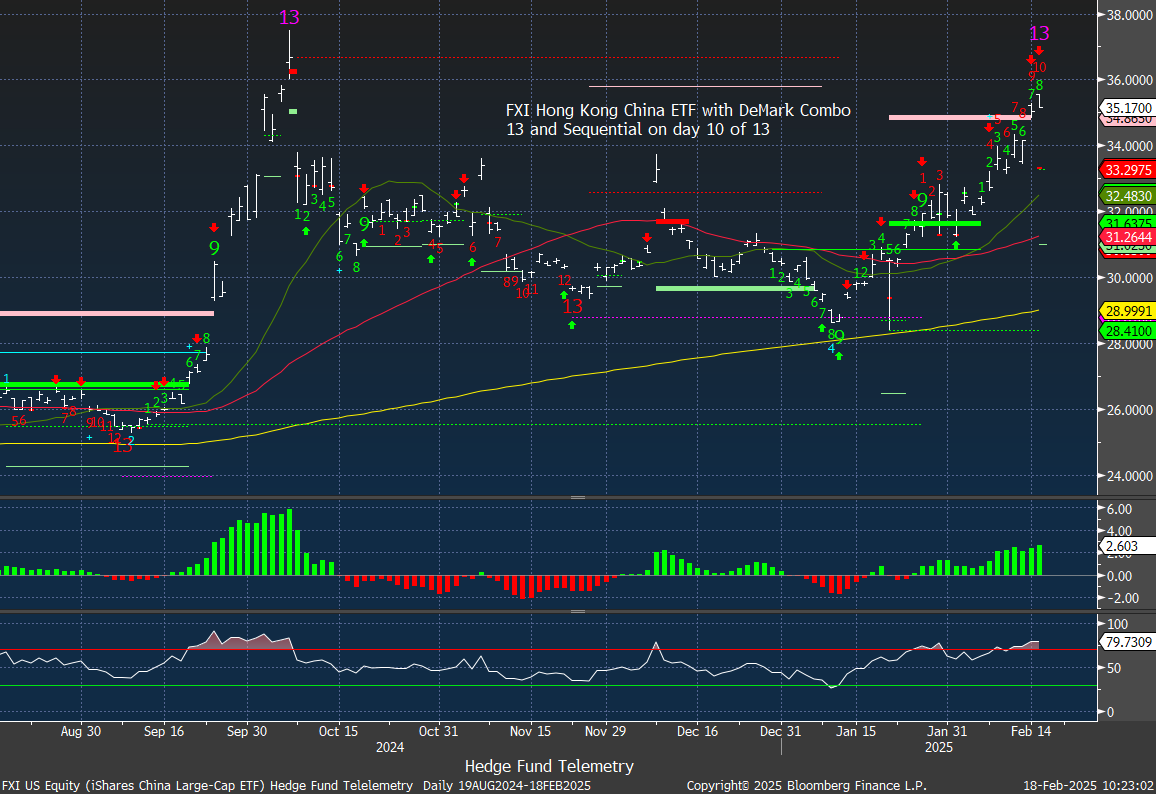
BABA, FXI, and KWEB our China long exposure is STRETCHED. BABA and FXI has new Combo 13’s. BABA reports on Thursday. BABA is now up 47%, FXI up 15%, and KWEB up 21%. We have taken gains on the way up and our exposure is now 6%. We have some room if and when this drops although I am debating taking these off and buying back lower.


EWZ Brazil ETF still looks good with Sequential on day 7 of 13. I continue to hold this long now up 17% with a target at the 200 day

ETSY reports tomorrow morning and I remain long. My average is near and I can say this one is not well liked and expectations are very low. The weekly chart shows a decent base with breakout potential over 60. I’ll hold this 2% weight into earnings.
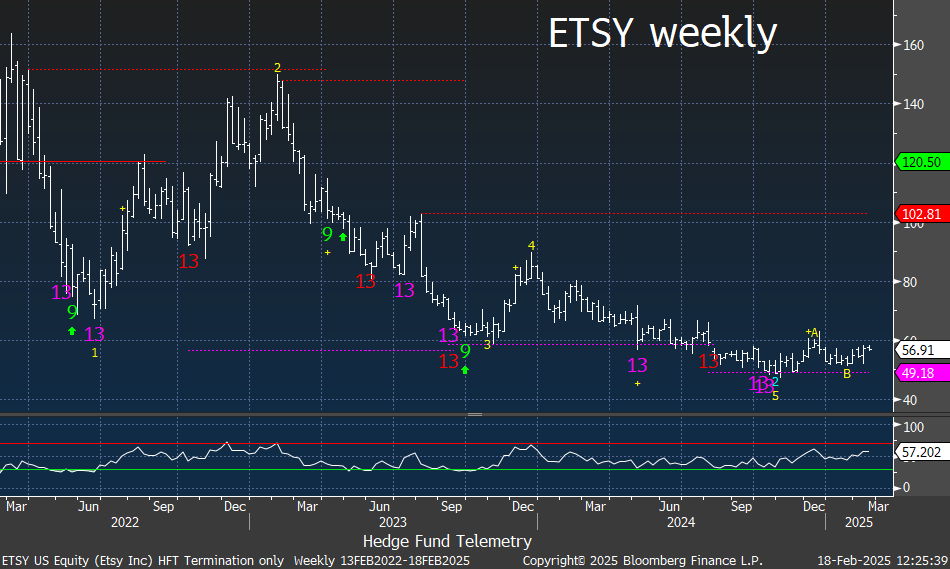
The implied move is typically high and the expected move after earnings is 10.93%.

Short interest is elevated with 5 days to cover. On the Options Rank there has been some call buyers with the red dots but more neutral than extreme.

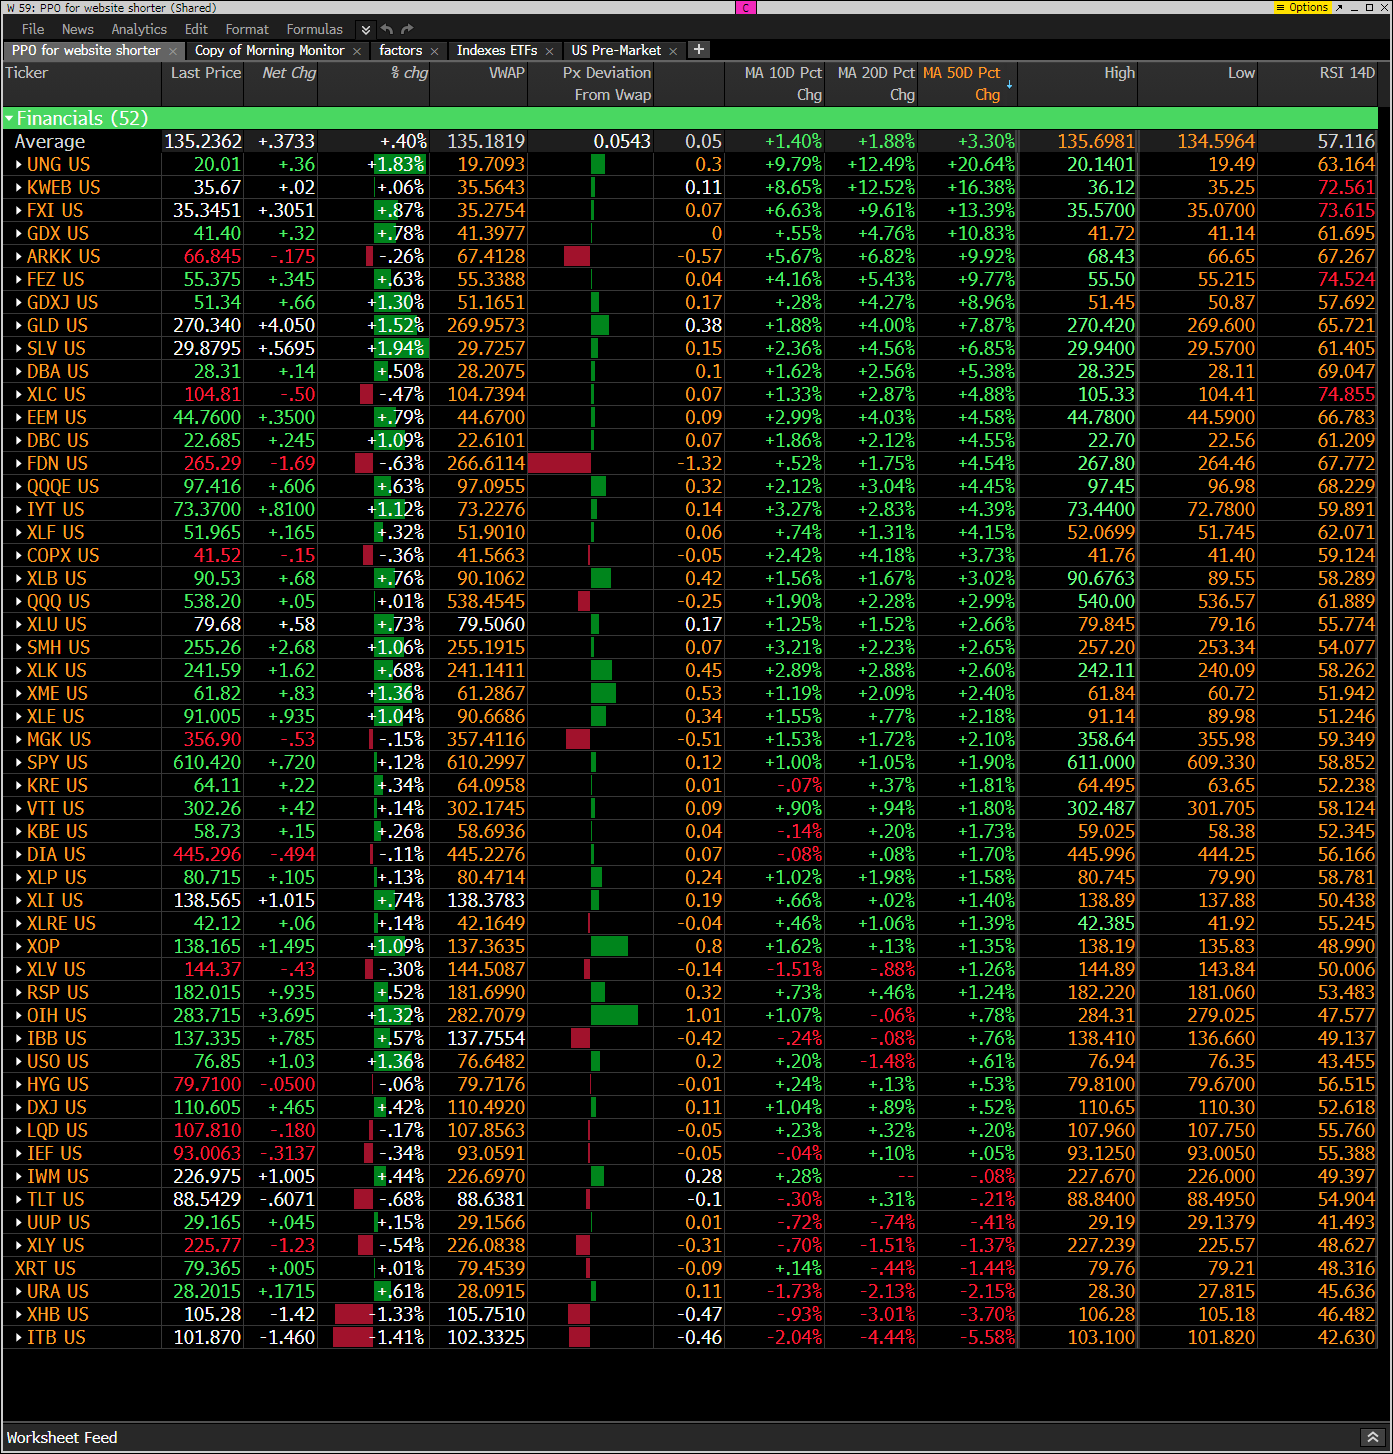
Hedge Fund Telemetry ETF Percentage Price Oscillator Monitor
The PPO monitor (percentage price oscillator) force ranks ETFs by percentage above/below the 50-day moving average. For information on this monitor, please refer to this primer. This monitor and others are offered to Hedge Fund Telemetry subscribers on Bloomberg. Mostly a decent day overall with some tech weakness.
Index ETF and select factor performance
ETF with today’s performance with 5-day, 1-month, and 1-year rolling performance YTD.

Goldman Sachs Most Shorted baskets vs. S&P Indexes
This monitor has the S&P indexes and the Goldman Sachs most shorted baskets.

DeMark Observations
Within the S&P 500, the DeMark Sequential and Combo Countdown 13s and 12/13s on daily and weekly periods. Green = buy Setups/Countdowns, Red = sell Setups/Countdowns. Price flips are helpful to see reversals up (green) and down (red) for idea generation. The extra letters at the end of the symbols are just a Bloomberg thing. Worth noting:

Major ETFs among a 160+ ETF universe.
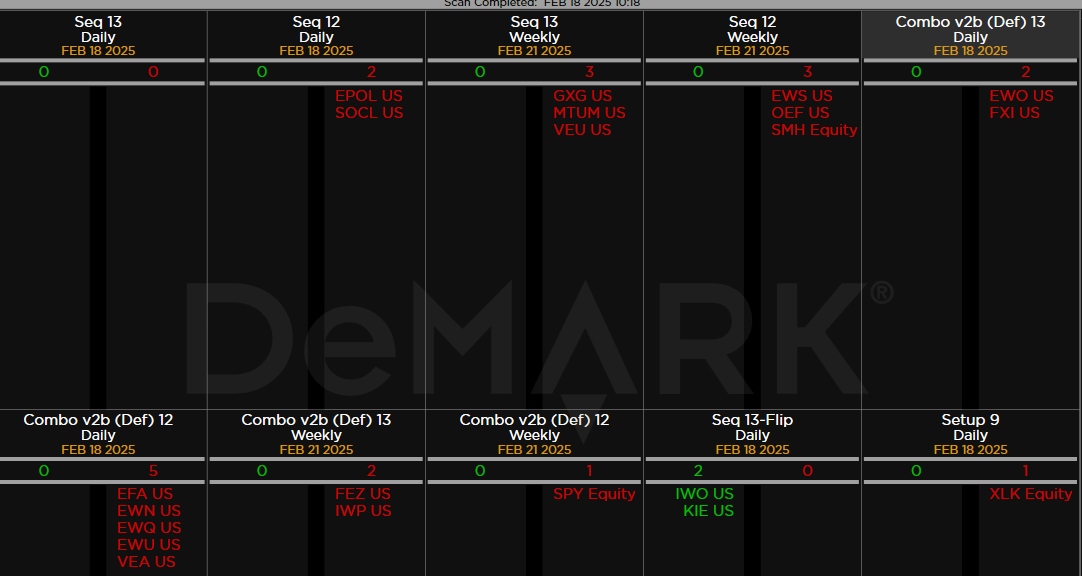
If you have any questions or comments, please email us. Data sources: Bloomberg, DeMark Analytics, Goldman Sachs, Street Account, Vital Knowledge, Daily Sentiment Index, and Erlanger Research