
Back in late 2007, we had Ned Davis, one of the best market strategists and market historians, in our office. He was getting nervous about what was building up with the high speculative leverage levels, elevated sentiment, and the narrow action in the markets. Remember Cramer’s “Four Horsemen of Tech”? That was the precursor to what we have today with the Mag 7. Ned was unusually concerned about market leverage. He highlighted the record leverage recorded by FINRA and stated that leverage is even higher in places where nobody is looking. That leverage turned out to be on bank balance sheets, and we know how that story ended. One other thing he said that I remember well is, “You might be surprised if one of your investors asks for a redemption,” implying that even our investors (we had mega-rich clients, family offices, pensions, and endowments) might be overleveraged. If one link of the chain broke, they might need to raise capital. We had a great 2008 as we were correctly positioned and beat 99% of other hedge funds. We did get a few redemptions that, in hindsight, were overleveraged.
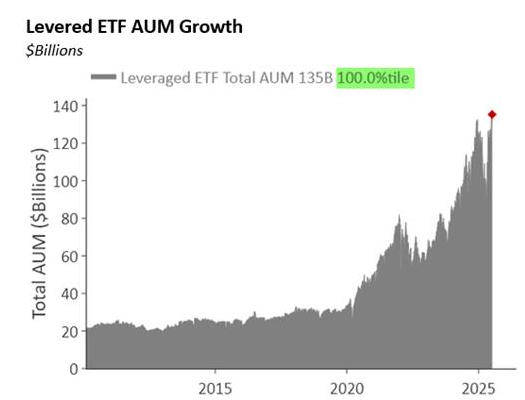
Today, the market has more than 2.5x the reported leverage by FINRA as compared with 2007. The Interactive Brokers founder warned in January about the risks of high leverage with his accounts. With the advent of double- and triple-levered ETFs, which now include single-stock levered ETFs, there is leverage on top of leverage. In 2020, there was approximately $25 billion in leveraged ETFs, and today it stands at $135 billion. The amount of leverage in fixed income, I could imagine, is also relatively high. Unwinding high levels of leverage could have contributed to the 20% market pullback in March and April. But that leverage came back, and it’s even higher now.
Ray Dalio of Bridgewater penned his first public note, calling for “The Great De-Leveraging,” at the end of the Great Financial Crisis, but was ultimately wrong, as leverage has only increased to dangerous levels, especially in credit and sovereign debt. This is another potential risk for the future.
Another challenging time was back in early 2018, when a leveraged inverse volatility ETF experienced a significant blowup, causing a swift and steep market decline. That period is referred to as “Volmageddon.” Since the 2020 low, the derivative and income assets have nearly tripled, rising to close to $300 billion from $100 billion. These are strategies that sell volatility, and as long as things move steadily upward and to the right, these funds perform relatively well until they don’t.
In his 2002 Berkshire Hathaway annual letter, Buffett stated: “In my view, derivatives are financial weapons of mass destruction, carrying dangers that, while now latent, are potentially lethal”. That was 2002, and today the amount of derivatives in notional value in the markets has seen exponential growth. If Buffett was concerned then, I would love to know what he thinks now. The options market has evolved into a shorter-term, get-rich-quick playground for gamblers, led by 0DTE (zero days to expiration), with daily and weekly expirations.
Throughout history, typical corrections have turned into market catastrophes when extreme leverage and derivatives are added to the cocktail. In 1929, investors were required to put up only $10 for every $100 invested. In 1987, while margin debt wasn’t as extreme as in 1929, leverage was embedded in portfolio insurance strategies and derivatives. In 1998, Long Term Capital Management, with $4.7 billion in assets, was levered to over $100 billion and over $1.25 trillion notional through derivatives. Keep in mind that nobody paid any attention to this leverage, as a couple of the founders were Nobel Prize winners and an ex-Vice Chairman of the Fed. It nearly took down the whole financial system.
I’m asked often what will be the catalyst for the markets to move lower and fall into a longer-term bear market. I don’t know the catalyst, as there could be many on the horizon. Still, I can say with a degree of certainty that the risk of high levels of leverage mainly concentrated in the largest mega-cap stocks, the massive amount of derivatives notionally traded today, combined with the ‘get-rich-fast’ gamblers’ mentality, will be something spectacular.
We’ll be prepared and not surprised, appropriately positioned. There will be tremendous opportunities on both the short and long sides in the future.
Quick Market Views
Stocks: Decent price action today while indexes continue mostly sideways on the shorter term charts. Breadth is good with NYSE up 1100 issues and Nasdaq up 800 issues. Most sectors are up ex energy and consumer staples. Short baskets are seeing some moderate squeezing. Mostly summer like trading. NVDA hit $4 trillion in market cap.
Bonds: Rates reversed lower down 2-6bps
Commodities: Mixed action with overall Bloomberg Commodity index down 0.6%. Copper is giving back some gains down 2.6% with new Sequential sell Countdown 13 (see First Call for chart). Crude is flat, Natural Gas is down 4%. Gold up 0.1% and Silver down 0.4%
Currencies: Dollar Index is flat and currencies are little changed. Bitcoin is up 0.5%
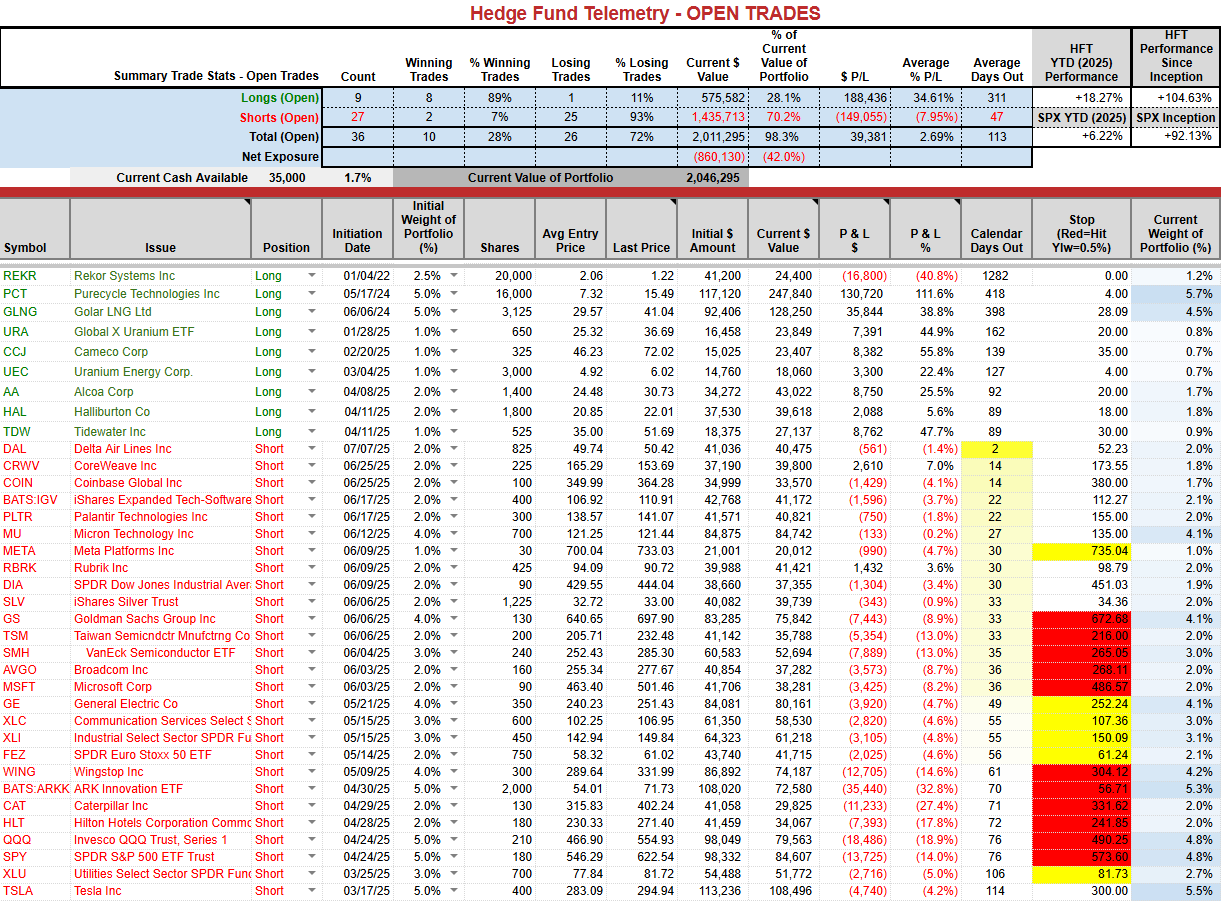
Trade Ideas Sheet: Steady holding over 18% YTD
Changes: No changes as I expect shorts to start working soon. I do like a put spread idea that is cheaper than shorting equity indexes. Buy the NVDA August 15th expiration 150-130 put spread for ~$2.10. This doesn’t capture earnings as earnings are later in August. If below 130 the lower strike it would pay 9.5x.
Thoughts: PCT continues to lift and is helping the PNL today. More negative Elon world news: the CEO of X resigns.
US INDEXES
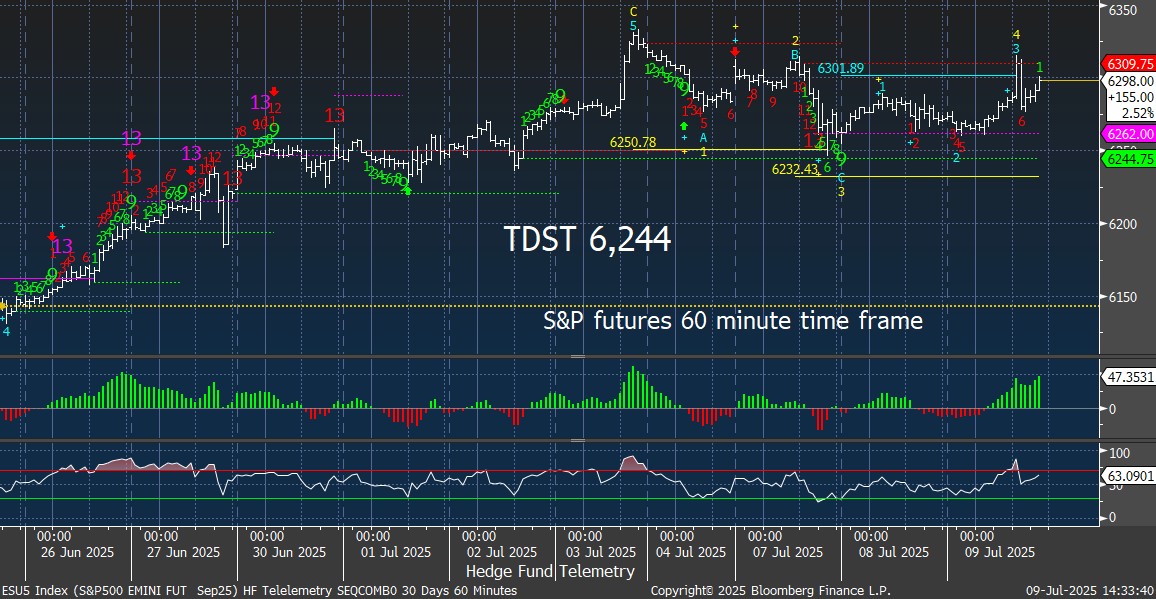
S&P futures 60-minute tactical time frame still sideways.
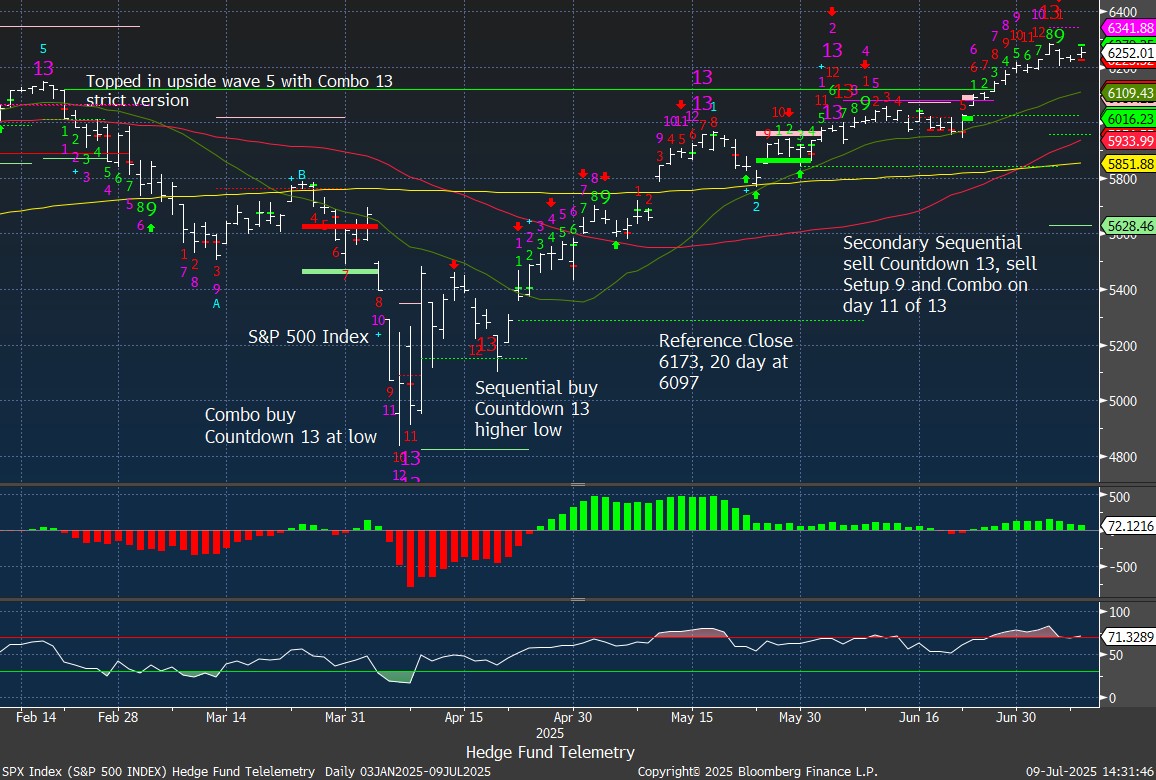
S&P 500 Index daily with recent Sequential sell Countdown 13 and sell Setup 9. No price flip yet and holding Reference Close.
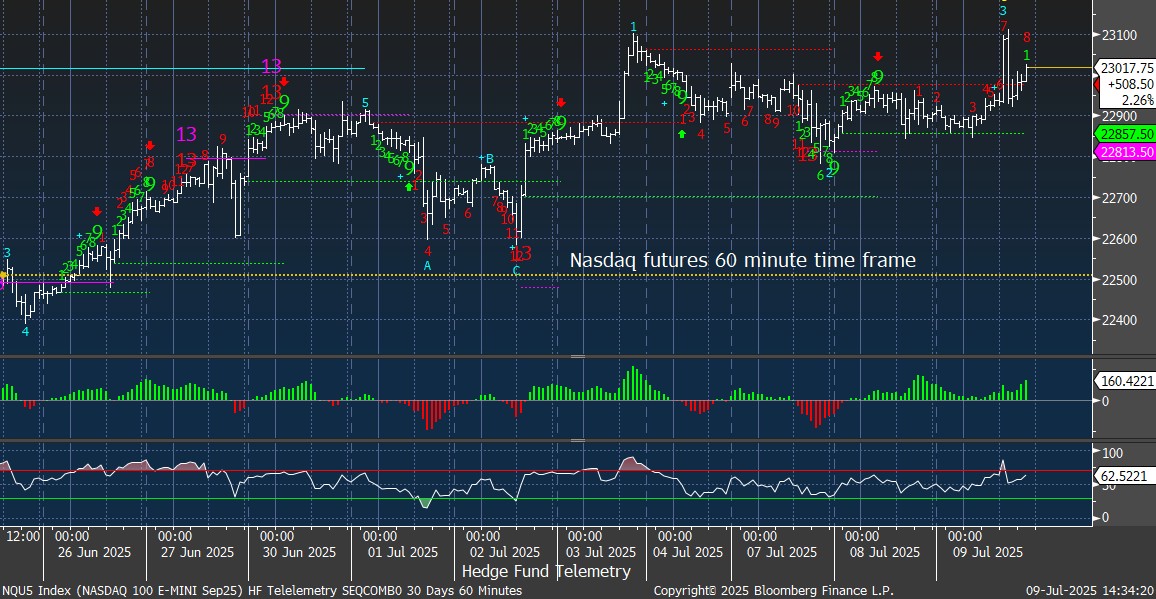
Nasdaq 100 futures 60-minute tactical time frame still sideways
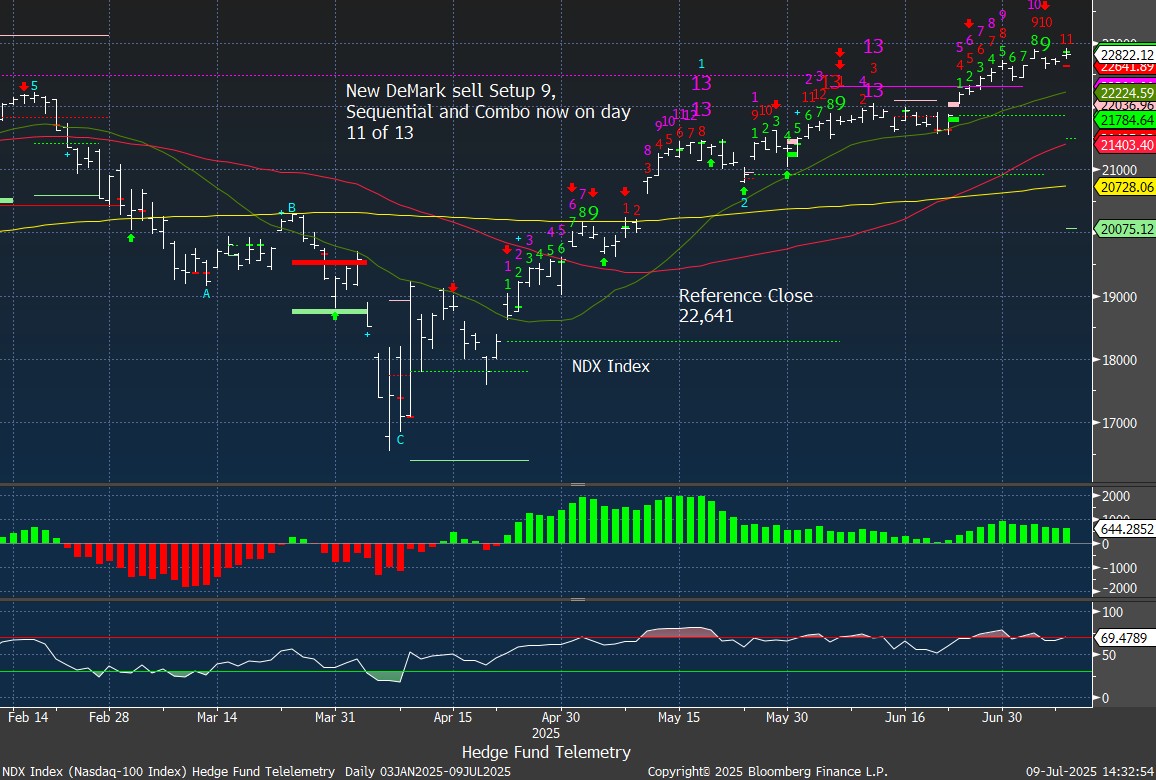
Nasdaq 100 Index daily now on day 11 of 13 with Sequential Countdown. Reference close first support
Trade Ideas Sheet
BABA has been a very good long idea in the last year and I took off the long as I expected a little more downside. Combo is getting closer after today’s Sequential. I’ll hold off too as some China tariff news might send it lower as well.

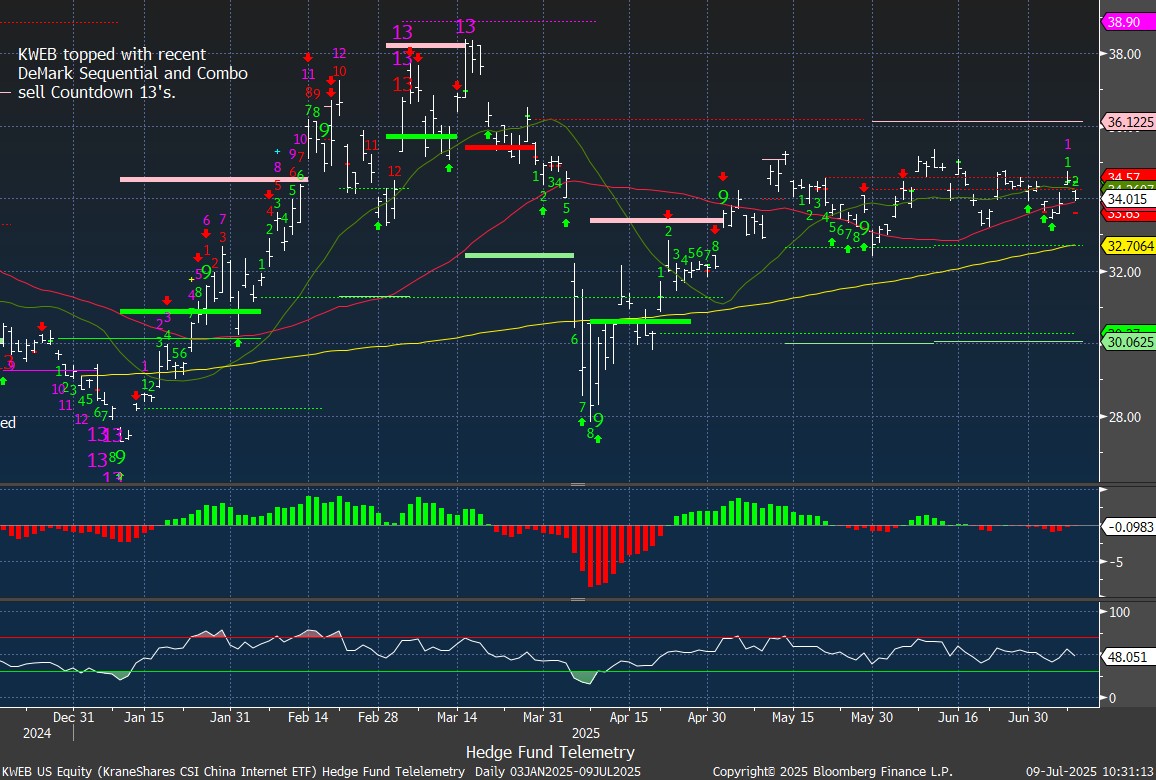
KWEB China internet also was a big winner on the long side and it’s been moving sideways. I’ll look for another entry soon.
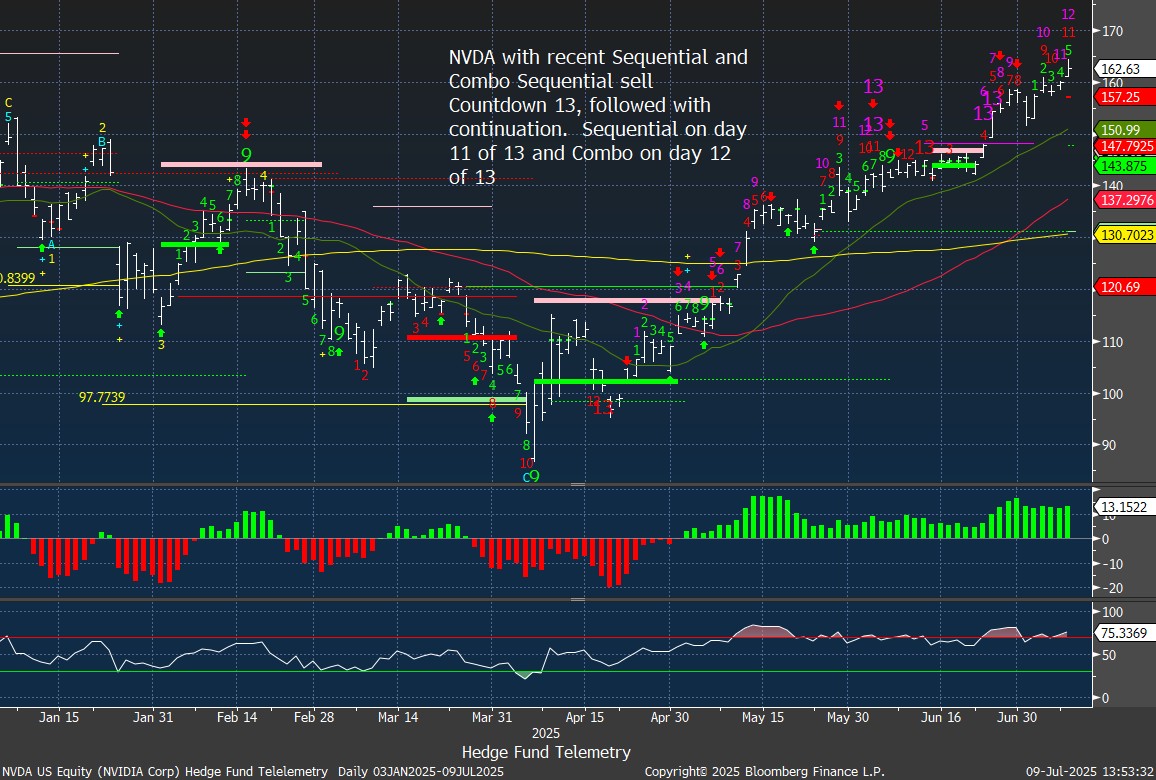
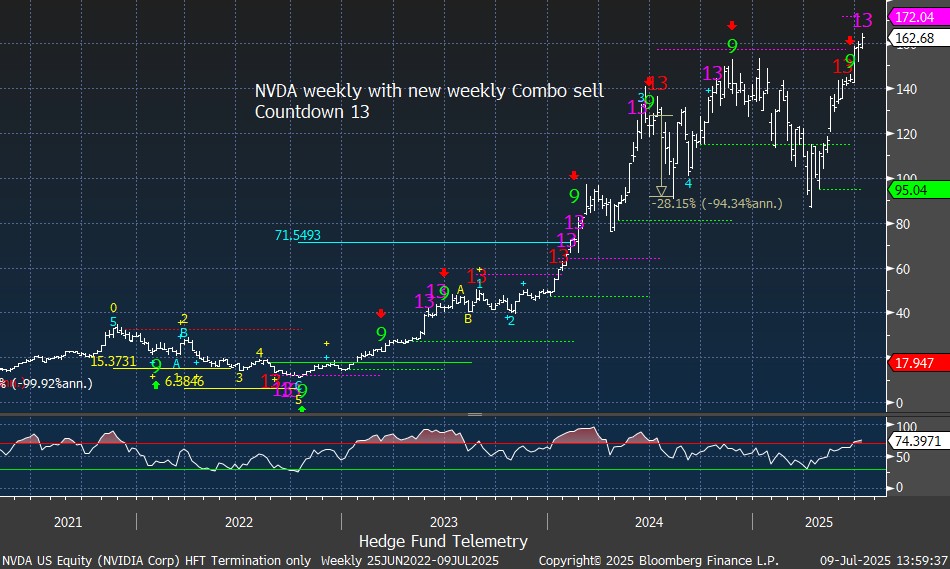
NVDA paused with recent 13’s as we sold the remainder of our long position bought under 100. Secondary Sequential on day 11 of 13 and Combo on day 12 of 13. I really like the put spread idea.
NVDA weekly with new Combo sell Countdown 13.
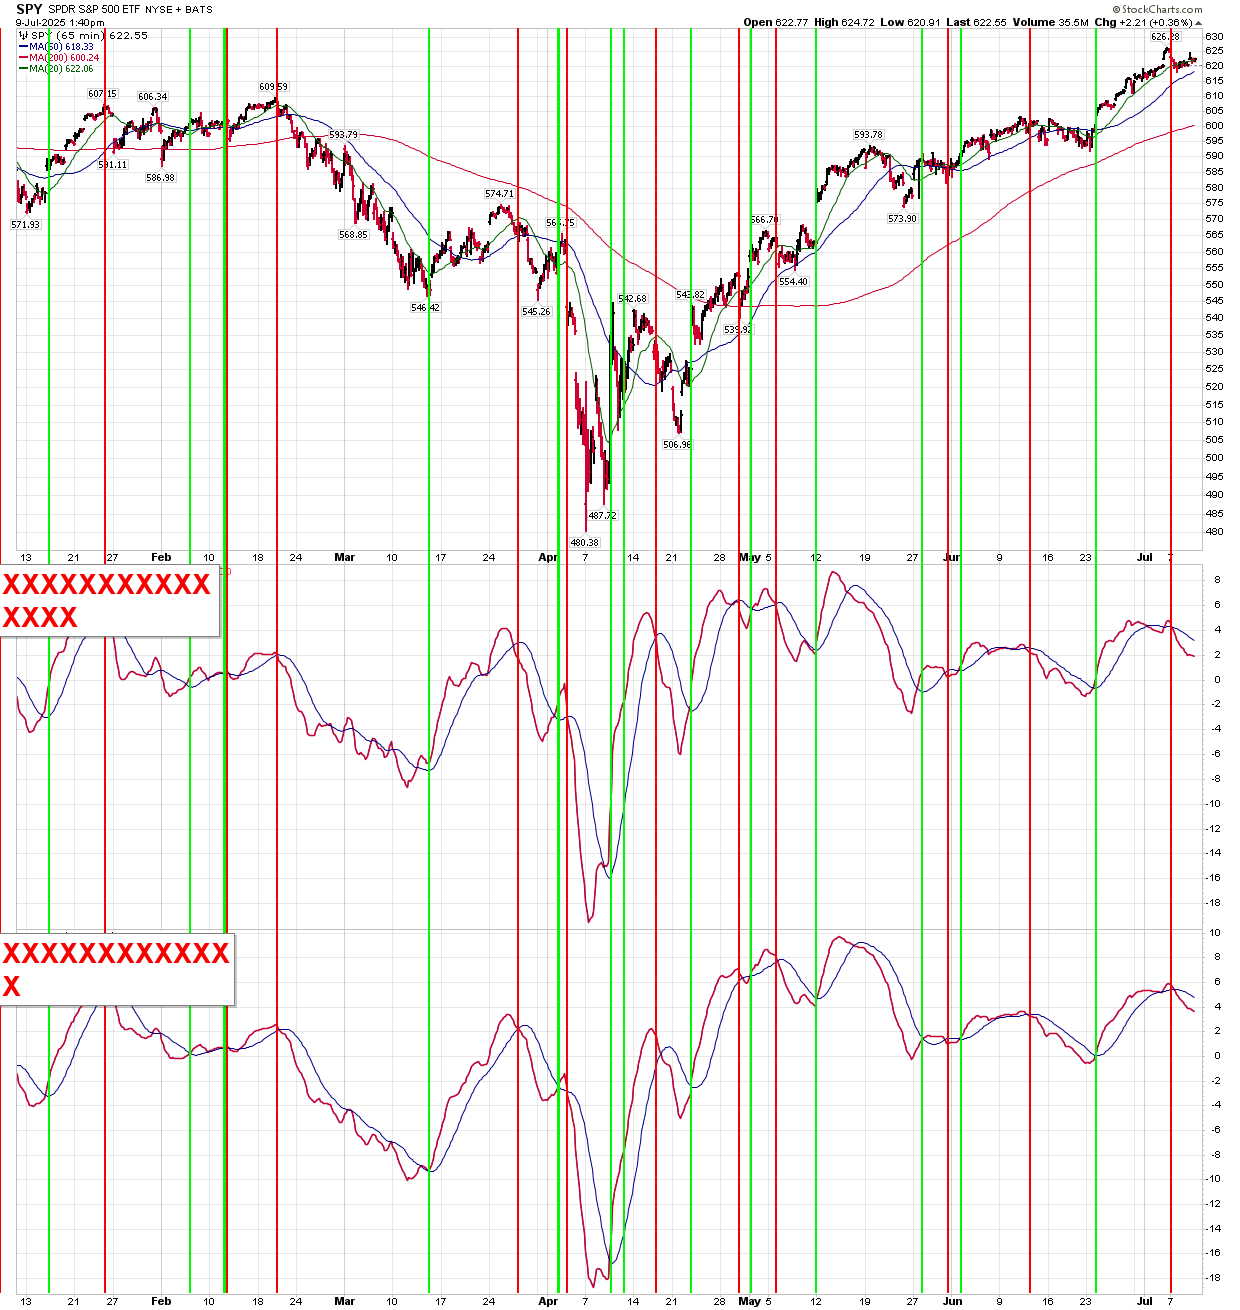
The short term SPY and QQQ momentum indicators remain on sell signals.
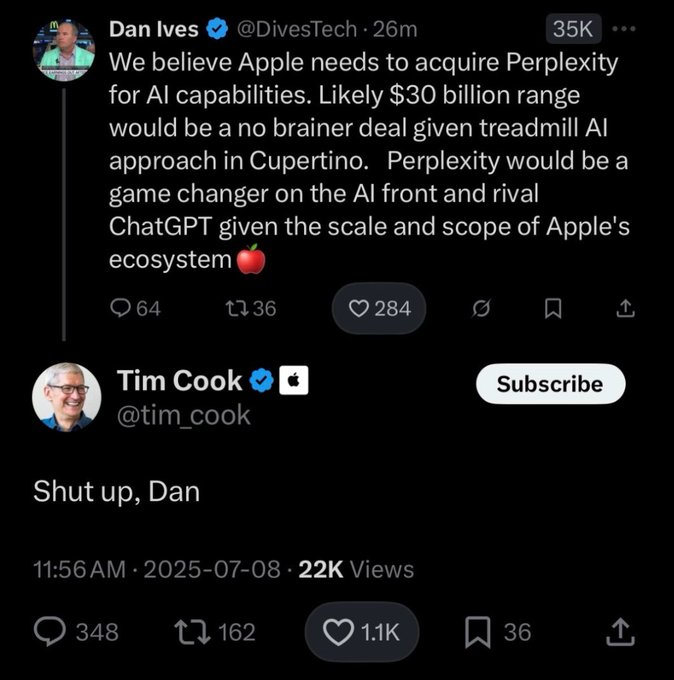
Shut up, Dan – my new favorite meme
Following yesterday’s response from Elon Musk to Dan Ives’ tweet, it has now become a meme.
Leverage cocktail – the recipe
Nomura presented a few charts that are key ingredients for the leverage cocktail. Here’s the levered ETF AUM growth.
Derivatives selling of options AUM growth is just CRAZY. If the inverse ETF Volmaggedon was bad, this could be epic.

GS was out showing that mega-cap valuations are down from the peaks in 2020-2021, but let’s remember that back then, P/E ratios spiked since earnings declined. At 30x earnings, it’s a weak argument that these are cheap. These remain very crowded.

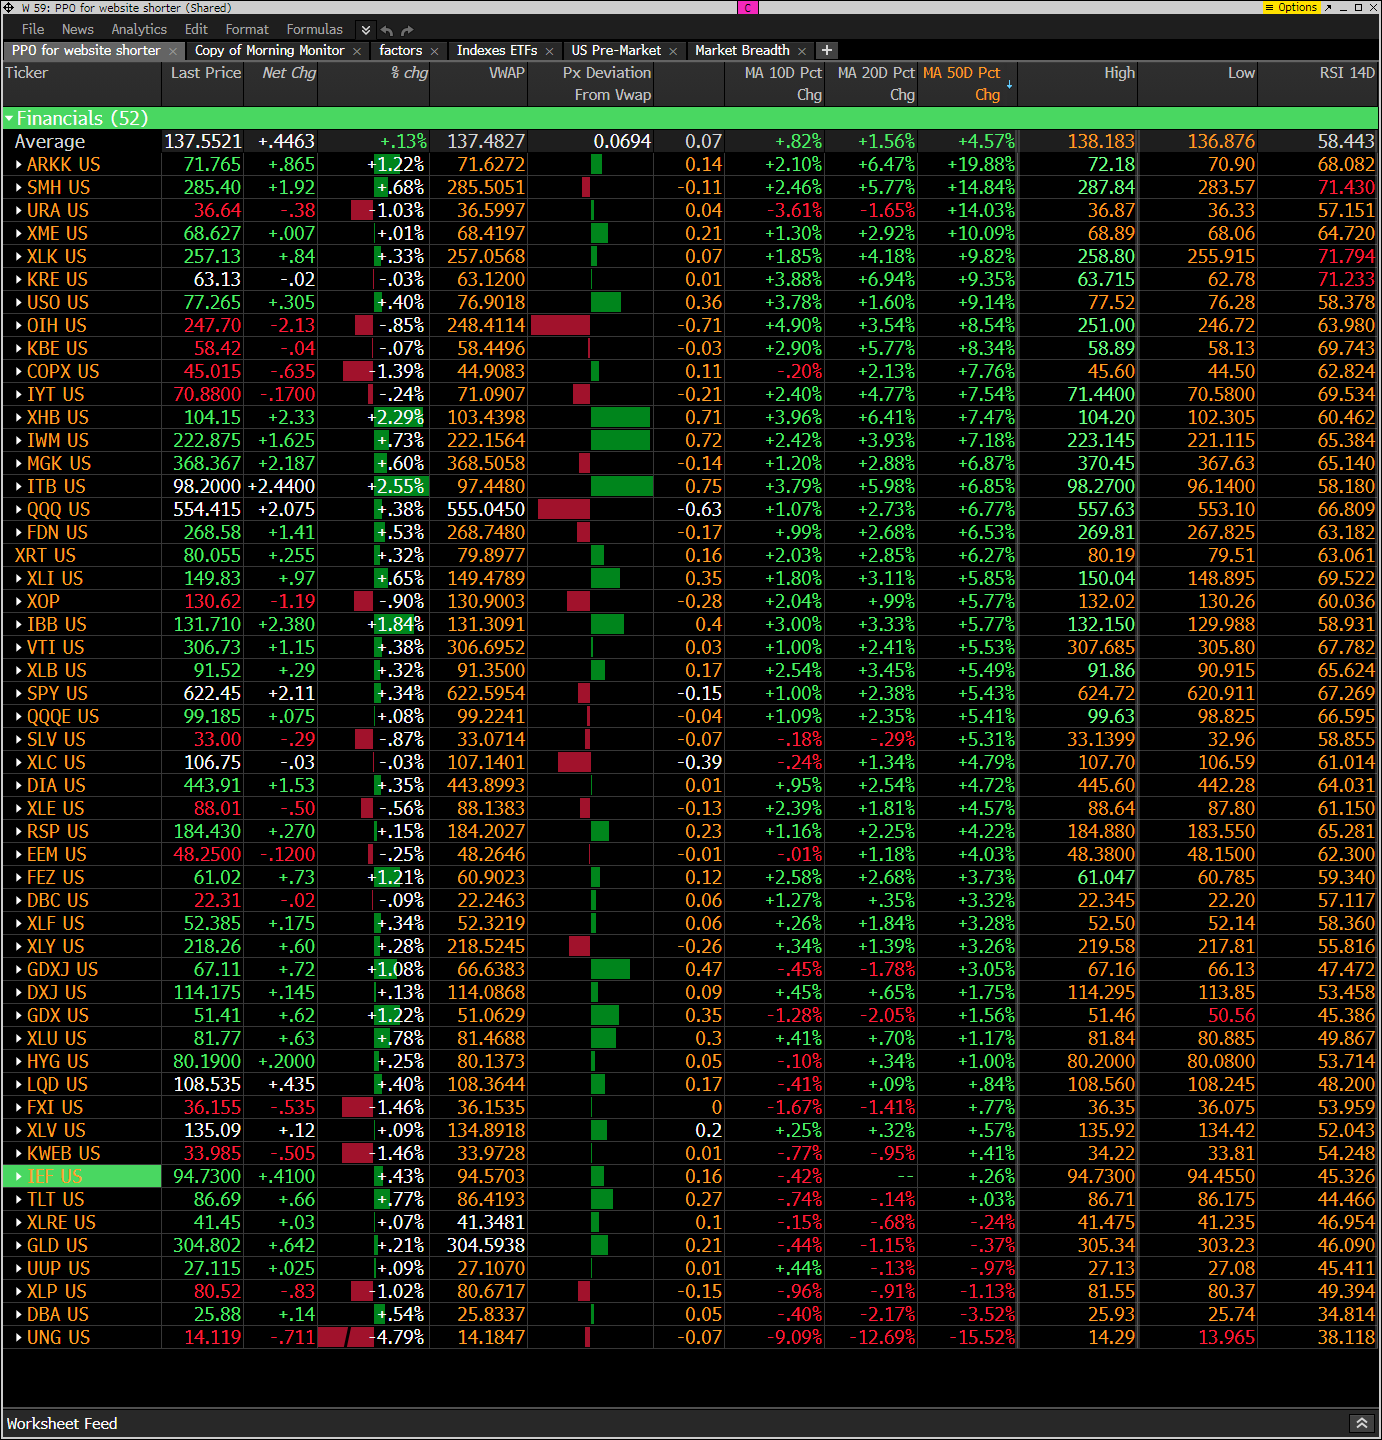
Hedge Fund Telemetry ETF Percentage Price Oscillator Monitor
The PPO monitor (percentage price oscillator) force ranks ETFs by percentage above/below the 50-day moving average. This monitor and others are offered to Hedge Fund Telemetry subscribers on Bloomberg. Mixed action with price increases and above/below today’s VWAP.
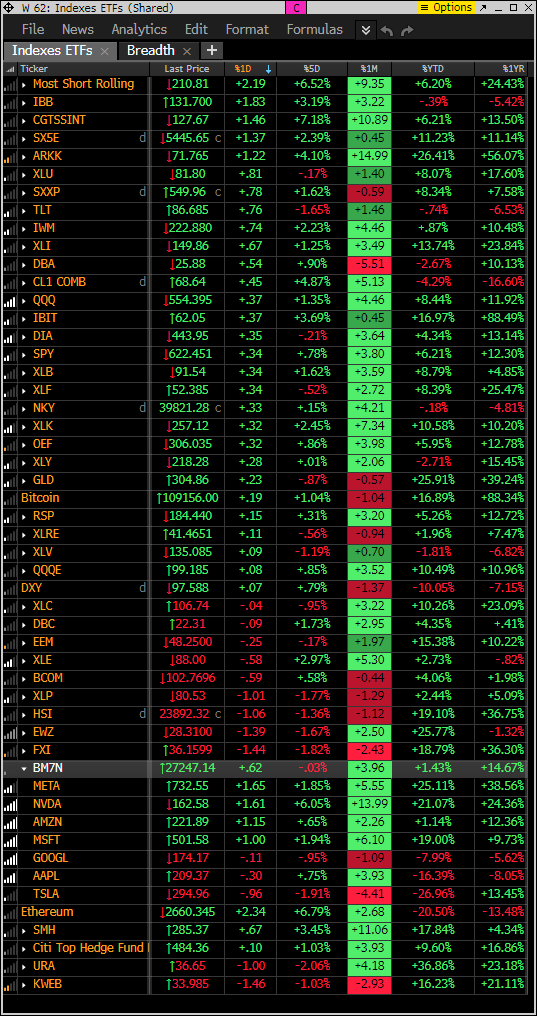
Index ETF and select factor performance
ETF with today’s performance with 5-day, 1-month, and 1-year rolling performance YTD.
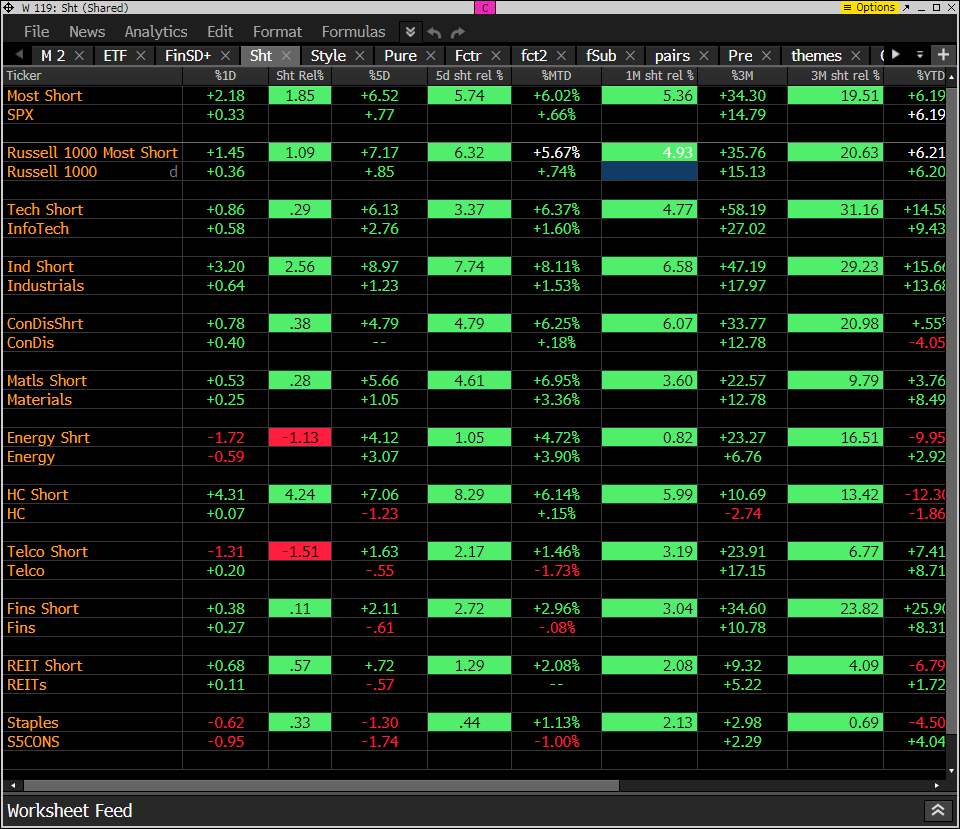
Goldman Sachs Most Shorted baskets vs. S&P Indexes
This monitor has the S&P indexes and the Goldman Sachs most shorted baskets. Seeing squeezing on the upside ex energy and consumer staples
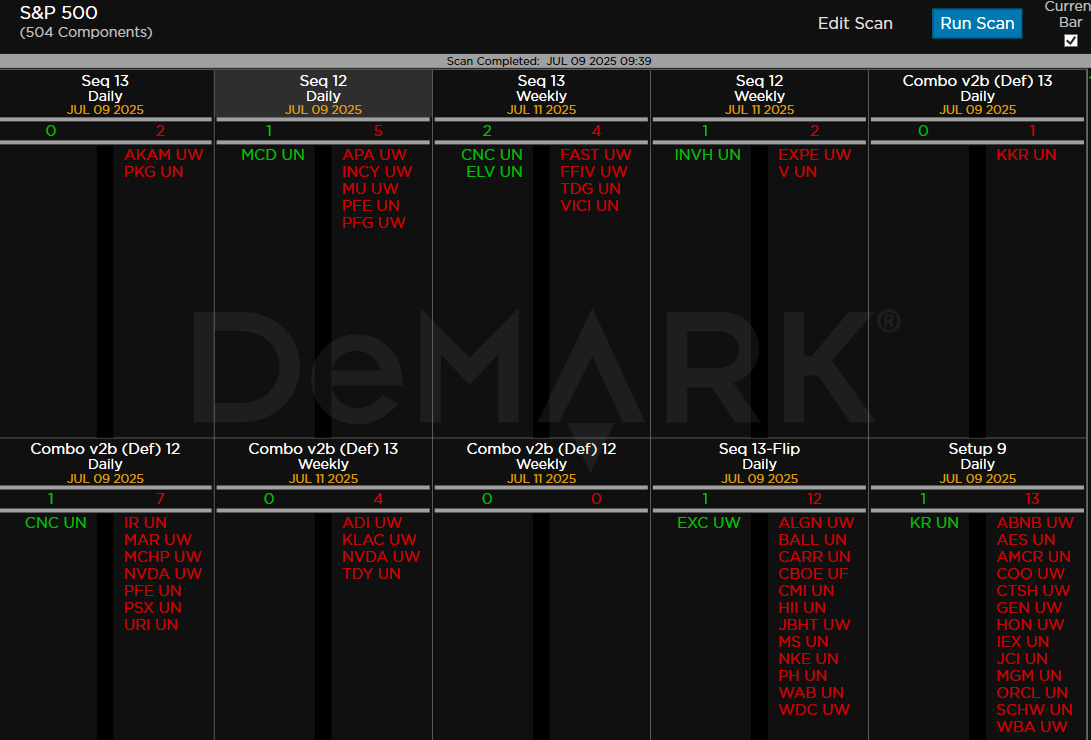
DeMark Observations
Within the S&P 500, the DeMark Sequential and Combo Countdown 13s and 12/13s on daily and weekly periods. Green = buy Setups/Countdowns, Red = sell Setups/Countdowns. Price flips are helpful to see reversals up (green) and down (red) for idea generation. The extra letters at the end of the symbols are just a Bloomberg thing. Worth noting: Decent number of price flips down and more sell Setup 9’s.
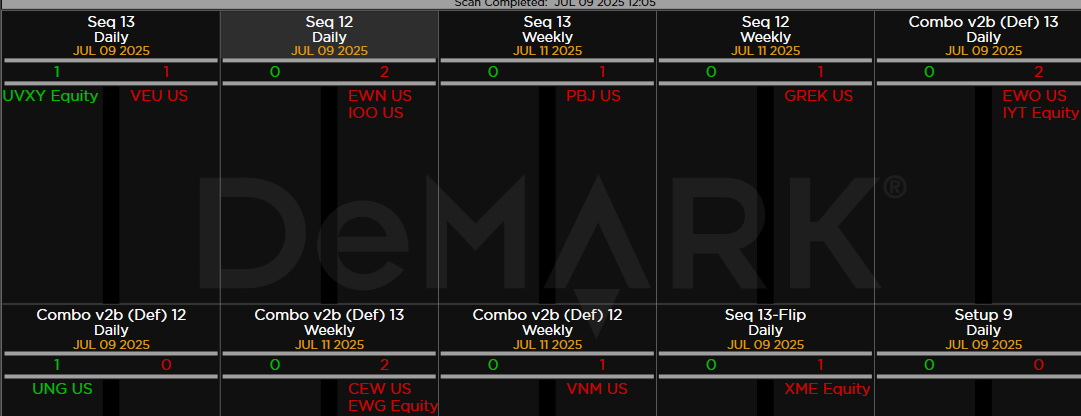
Major ETFs among a 160+ ETF universe.
If you have any questions or comments, please email us. Data sources: Bloomberg, DeMark Analytics, Goldman Sachs, Street Account, Vital Knowledge, Daily Sentiment Index, and Erlanger Research