

- The Tweet is mightier than the sword. Trump tweeted (or whatever you call it) his displeasure with China (rare earths etc) and threatened to raise tariffs… again. The proposed meeting with Xi is now off.
- I’ve mentioned that the larger the bubble, like a balloon blown up to its maximum, the thinner the membrane becomes, and it doesn’t take much to pop. The market is using this as a risk off event. I’ve already heard the buy the dip cries early in the decline. Maybe it’s a great dip buying opportunity or perhaps it will do something not seen since April – a multi-day or week reversal.
- The setup ahead of this has been laid out clearly recently, with the markets having everyone “all in,” heavily levered, tightly concentrated in the same trades, with investors incredibly complacent. If you need a review with some of the risks, here’s yesterday’s note. It’s unlocked, so feel free to share.
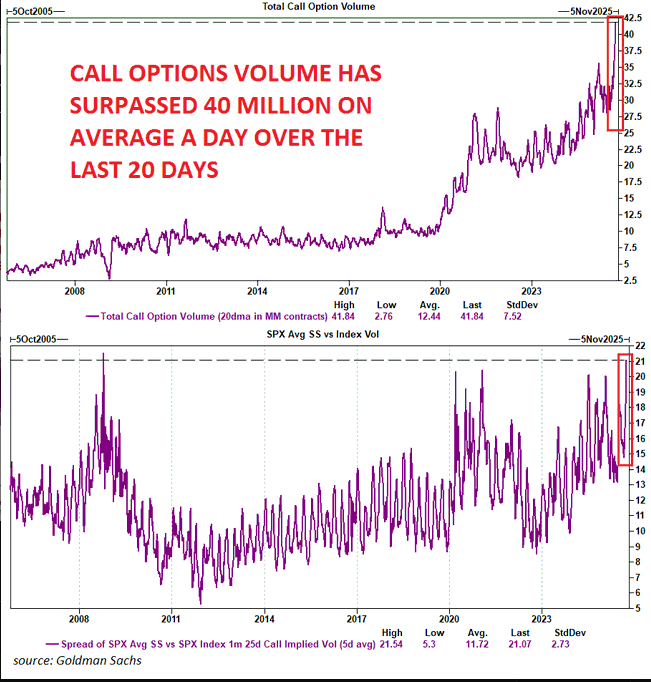
- Call options volume has surpassed 40 million on average a day over the last 20 days, according to GS. All those call buyers have seen their bets go “Poof” today.
- Levered long ETFs are having a ‘day’ too.
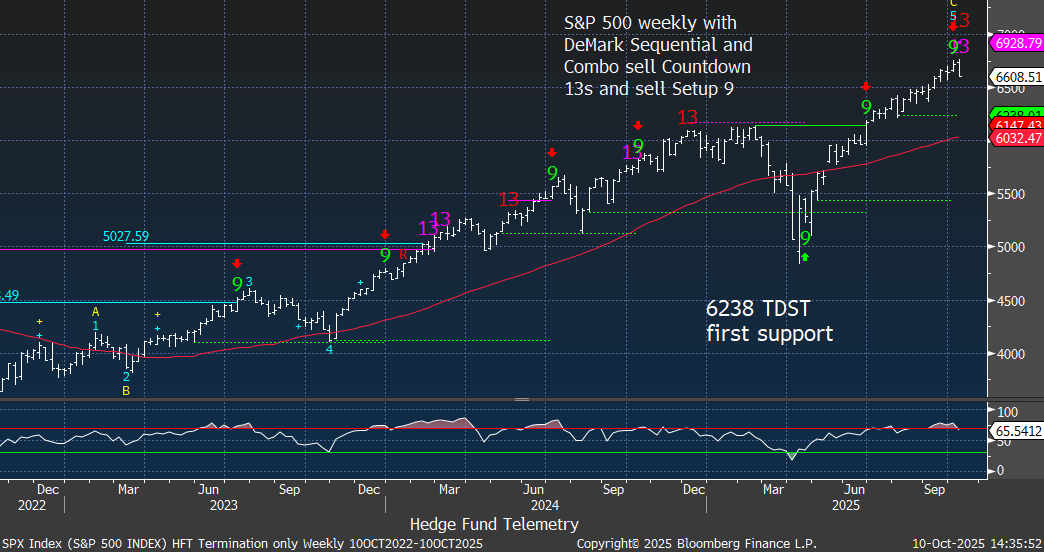
- Some may have some issues with the DeMark indicators (not working etc) but on the daily charts the numerous 13’s have seen moderate reversals or periods of pausing. These were designed to show the exhaustion of buyers, which, by definition, has occurred. Expecting them to reverse 10% each time is unrealistic and when there are several secondary Countdowns on daily I start to focus on the weekly time frames since the trend has been powerful. The weekly time frames signal infrequently vs daily. I have been highlighting the large number of weekly 13’s developing which is a more intermediate risk. I have used the indicators for 25 years and know when they are most effective and believe the weekly signals have been quite informative at significant inflection points.
- Commodities are breaking down as well. I highlighted last Sunday in the Commodity Weekly the daily and weekly Sequential sell Countdown 13s in sync. It moved up moderately enough to get the 13s primarily due to gold and metals.
- I learned a while ago from a savvy fund manager about the risks associated with when shorts get squeezed out. The GS most shorted basket is up 37% in the last 3 months. Shorts serve the purpose of being the natural buyer of stocks when markets go down. If they are not there in size, combined with the 100th percentile of just about every other investor being entirely long, the risk of something severe increases.
- So, let’s say you are confident in the markets going higher (they might, and I don’t judge); you probably will want to see a multi-day or week pullback versus another one-day drop.
- Earlier this year, I often stated that the markets don’t like tariffs. Tariffs had become something low on the list of concerns. Naturally, many expect Trump to TACO (Trump Always Chickens Out) soon. He probably will, but will China back down? China has numerous levers it can pull that the average US investor may not fully understand.
- China has reimposed restrictions on rare earths, and the Ministry of Transport has announced a new port fee for vessels with US links, including those that are US-owned, US-flagged, US-built, or have at least 25% US ownership or control. The fee takes effect on October 14, 2025.
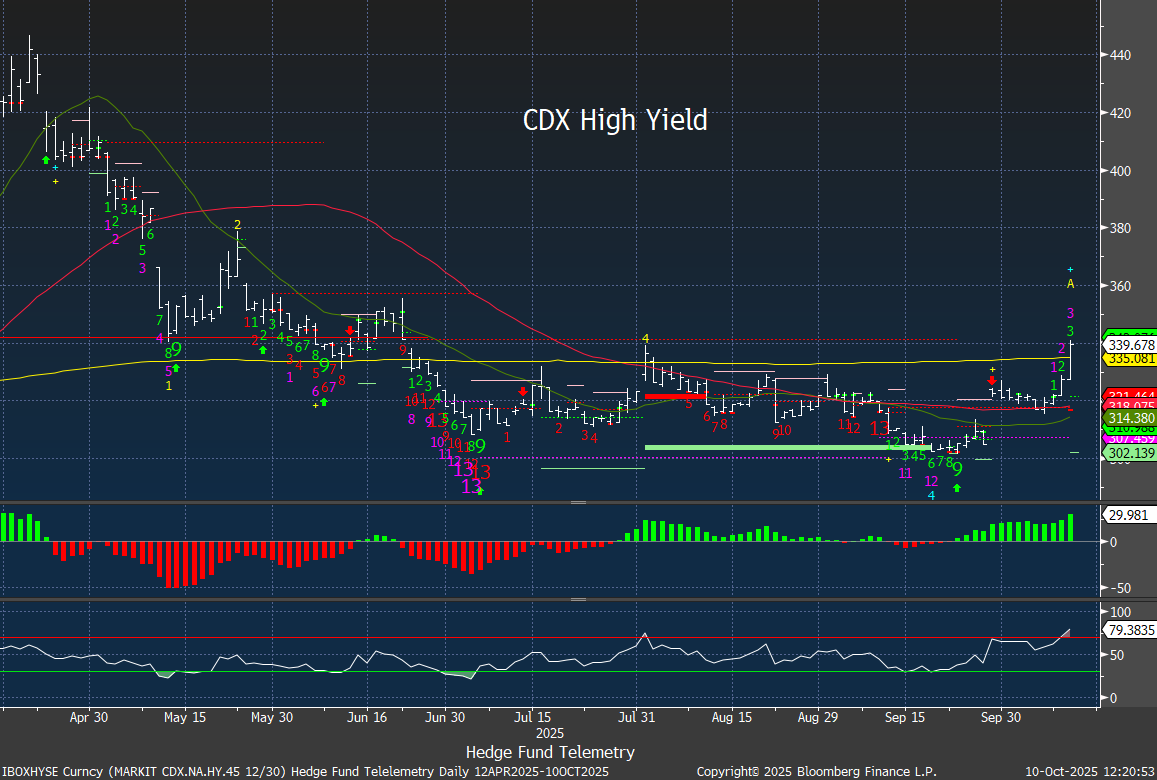
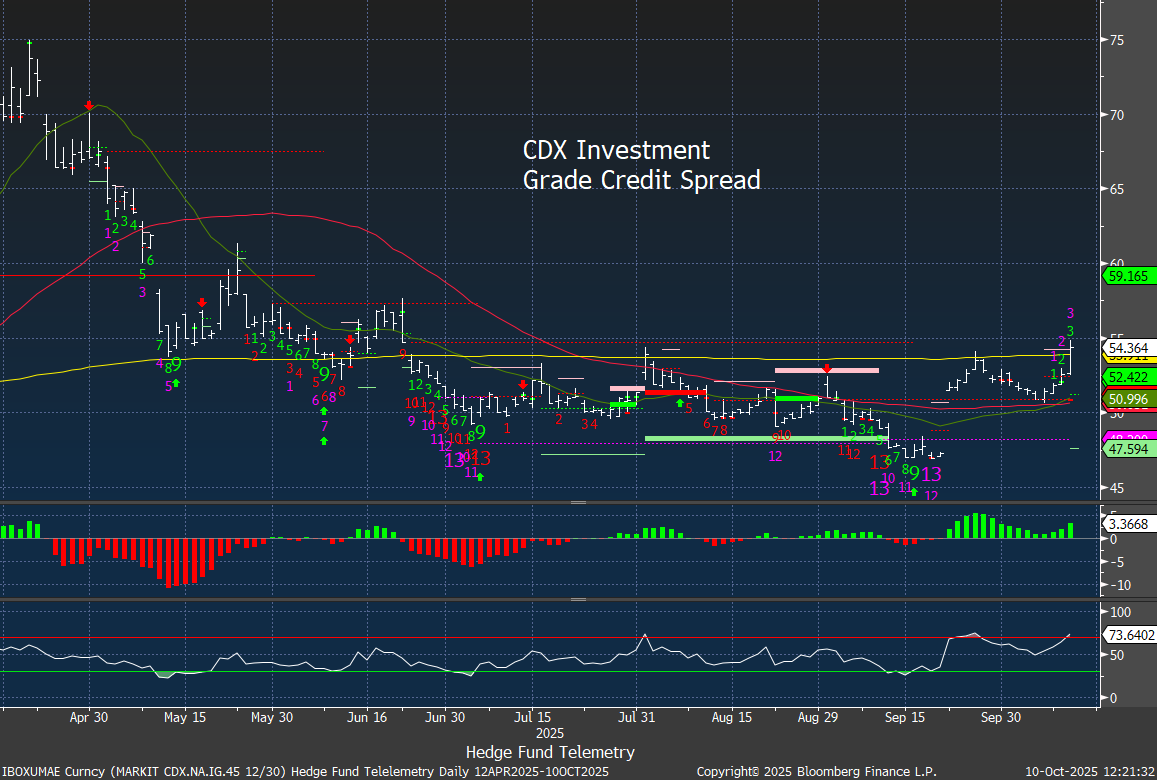
- Credit markets are seeing some stress. This isn’t a good development, and if the cockroach theory happens, there could be a real negative catalyst that would overshadow the tariff talk. There is a significant amount of credit in the system (read: leverage), especially in the private markets. I posted the CDX credit spreads and VIX below.
- How about some good news? The equity market drop has seen a bid in the Treasury market with rates lower. Many have said if you want rates lower, hit the stock market. We thought that was part of the plan earlier this year but that changed when the equity market broke 5000 and TACO trade was enacted.
- Another bit of good news is that a drop in the equity market could increase the odds for the Fed to cut by 50 basis points. A wrinkle could be if the CPI data is now scheduled for the day before the Fed announcement comes in hot.
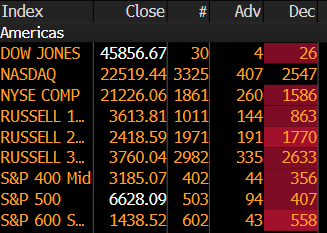
- Today’s action lacks internal strength. Breadth is, as you’d expect, very negative. NYSE down 2370 issues, Nasdaq down 2760 issues. Here are the main indices:
- Next week will be instrumental in determining whether this drop is another short-term blip or if something more significant is ahead. Earnings will start to roll out with the major banks. I would guess that the CEOs will have some questions from analysts or voice concerns about the credit stress and the general tone, which is typically “the consumer is fine,” might shift to “we are seeing some consumer stress.”
- I have some additional thoughts on the charts below, and I will conduct a damage assessment with internals in the Week Ahead on Sunday. I want to thank everyone for their support. It’s when markets become volatile that our work truly shines and creates value for our subscribers.
Quick Market Views
Stocks: Ugly action with a flight to consumer staples and utilities safe havens. Every other sector is down over 1% led on the downside with tech and consumer discretionary down over 2.5%.
Bonds: Rates are lower down ~8bps with a risk off type move into bonds. (Haven’t seen this for a while)
Commodities: Bloomberg Commodity index is down 1.5%. Natural Gas down 5.2%, Crude down 4%, Grains down over 1%, Copper down 4.25%, Gold up 0.75% and Silver off highs but up 0.3%
Currencies: Dollar Index is down 0.5% stalling at the resistance I’ve discussed for months. Bitcoin down 3.3% and crypto all down hard.
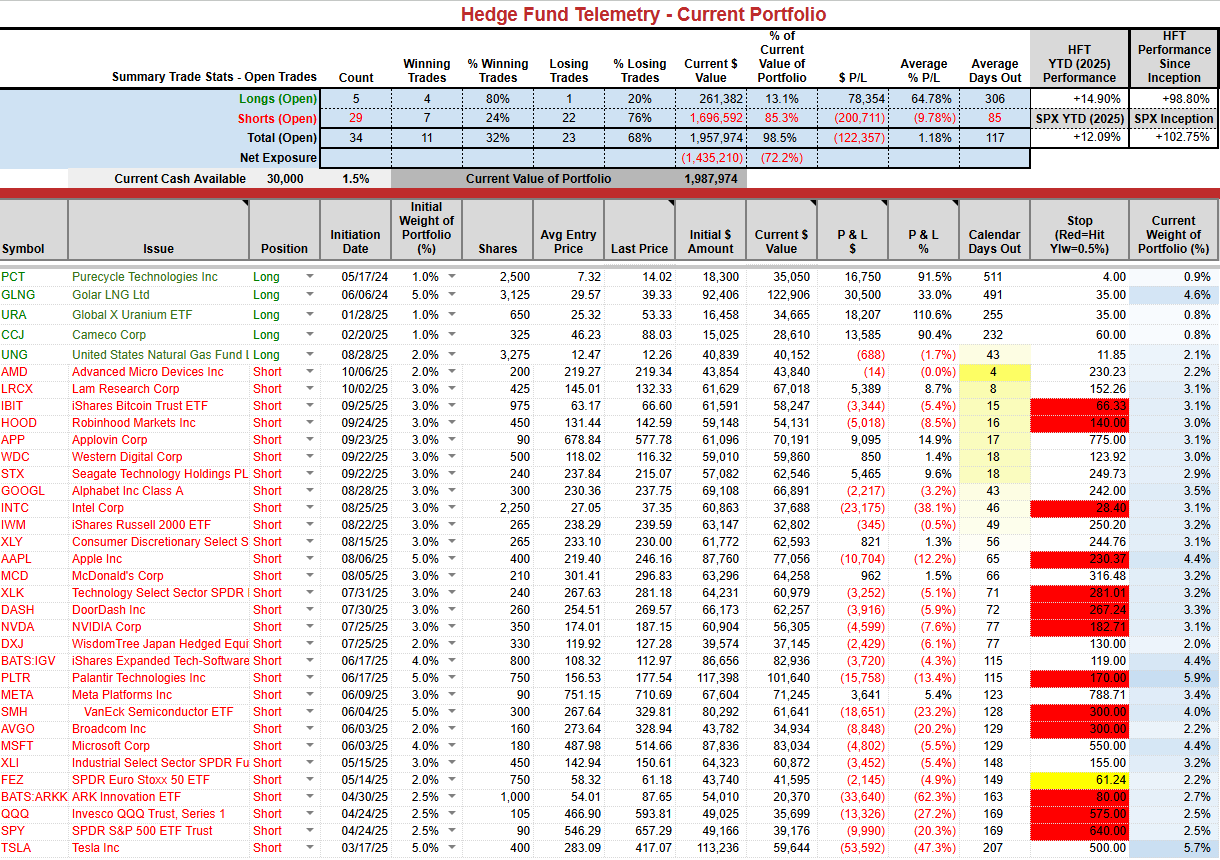
Current Portfolio Ideas: Strong bounce with PNL today with +14.9 YTD vs S&P +12%
Changes: MCD appears to be a safe haven, so I’ll cover the short with a 2% gain.
Thoughts: If you added the recent SPY and QQQ put spread added on September 12th. I recommended the October 17th expiration SPY 650-635 put spread for $2.75 and is now $2.20 and the QQQ 580-562 put spread for $3.80 and is now $2.00. I still like these trades and could turn profitable with a leg down next week, provided there’s a slight nudge lower.
US INDEXES
S&P futures 60-minute tactical time frame was moving sideways with several DeMark sell Countdowns. The TDST Setup Trend first support at 6764 broke in a big way and also qualified (a DeMark thing) turning to solid red from green dotted.

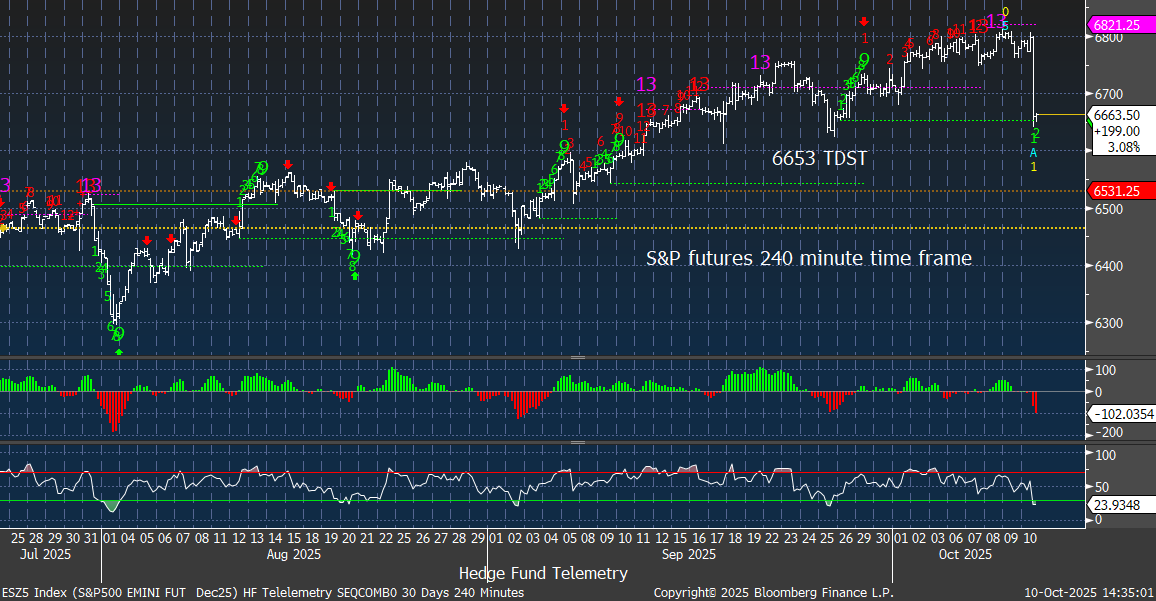
S&P futures 240-minute tactical time frame had recent Sequential and Combo 13s now dropping right to the TDST Setup Trend support at 6653. If you notice the move up, you saw the other TDST support lines hold or not even approached, so this is potentially important. I like the 240 minute charts as the 13’s are rare and looking at the TDST support lines informative.
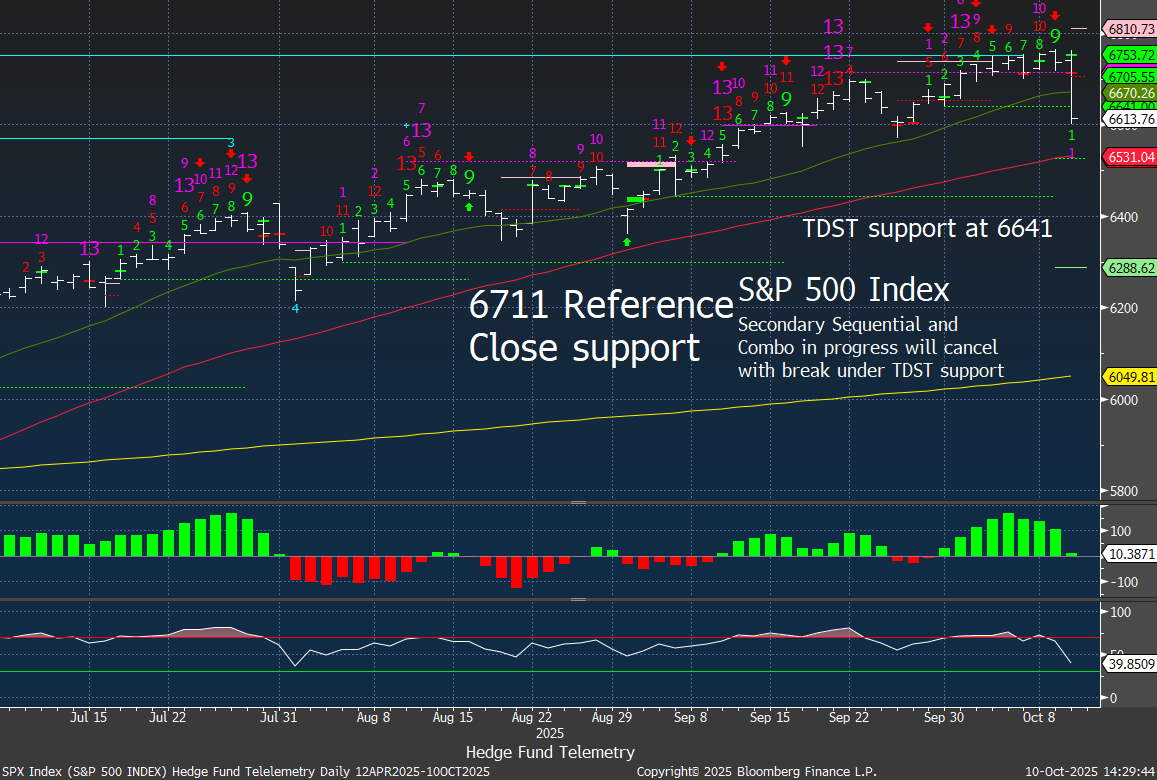
S&P 500 Index daily might cancel the upside pending Countdowns with a break of the TDST Setup Trend green dotted line. Big price flip down (green 1) and under the 20 day with 50 day in sight at 6531.
S&P 500 weekly with DeMark Sequential and Combo sell Countdown 13’s.
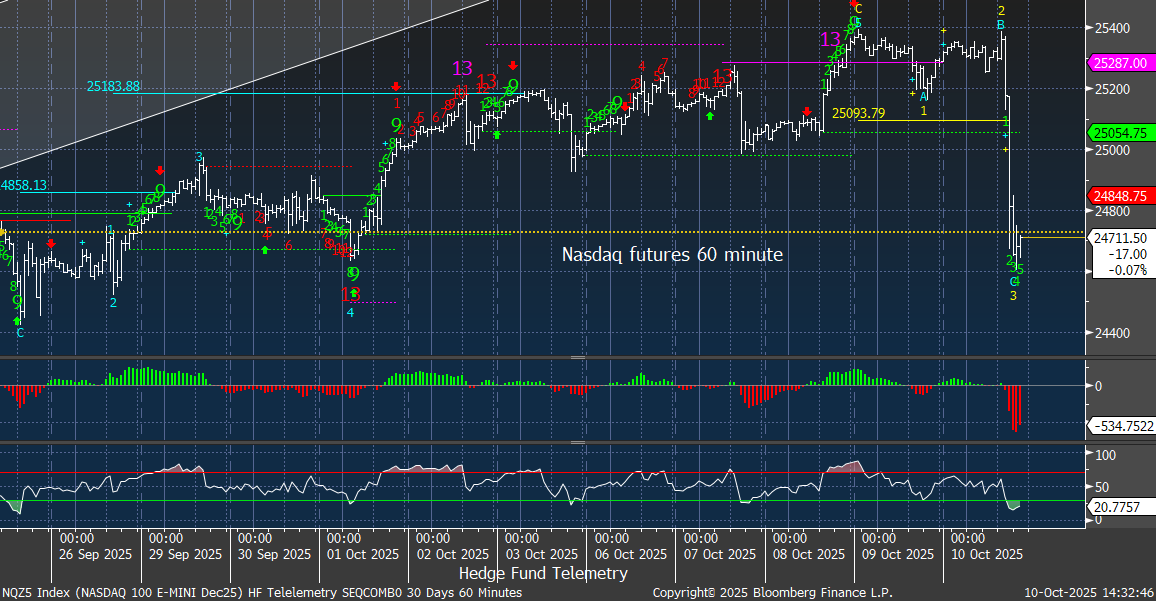
Nasdaq 100 futures 60-minute tactical time frame well below the TDST support at 25,054
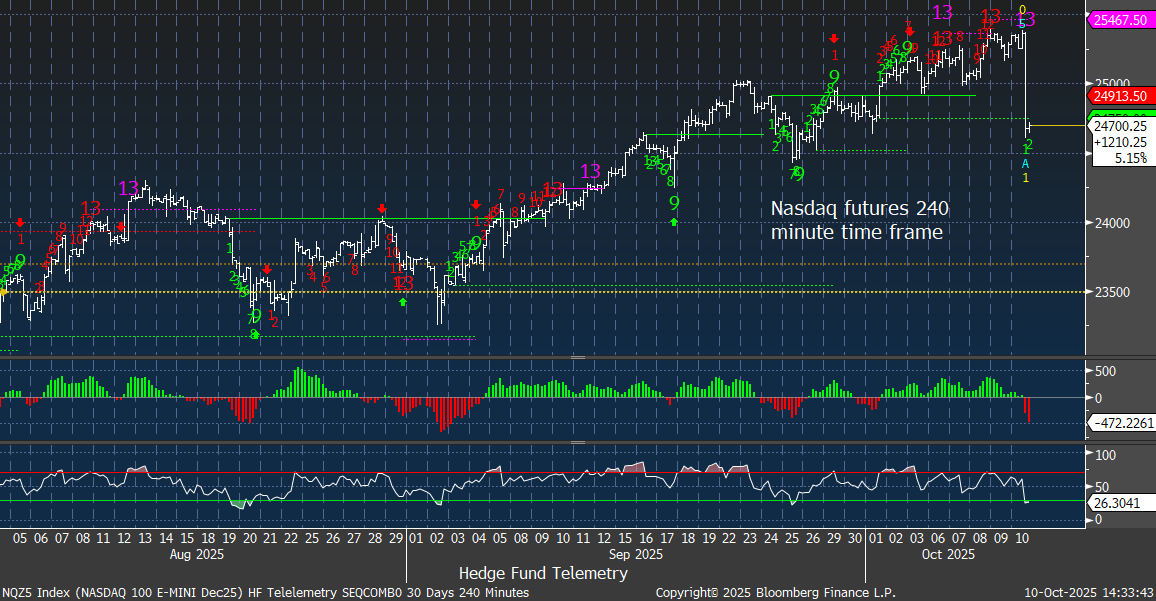
Nasdaq 100 futures 240-minute tactical time frame slightly below the TDST support after recent Sequential and Combo 13s
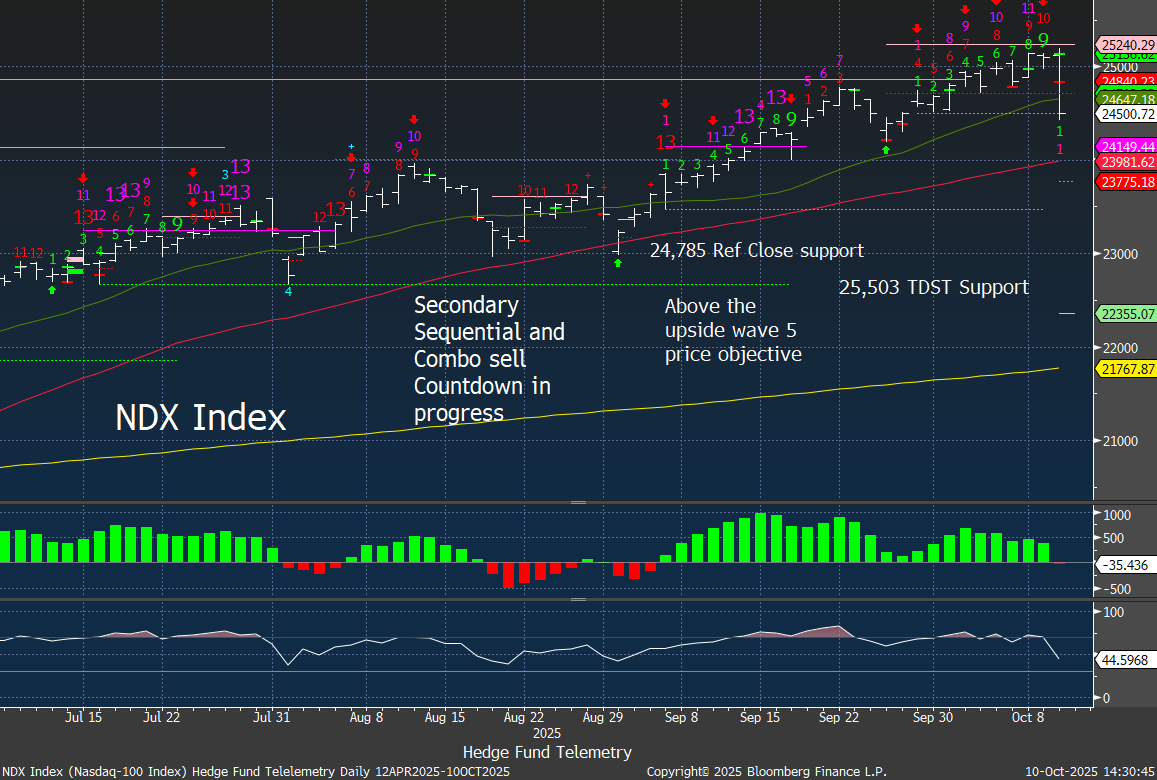
Nasdaq 100 Index daily with price flip down (green 1) at the TDST Setup Trend line now. Below the 20 day with 50 day at 23,981 possible
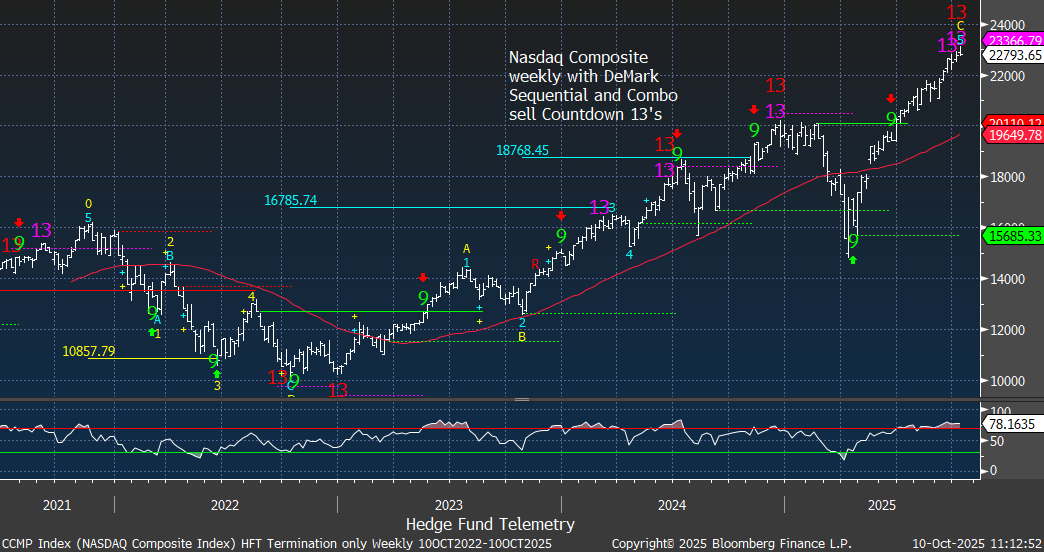
The Nasdaq Composite (the big index) weekly with Sequential and Combo 13’s. Other signals worked well at inflection points
Current Portfolio
Pre change
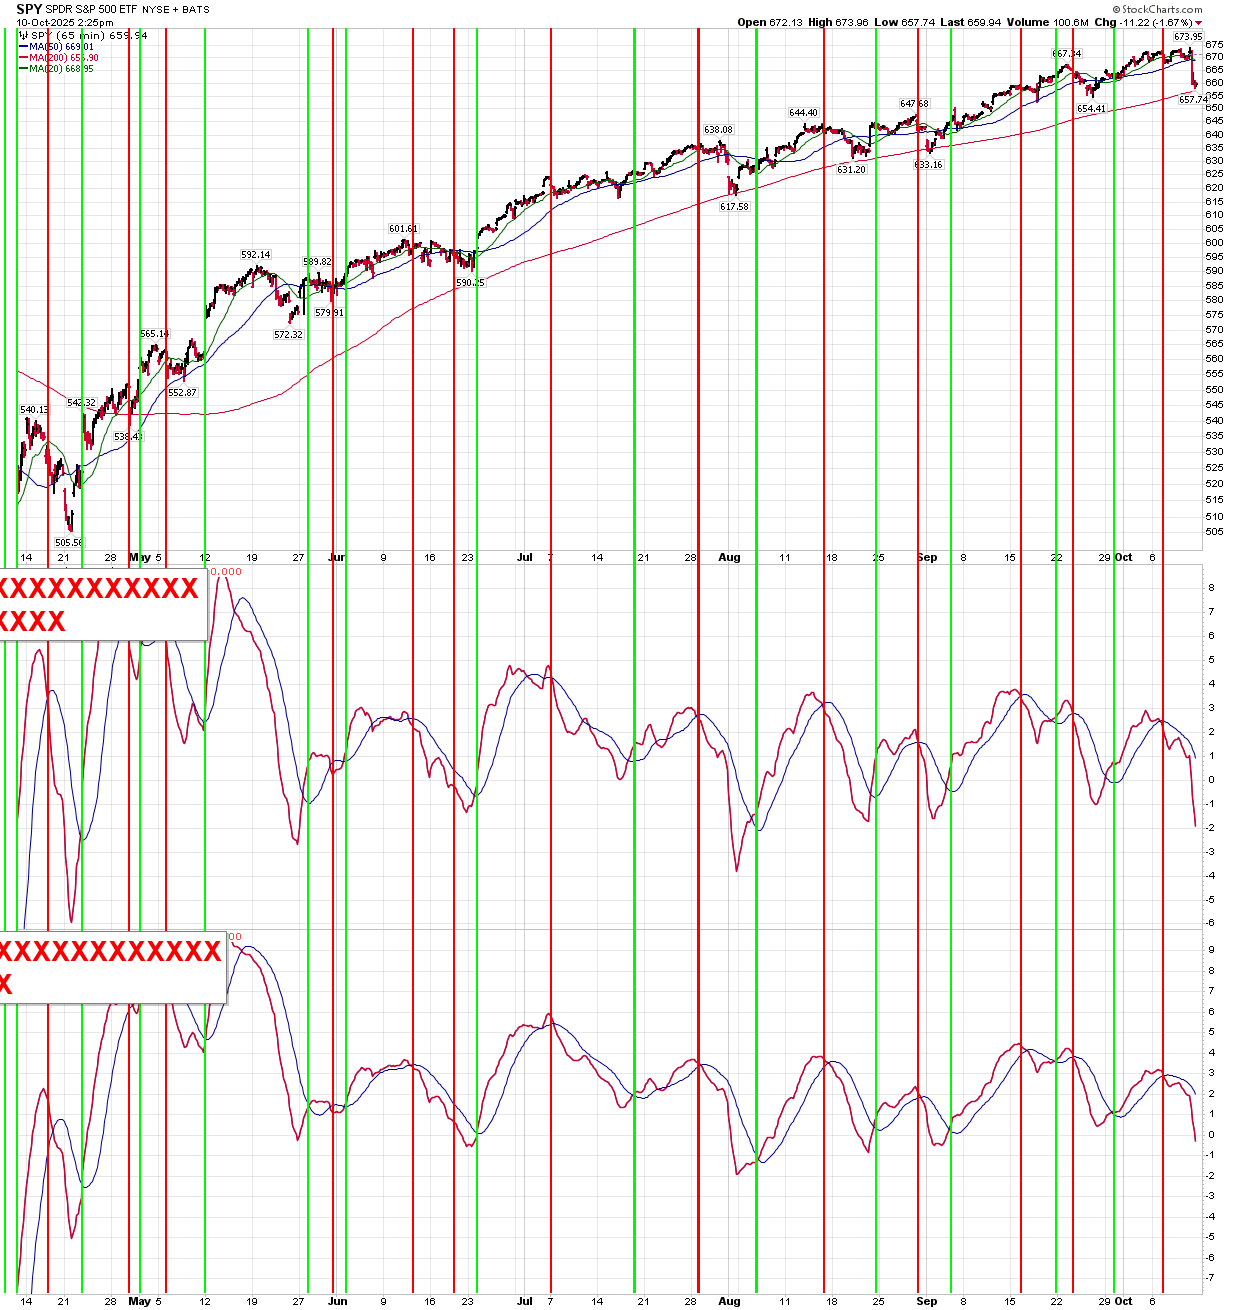
The short-term SPY and QQQ momentum shifted back to sell recently, with the price nearing the 200-bar (65-minute) moving average. A break of this level would be informative.
Charts to watch
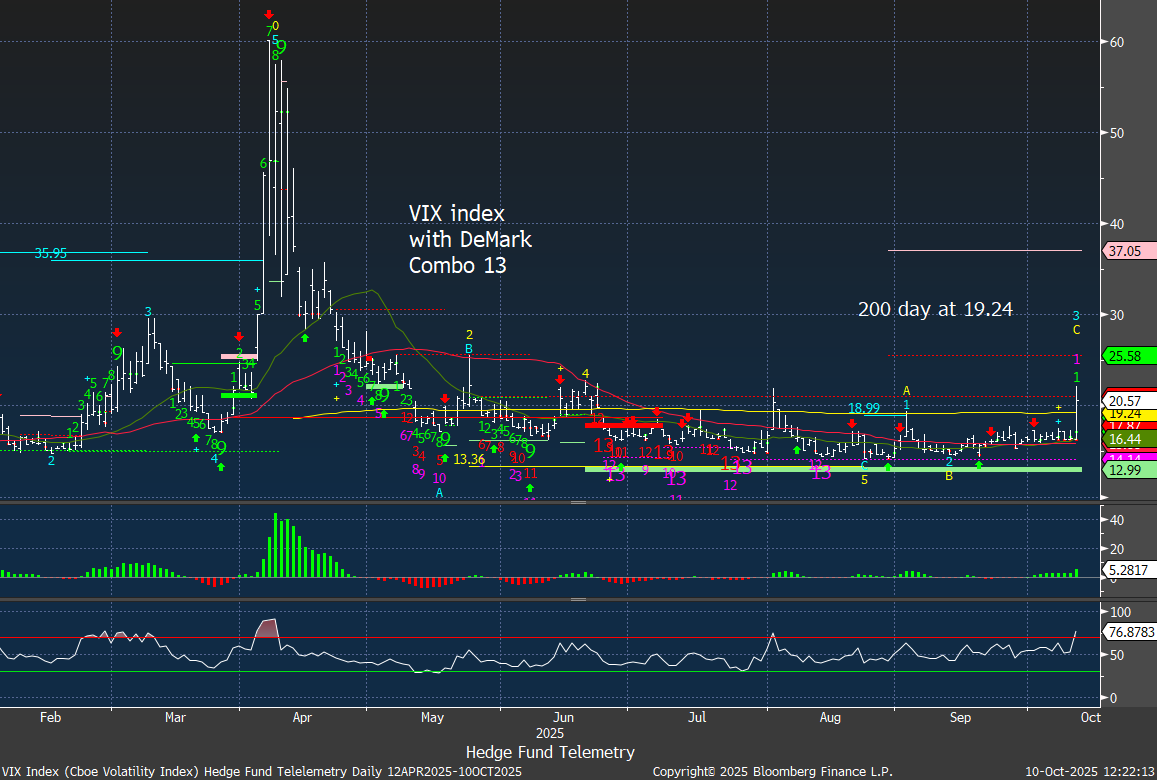
VIX index is above the flat 200 day (yellow line) this was something I discussed on the last market update webinar. A few one off short lived spikes have quickly calmed down from May. If this continues into next week expect a deeper market correction. Remember the AUM of the vol selling funds has moved up significantly so the risk if this continues a lot of the complacent volatility sellers could have a really bad day.
CDX Credit Spreads are widening (going up on chart). This is a sign of stress and when this happens equity markets tend to sell off. A few one off short lived moves have happened so if this continues expect more concerns. I’ll update next week
Investment Grade
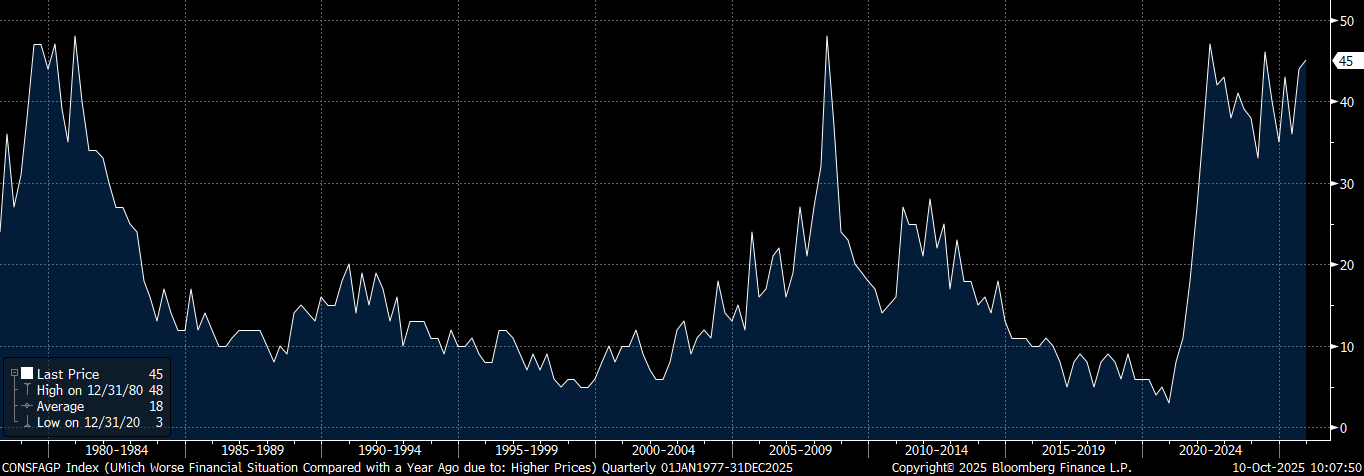
This is the Univ of Michigan “worse financial conditions” and this is due to inflation and prices remaining high.
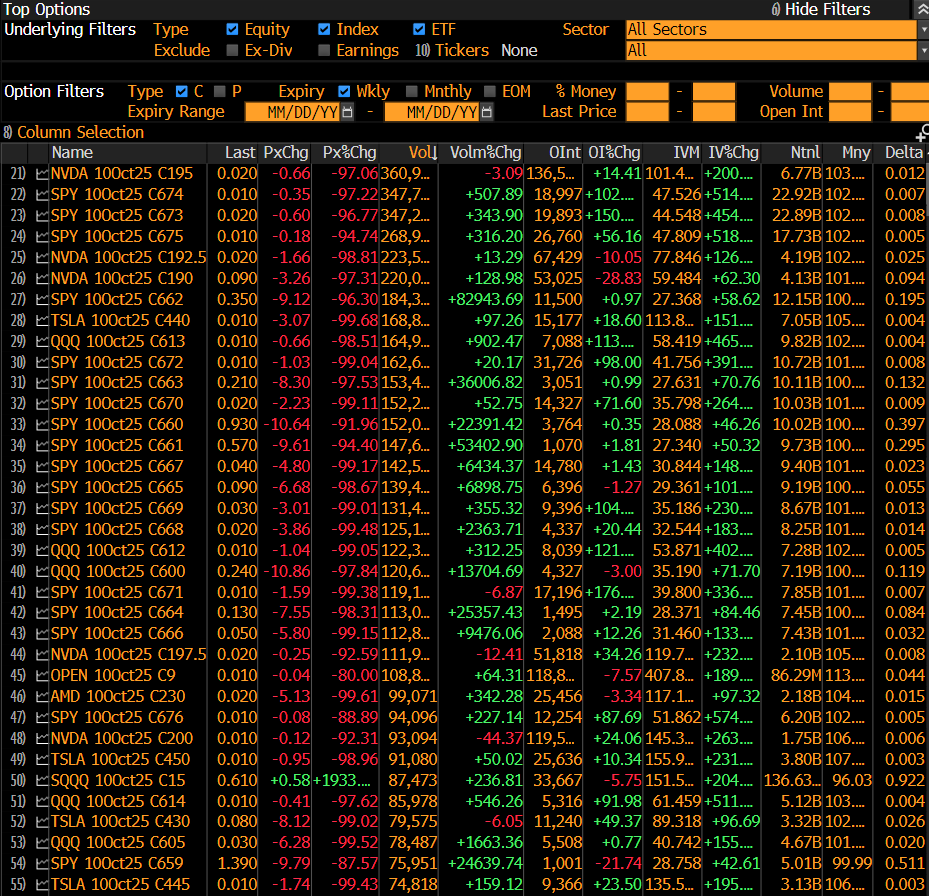
I showed how the short term 0DTE options trading has been massive yesterday. Look at the call option volume!
Meanwhile, it’s not a happy day for the weekly call buyers whose contracts expire today.
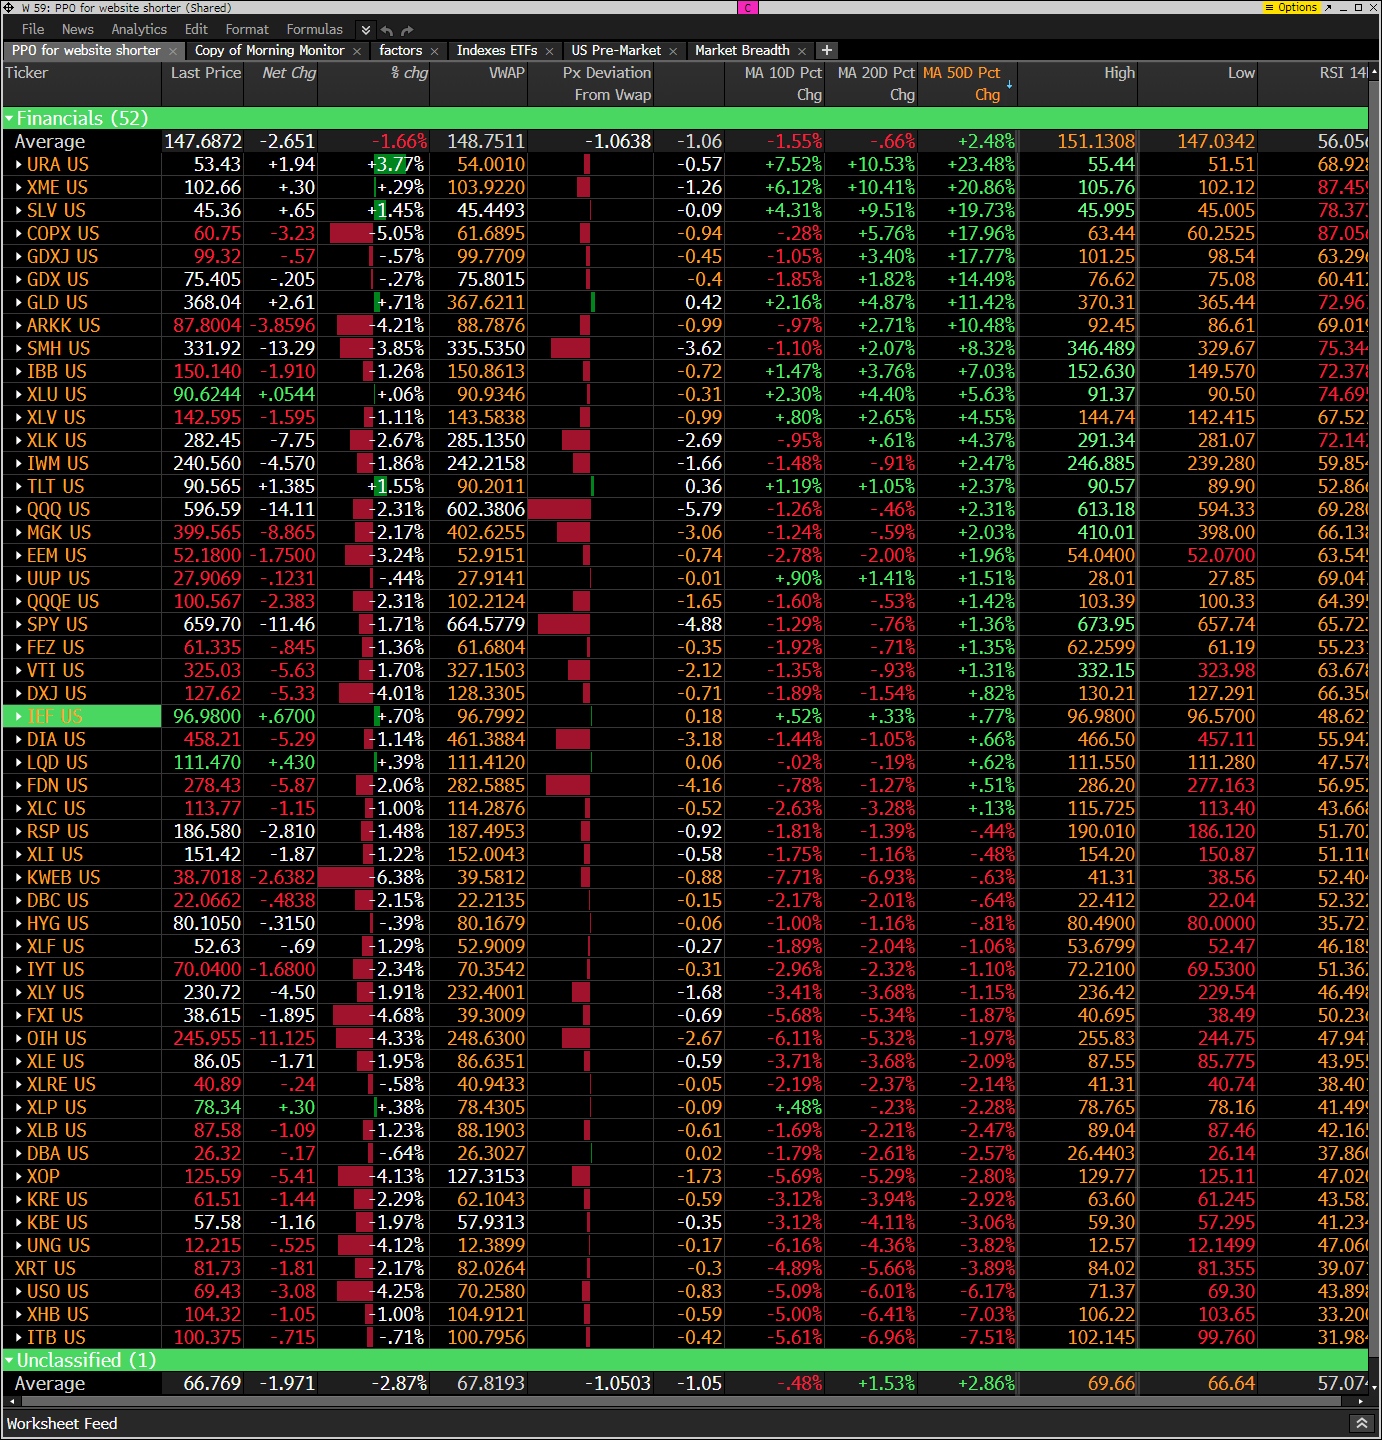
Hedge Fund Telemetry ETF Percentage Price Oscillator Monitor
The PPO monitor (percentage price oscillator) force ranks ETFs by percentage above/below the 50-day moving average. This monitor and others are offered to Hedge Fund Telemetry subscribers on Bloomberg. URA is up which is incredible. We are up over 110% on the remaining long position. The number of ETFs below the 10 and 20 day moving average has increased with nearly half now below the 50 day. A lot of new 20 day lows (red numbers under the column ‘low’) Some also hit 20 day highs but dropped after the Trump tweet.
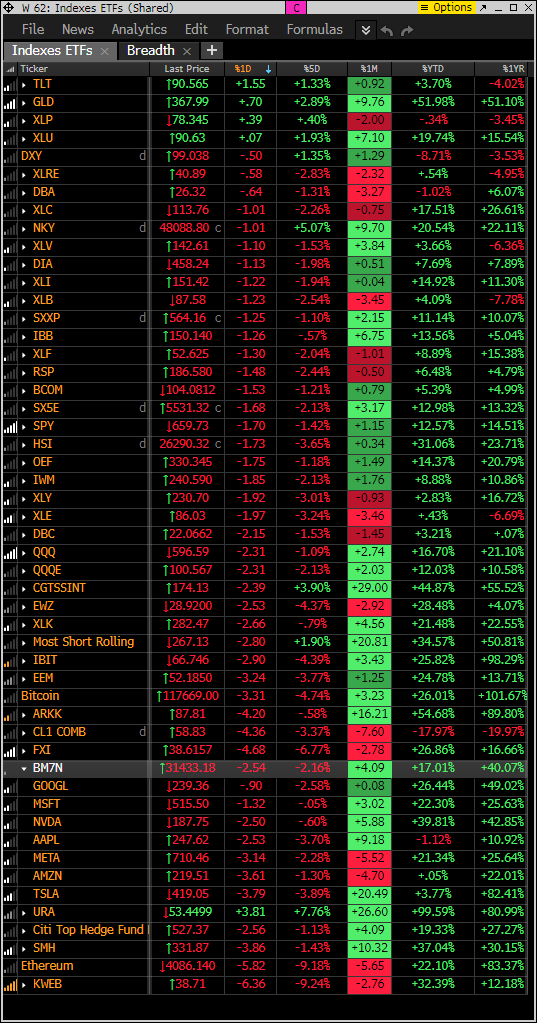
Index ETF and select factor performance
ETF with today’s performance with 5-day, 1-month, and 1-year rolling performance YTD. 5 day performance negative ex defensive ETFs
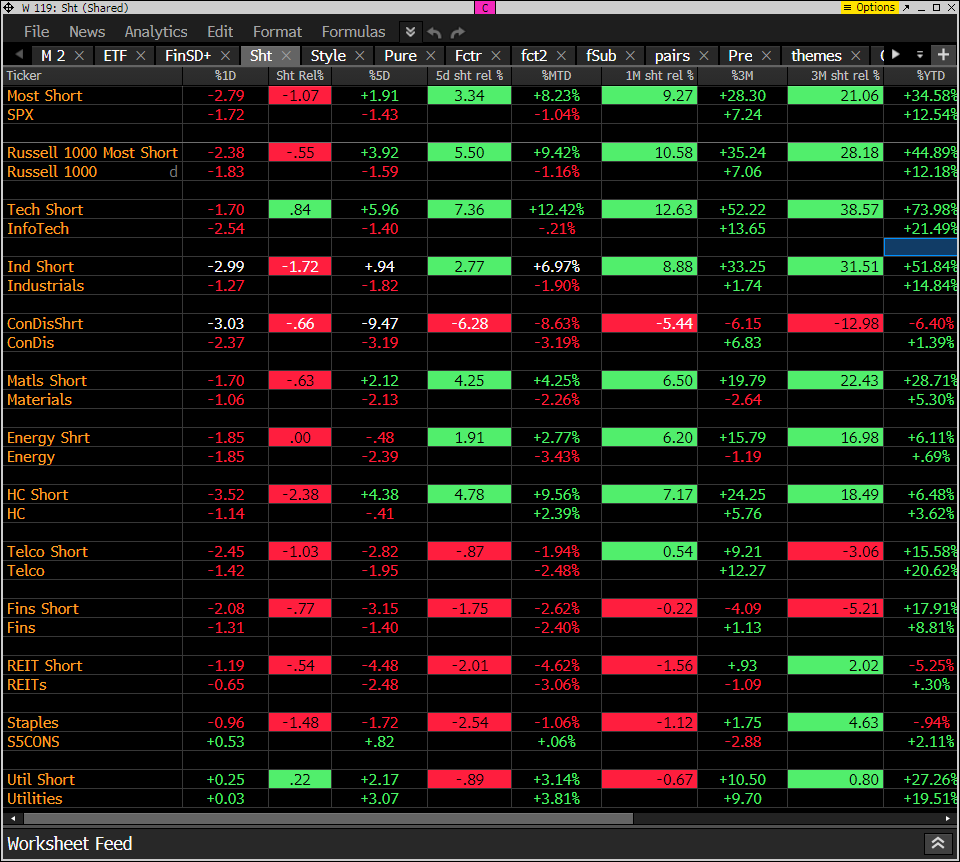
Goldman Sachs Most Shorted baskets vs. S&P Indexes
This monitor has the S&P indexes and the Goldman Sachs most shorted baskets. Short baskets down but I would think lower
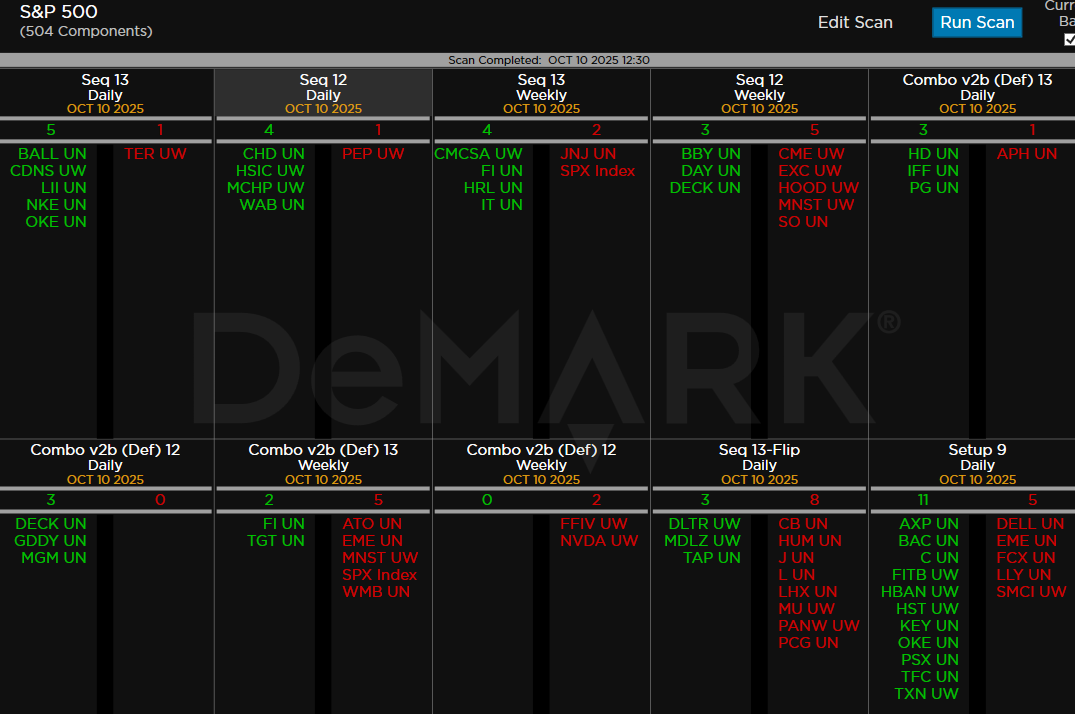
DeMark Observations
Within the S&P 500, the DeMark Sequential and Combo Countdown 13s and 12/13s on daily and weekly periods. Green = buy Setups/Countdowns, Red = sell Setups/Countdowns. Price flips are helpful to see reversals up (green) and down (red) for idea generation. The extra letters at the end of the symbols are just a Bloomberg thing. Worth noting: Starting to see some buy Countdown 13’s develop on stocks that have been in downtrends. A bi-furcated market.
Major ETFs among a 160+ ETF universe.
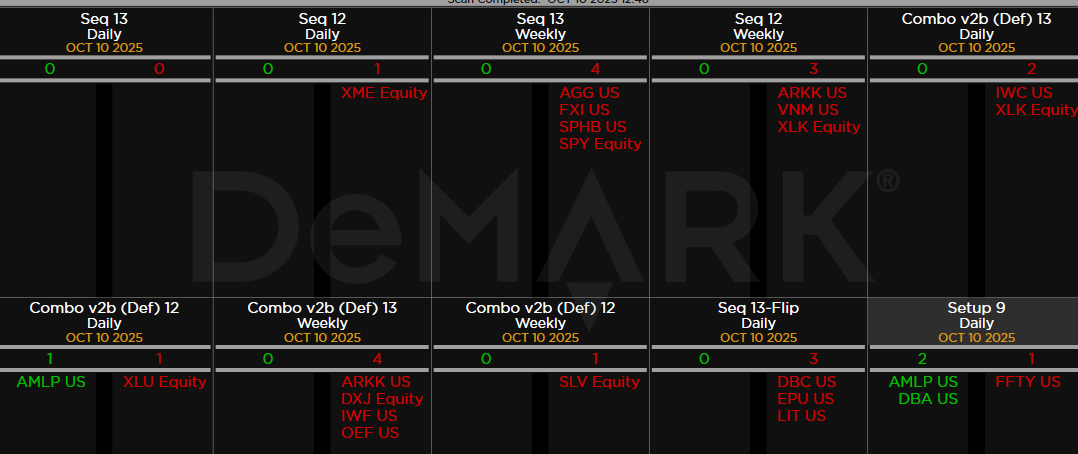
If you have any questions or comments, please email us. Data sources: Bloomberg, DeMark Analytics, Goldman Sachs, Street Account, Vital Knowledge, Daily Sentiment Index, and Erlanger Research