

Soybean farmers will soon be ordering Lamborghinis and Ferraris, as Trump has secured a deal for China to buy US soybeans. Traders were hoping for an agreement for China to buy Nvidia’s Blackwell chips, but I suppose that will have to wait.
Trump’s meeting with Xi is now behind us, and Trump has called it “amazing and a ’12′”. My friend Le Shrub posted this picture earlier, and much like the Spinal Tap guitarist saying his amps go up to 11, Trump seems very happy with his meeting to one-up Spinal Tap. The markets perhaps have bought into this meeting in advance, and it’s not quite a “12” even with Trump lowering tariffs by 10%.
Or the market is looking at META, which said it would spend even more in 2026, and it isn’t surprising, as Mark Z has said they would continue to spend more previously. Mark has, in the past, overspent, and the market didn’t see the Metaverse opportunity the way he did. OpenAI said it plans to go public in 2027 with a market cap of $1 trillion. That got some people excited, however, it will come down to showing some ROI and revenues, and that is more fugazi at this point.
Or the market expected and got the Fed to cut rates by 25bps, and that wasn’t enough? Powell said a cut in December “wasn’t a foregone conclusion,” which is actually reasonable given that the government is shut down. There’s little, if any, economic data, and YoY inflation remains at 3%. It’s sensible, since the Fed is data-dependent—as it should be—and not a stock-market-pumping meme agency.
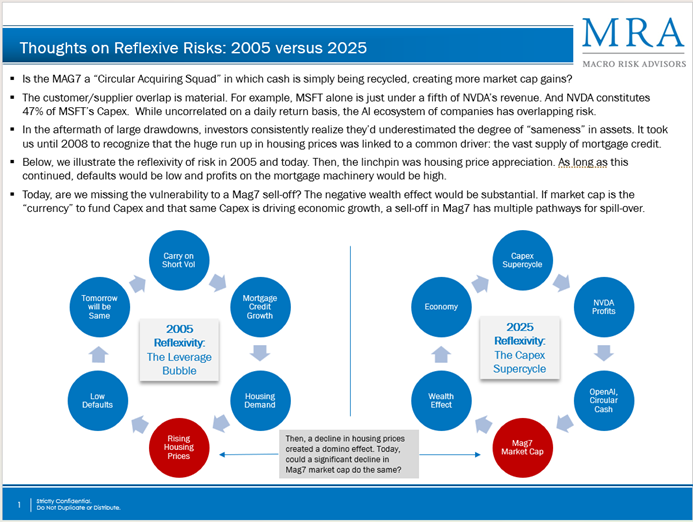
I’ve discussed the risk of narrow concentration, leverage, and complacency plenty of times within the Mag 7. The dependence on this to keep partying like 1999 long into the night matters. It’s different from the tech bubble, and some will say today’s leaders make a lot of money and are not overvalued like 1999. They are all trading at elevated multiples individually, with multiple expansion requiring more E in the PE equation. The risk is nicely laid out by my friend Dean Curnutt, founder of Macro Risk Advisors. He compares the housing bubble dependence on rising house prices with the rising Mag 7 market cap. Dean is one of the better strategists – focused on derivatives. If you don’t have coverage there, let me know, and I can hook you up. I think this analysis is “awesome” and a “12.” Thank you, Dean, for allowing me to share this!
The government shutdown continues on day 30, and it hasn’t been that big of a deal; however, stories of government workers going to food shelters and FAA air traffic controllers at risk of walking out are getting increased attention, affecting more people, such as those planning on flying somewhere. The dysfunction in the US government is embarrassing. I get both sides’ sticking points, and they have validity, yet a bigger issue for me (as a Cassandra of sorts) is the continued out-of-control spending and the increasing debt levels, which are rising at a rate of $1 trillion per quarter. Kicking the can down the road as a strategy seems to keep politicians in power until the next election.
Speaking of power, Elon Musk’s demand for $1 trillion in compensation goes to a vote next week. I expect it will pass. Elon Musk has claimed it’s not about the money, but he wants to increase his voting power to 25% of the company so he can “control his Optimus robot army” (his actual quote, not mine, since I couldn’t make that up). A lot of people have wondered why the company can’t just issue a new class of voting stock, since $1 trillion is a lot to pay a part-time CEO at a company with declining sales over the past 2 years. It’s tricky, and the company says they can’t do it, but it’s been done before. Is it just about control or money? Matt Levine examines this in his latest piece. Scroll down towards the end of the piece.
A few more Mag 7s are reporting today, and I have earnings previews.
Quick Market Views
Stocks: Today the risk on sectors are weaker while the defensive sectors are showing some life. Overall breadth is down with both NYSE and Nasdaq down ~1000 net issues. S&P has positive breadth for the first time in several days. 305/198 up down. Short baskets are quiet with some squeezing in the defensive sectors – notably energy.
Bonds: Rates are higher but off earlier highs. Not the direction the Fed and Treasury want to make their job easier.
Commodities: Natural Gas is up 4.2%. Crude is flat, Grains mixed with Soybeans up 1.1%, Copper down 3%, Gold up 0.5% back above 4k, Silver up 1.6%
Currencies: US Dollar index is up 0.3% above the TDST resistance line. Let’s see if it can continue. Bitcoin is down 2.7% at 107k. I’d say if this breaks 100k then it could motivate sellers (and margin clerks).
Current Portfolio Ideas: PNL bounce today and I’d like to keep that going.
Changes: The SPY and QQQ short term momentum turned back to sell as I mentioned it was close yesterday. I’m holding AAPL and WDC short and will be clutching a rosary that lost some beads after last nights World Series game.
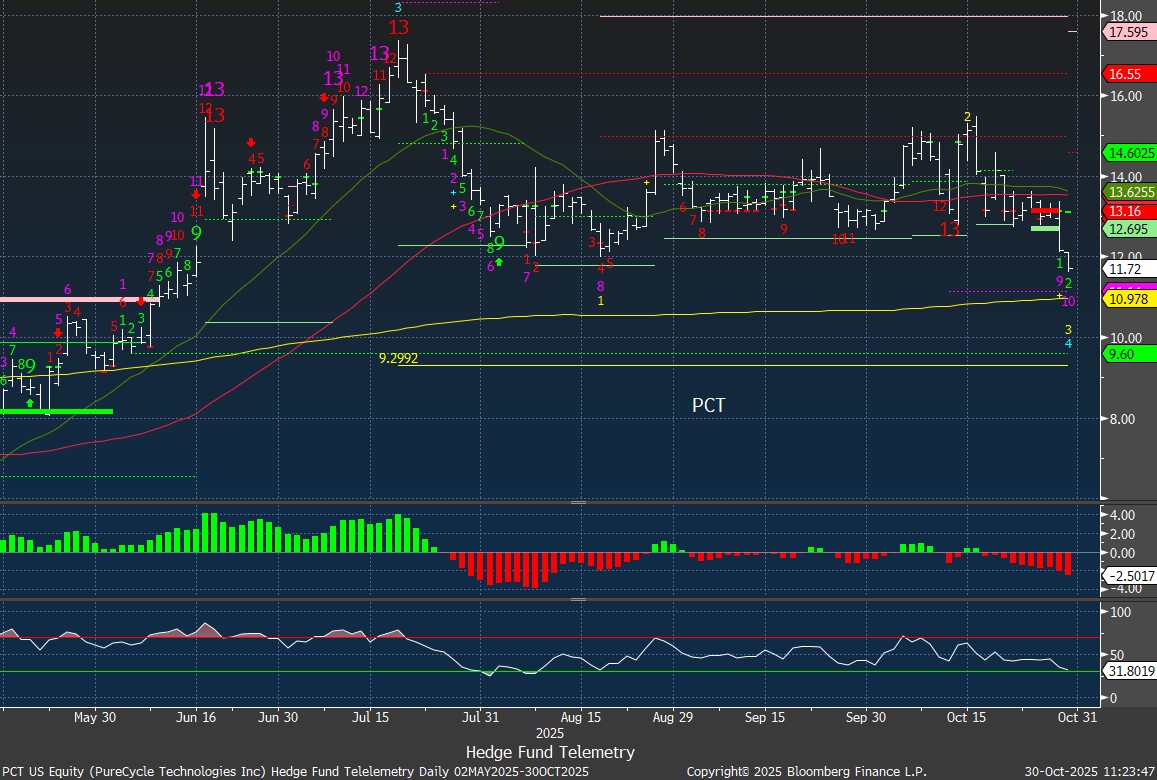
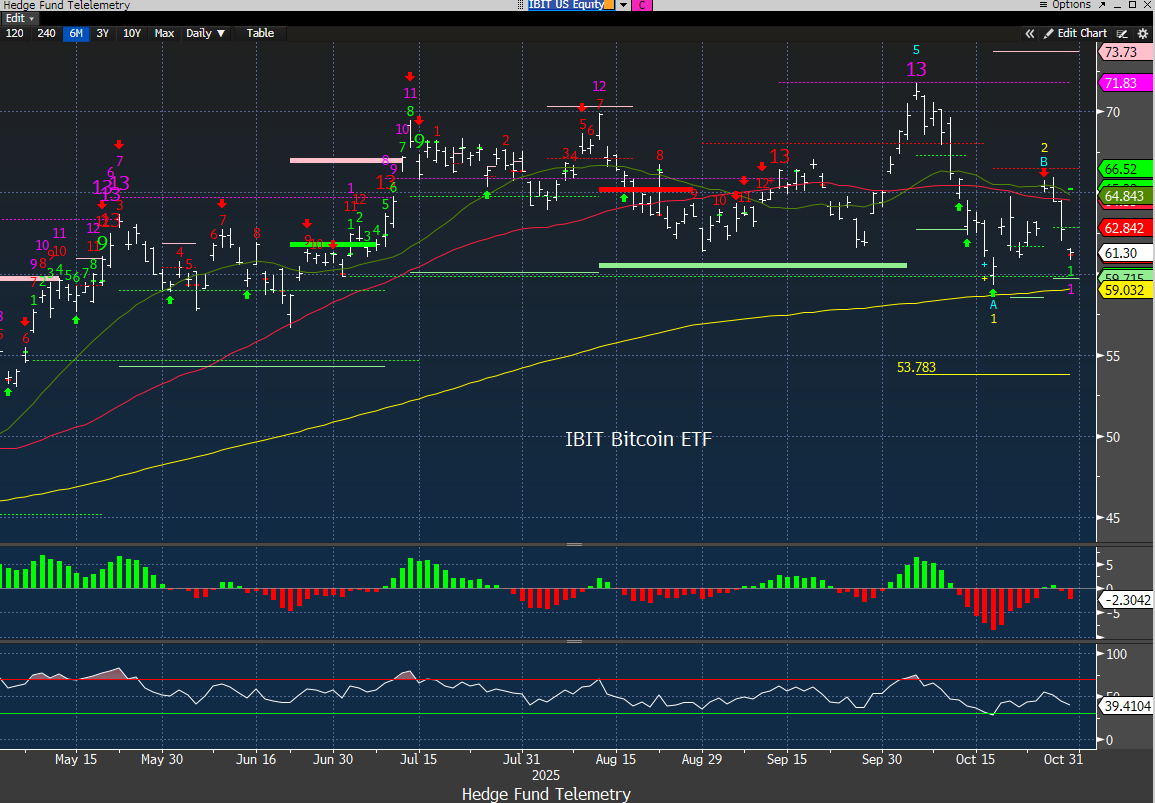
Thoughts: PCT is dropping and I have a very small position and monitoring for a re-entry long. GOOGL faded off highs and is up 3% as I figured it might after the pop. IBIT remains a short as it has support at 60.
US INDEXES
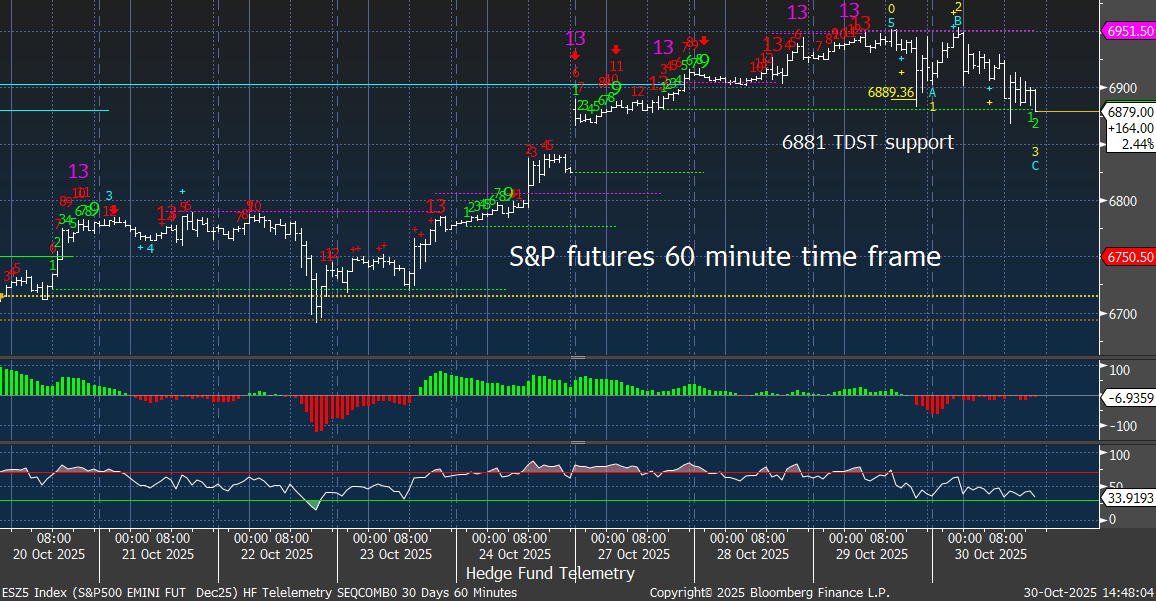
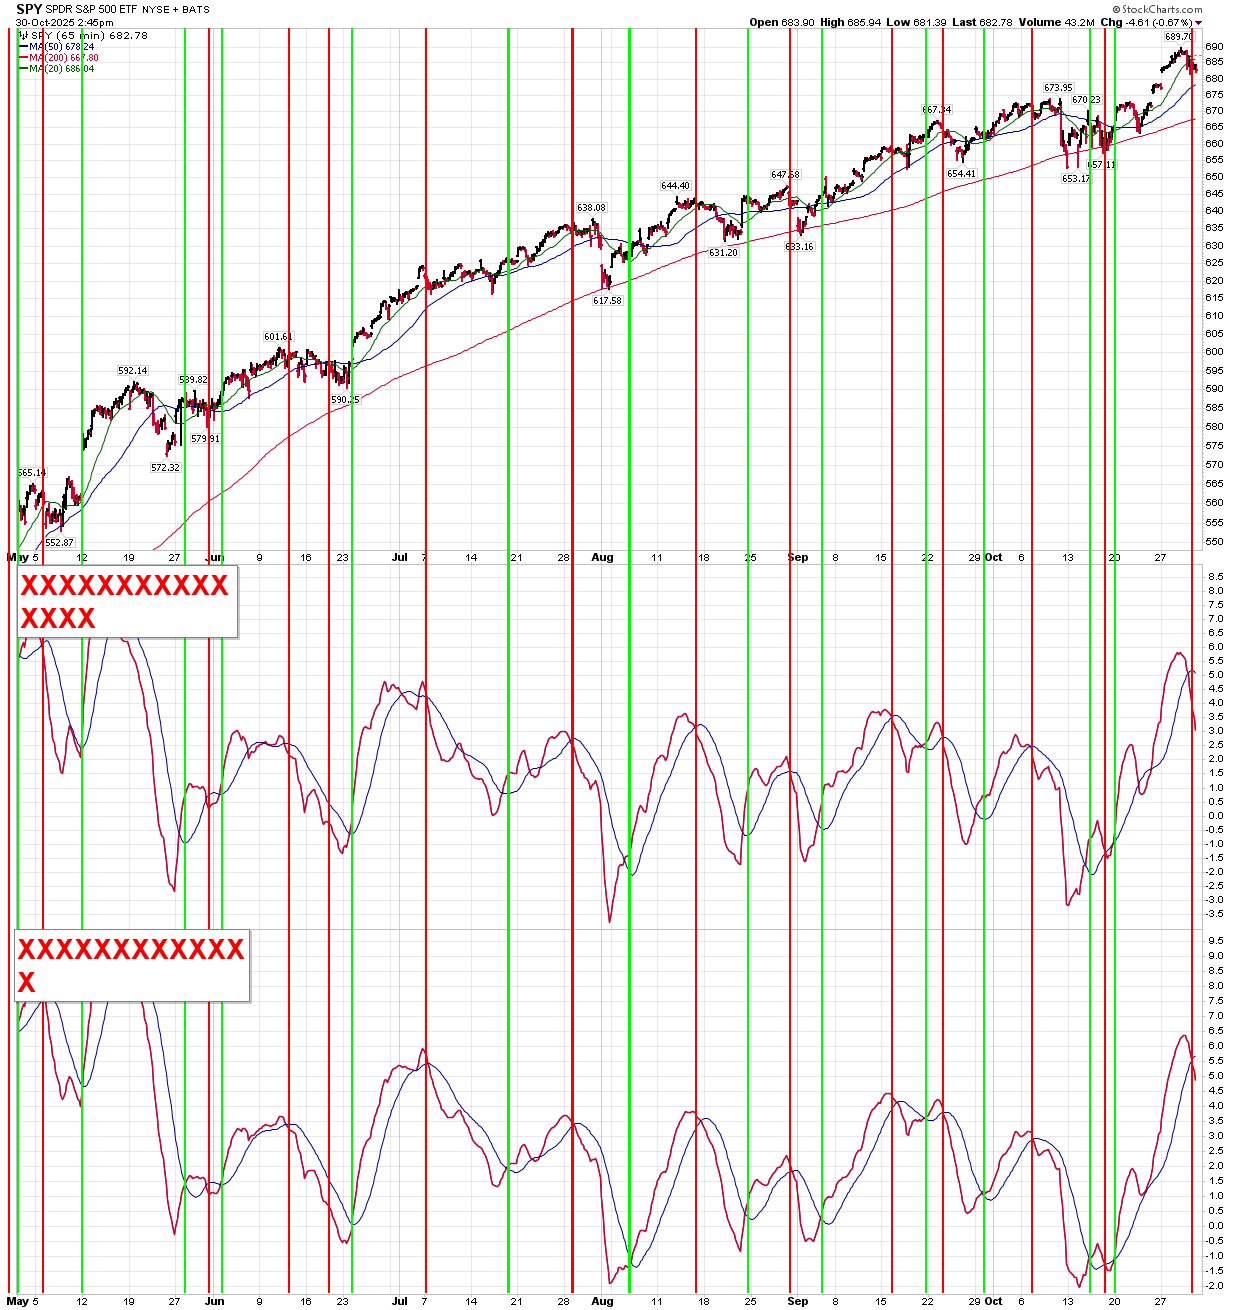
S&P futures 60-minute tactical time frame at the TDST Setup Trend support
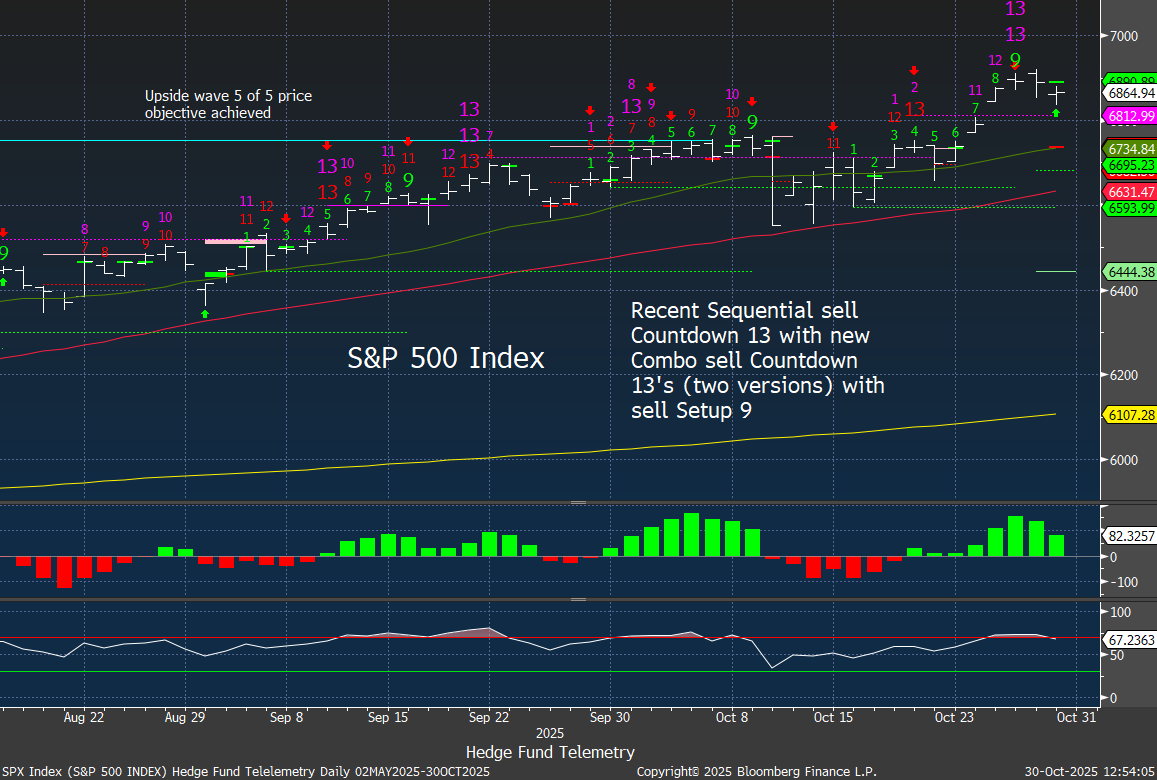
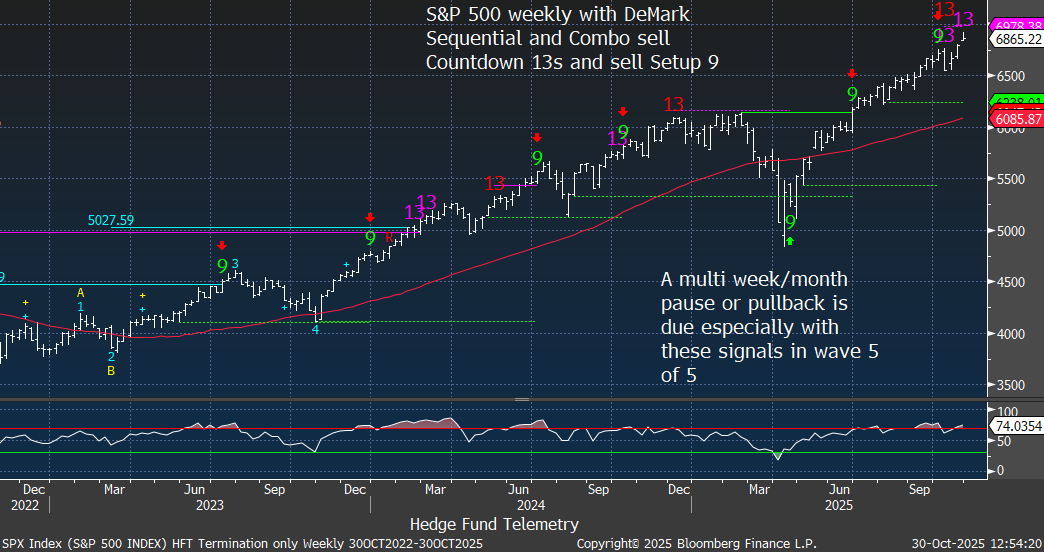
S&P 500 Index daily and weekly with recent DeMark sell signals in play
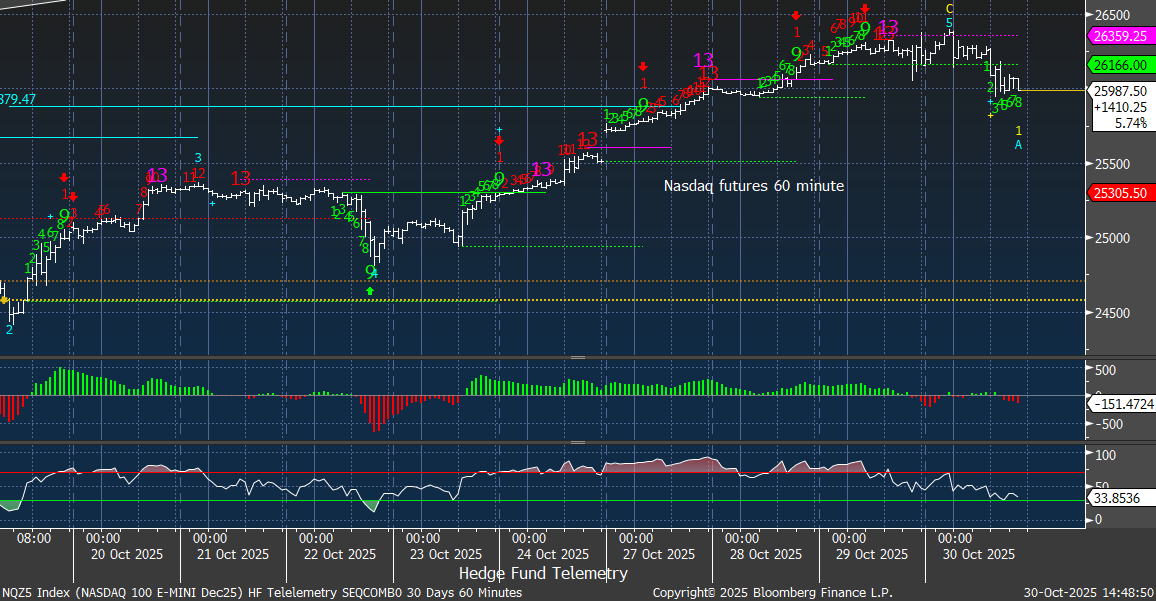
Nasdaq 100 futures 60-minute tactical time frame broke the TDST support with Setup on hour bar 8 of 9. Continuation lower will see the start of a new Sequential and yes there is potential for a bounce too
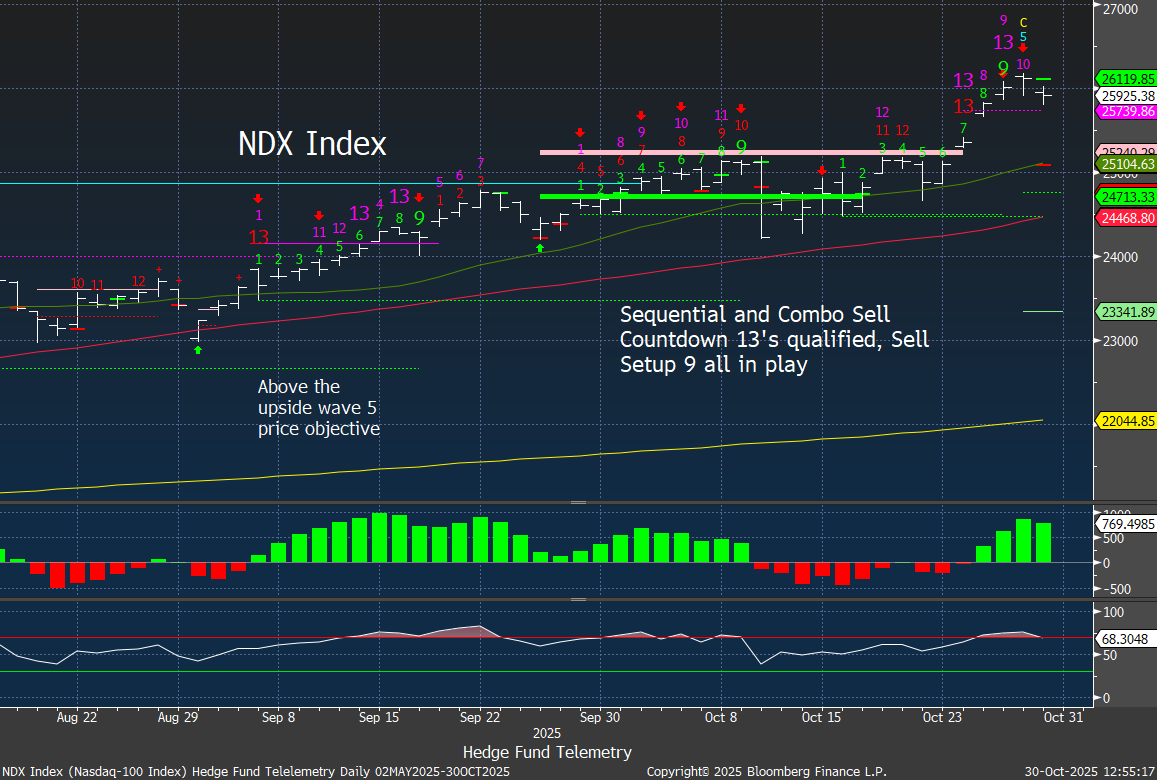
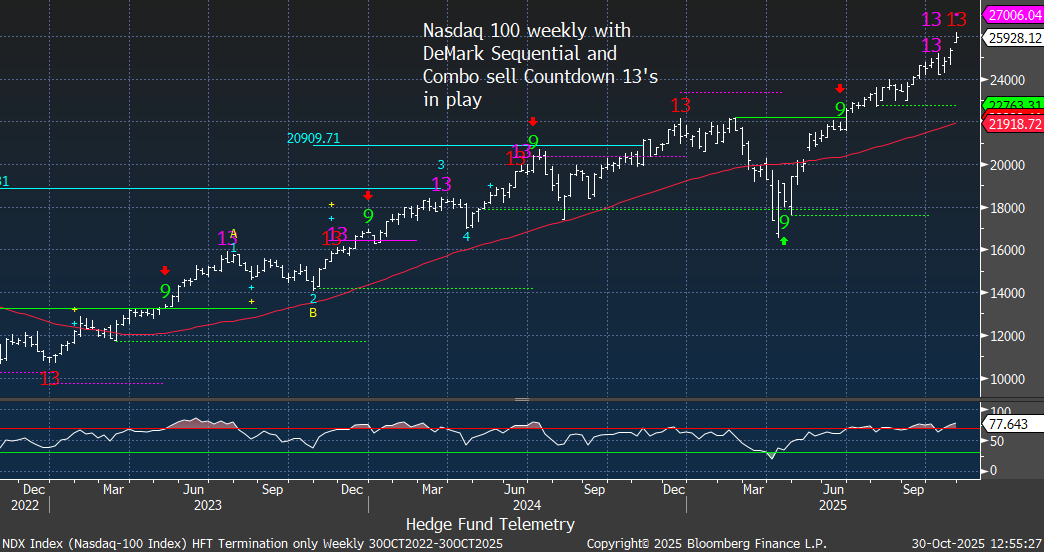
Nasdaq 100 Index daily and weekly sell signals in play.
Current Portfolio

The short-term SPY and QQQ momentum turned to sell today.
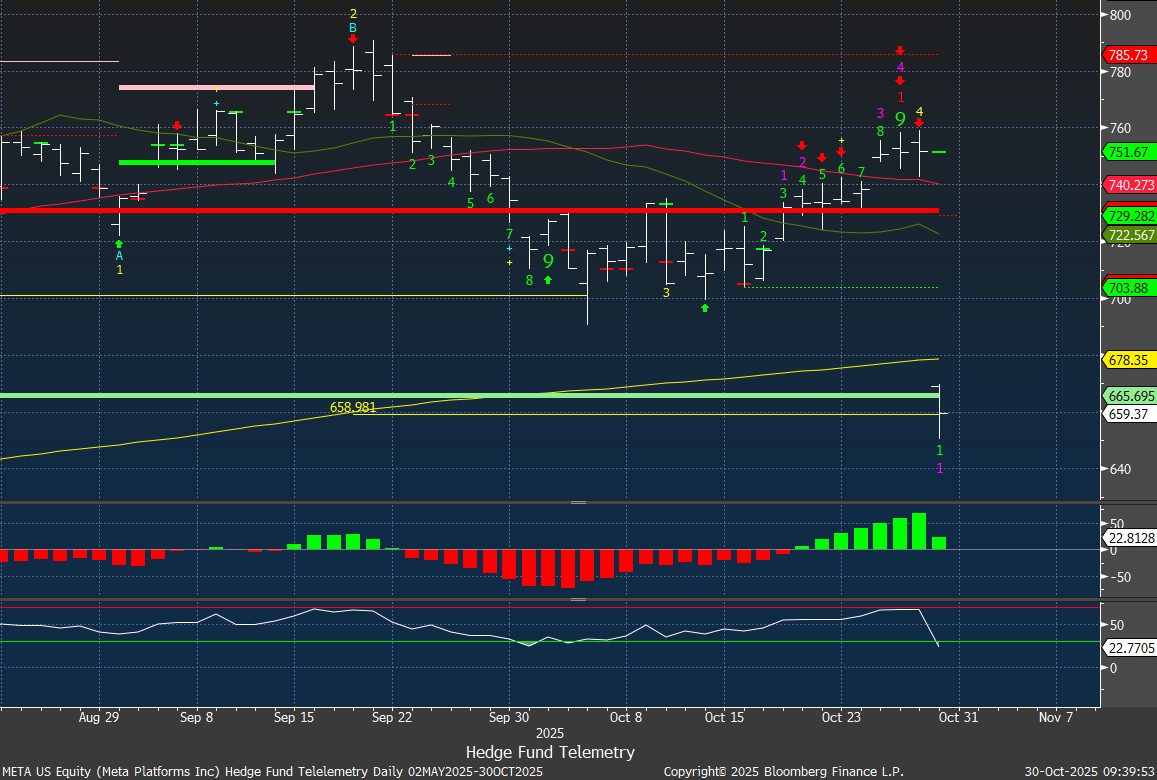
META worked out well on the short side with the lower high. I covered 2/3 of my position near the open.
PCT will report earnings/company update on November 6th. I sold 90% of my long position at the highs, locking in a huge 125% gain with the 13’s. I plan to buy back lower, and in doing so, I am watching for a re-entry level. 11ish is the 200-day, and possibly 9.29 is the downside wave three price objective. The Combo is on day 10 of 13 and needs further downside to qualify the 13.
IBIT Bitcoin ETF is nearing support again and I’m short this since I see a lot of overhead supply that could have people trapped in this and in need of selling if this breaks down further.
earnings previews
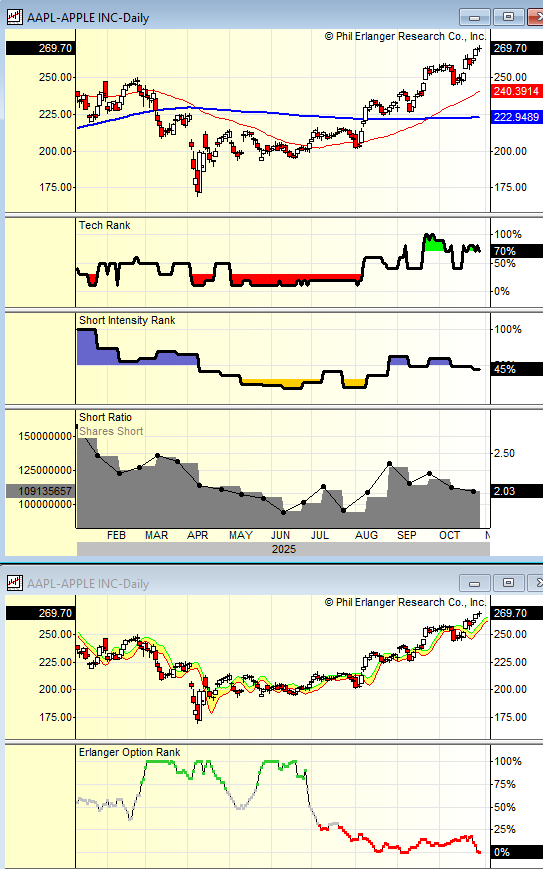
AAPL has VERY high expectations and remains a crowded long. Positive iPhone early sales stories have been out there along with lead times dropping a moderate negative. It’s trading at 37x earnings which for Apple is about as good as it ever gets historically. It’s overbought and has a cluster of sell Countdown 13’s. I’ll hold the remaining reduced position and hold off from options as it typically doesn’t move much the day after earnings.

The implied move is 3.5%
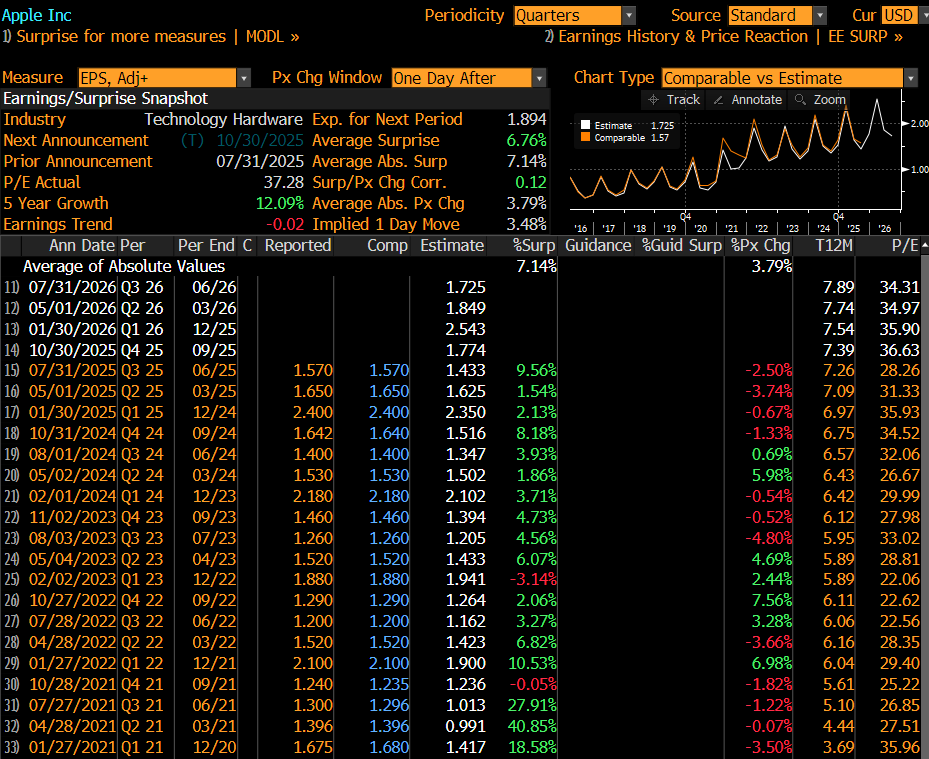
Short interest has been moving lower in the last few months with 2 days to cover. On the Options Rank there has been persistent and now max call buying with the red dots – a worry if I was long.
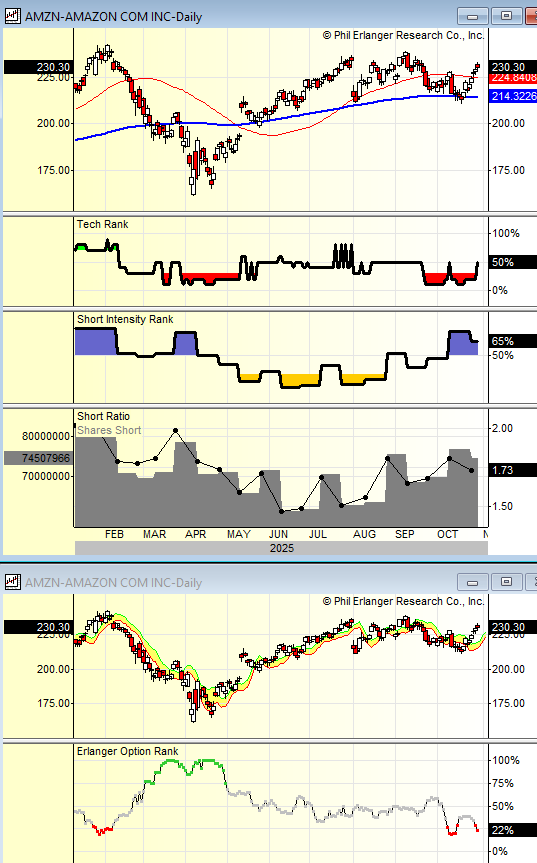
AMZN peaked in the summer and has moved to the 200 day (yellow line). I was short this and it wasn’t easy but came out OK with a gain. New sell Setup 9 like META had but I think there is more concern with this one as I have read some reports of them losing some share with AWS/cloud. I’ll watch from the sidelines as they have a lot of levers to pull with AWS and advertising on the home app.
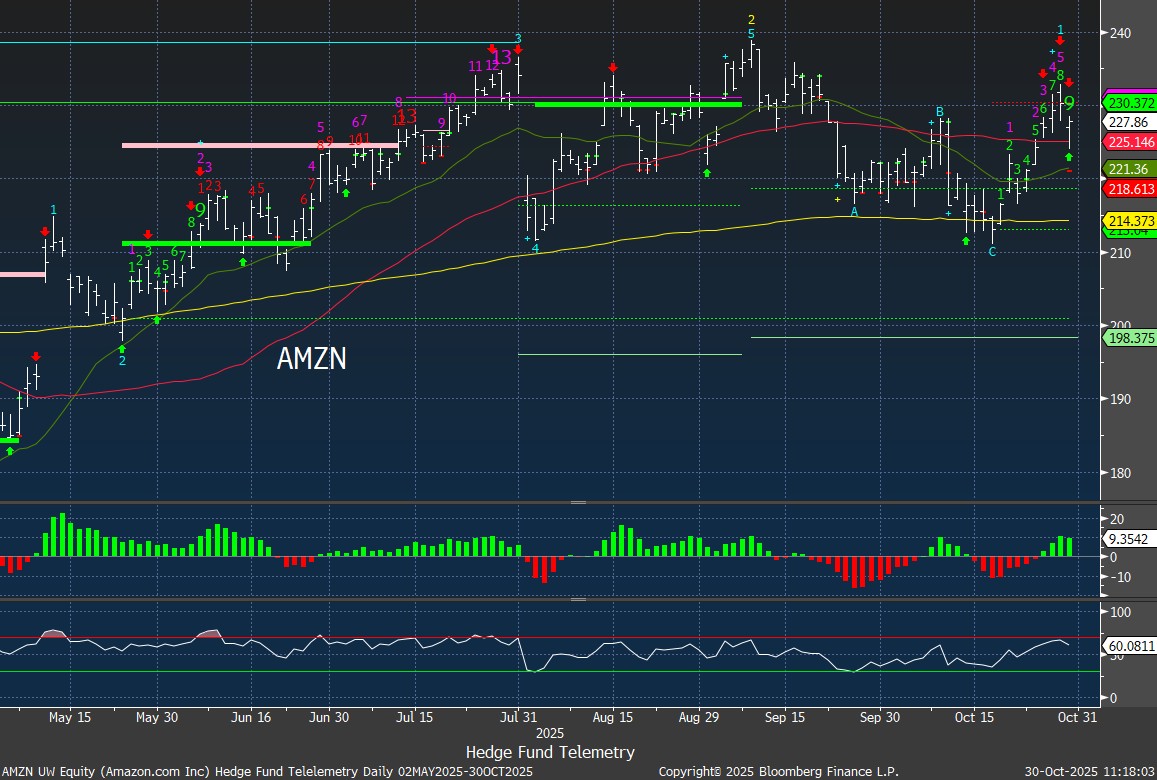
The implied move is 6.5%.

Short interest is steady with 1.7 days to cover. On the Options Rank there is renewed call buying with the red dots – not a place to follow the call buyers and get long.
COIN was a recent short that was covered with a gain. It now is more in no man’s land holding the 300 support and has a pending upside Sequential so I’ll hold off on doing anything with it. If crypto breaks then it might be a better time to short.
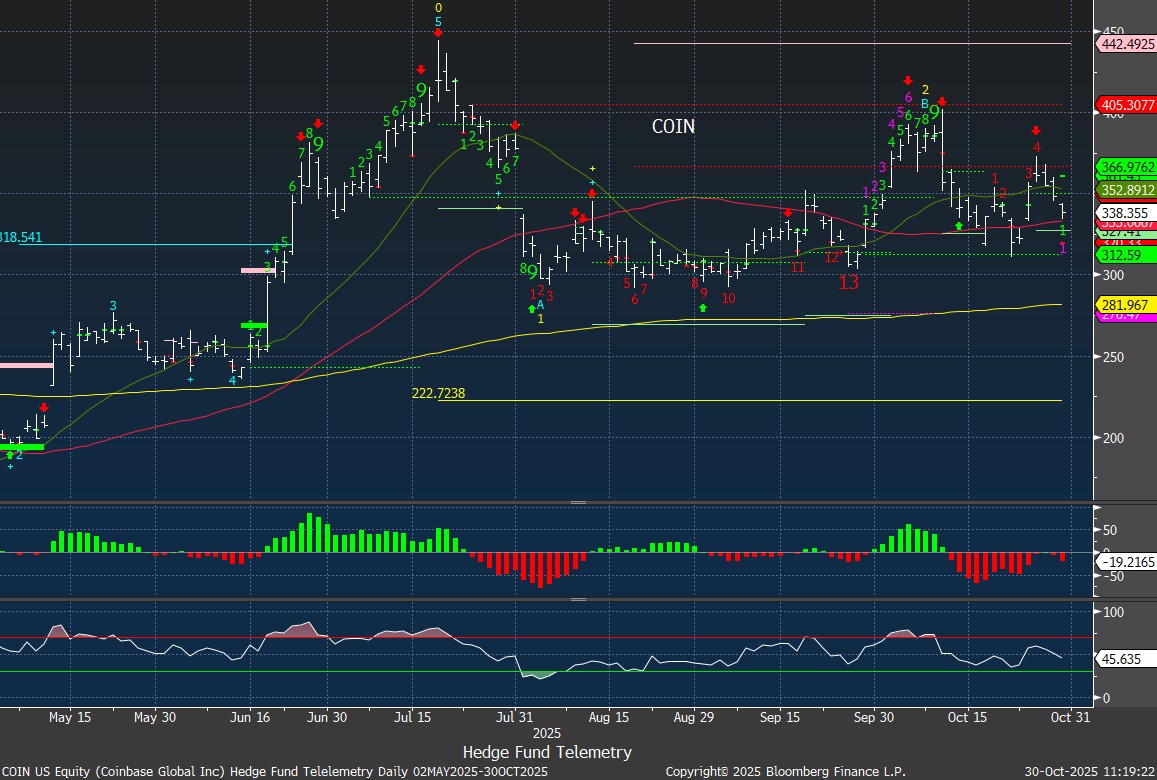
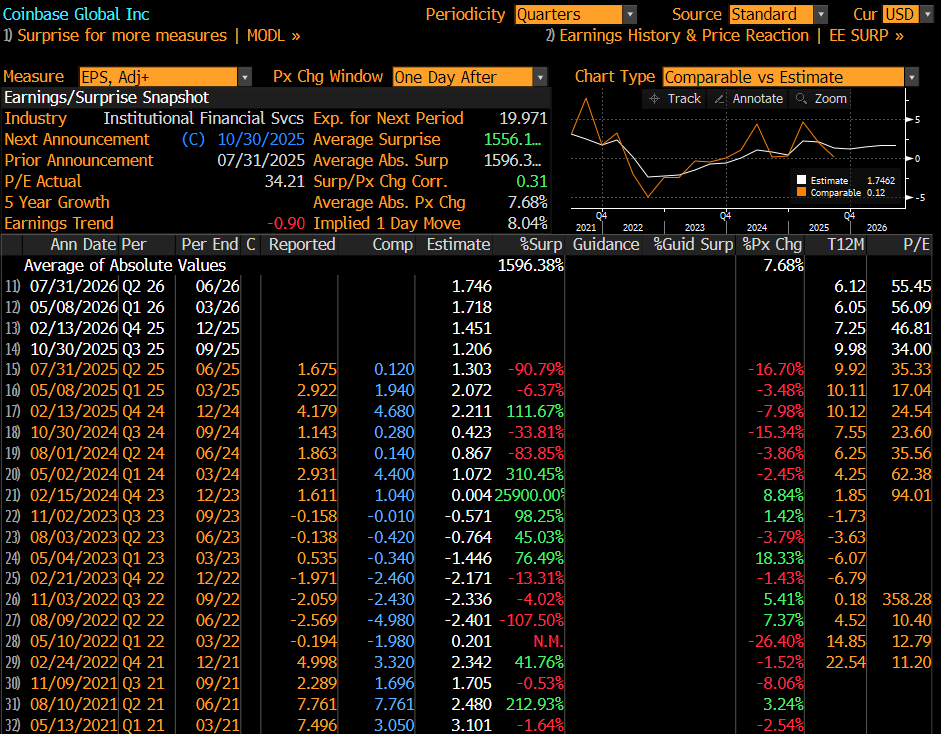
The implied move is 8% and has seen some nasty drops in the past 6 quarters.
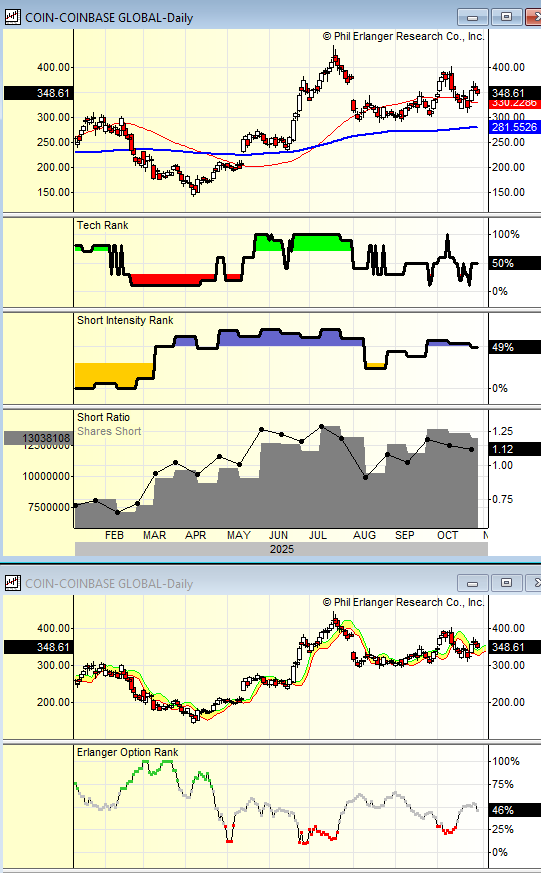
Short interest remains steady with only a 1 day to cover. On the Options Rank on the bounce there was call buying with the red dots and that has moderated to more neutral.
RDDT peaked with recent 13’s in upside wave 5. It’s trading at 200 near term support. A lower high wave 2 is present. I would normally press this short to try for the downside wave 3 price objective at 148 however short interest isn’t that informative and there was recent put buying which could cause a squeeze. And the implied move is 15% so I’ll watch on sidelines.

The implied move is very high at 15%
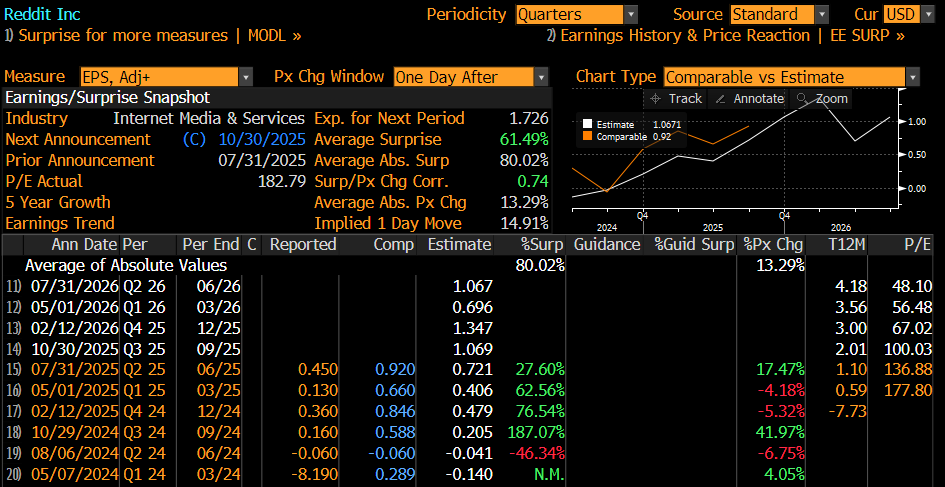
Short interest is steady with days to cover at 2.6 days. After the move down there was more put buying with the green dots on the Options Rank. Squeeze potential

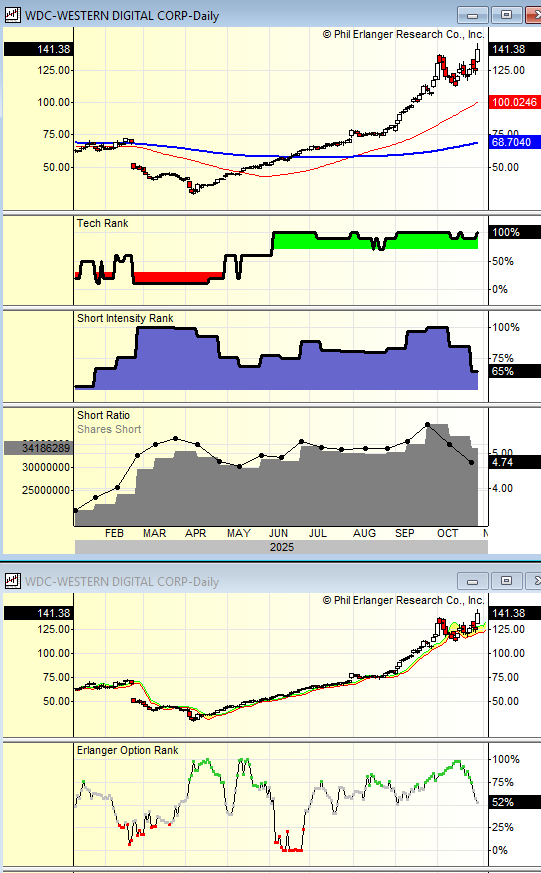
WDC Western Digital has moved up by more than double and was up yesterday after STX lifted. I’m a little concerned about this one being short however this might be priced in and fall short of the high implied move and not duplicate the move yesterday.

The implied move is high at 11.45%
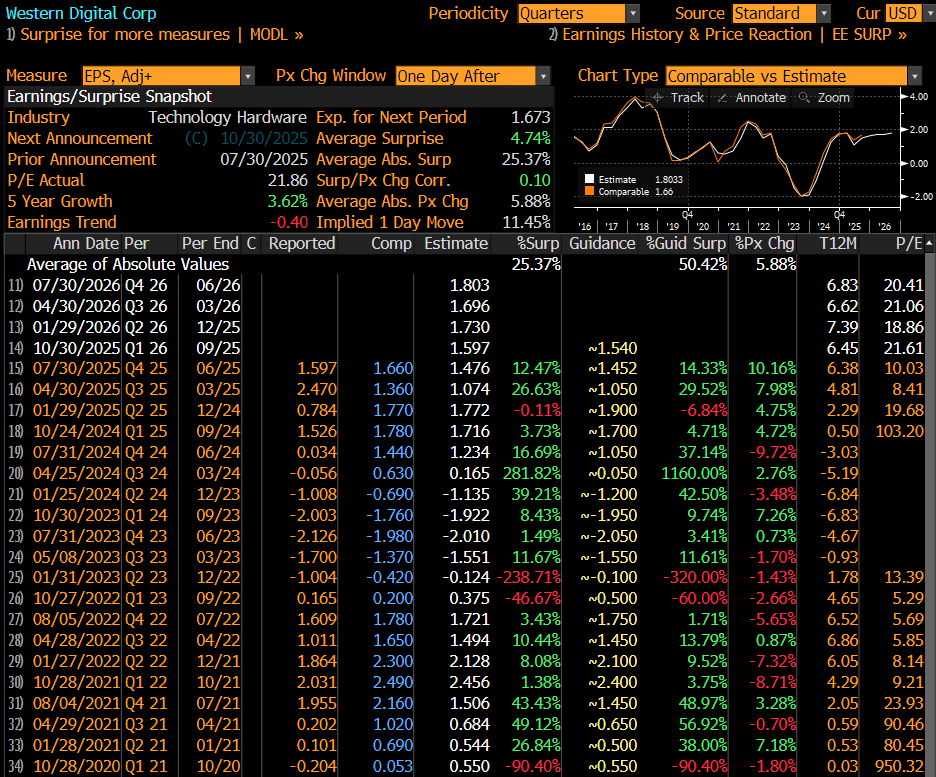
Short interest has been declining with 4.7 days to cover which gives me some concern as I am short. On the Options Rank there was also heavy put buying recently with the green dots however that is now more neutral.
Hedge Fund Telemetry ETF Percentage Price Oscillator Monitor
The PPO monitor (percentage price oscillator) force ranks ETFs by percentage above/below the 50-day moving average. This monitor and others are offered to Hedge Fund Telemetry subscribers on Bloomberg. Mixed day with tech weak

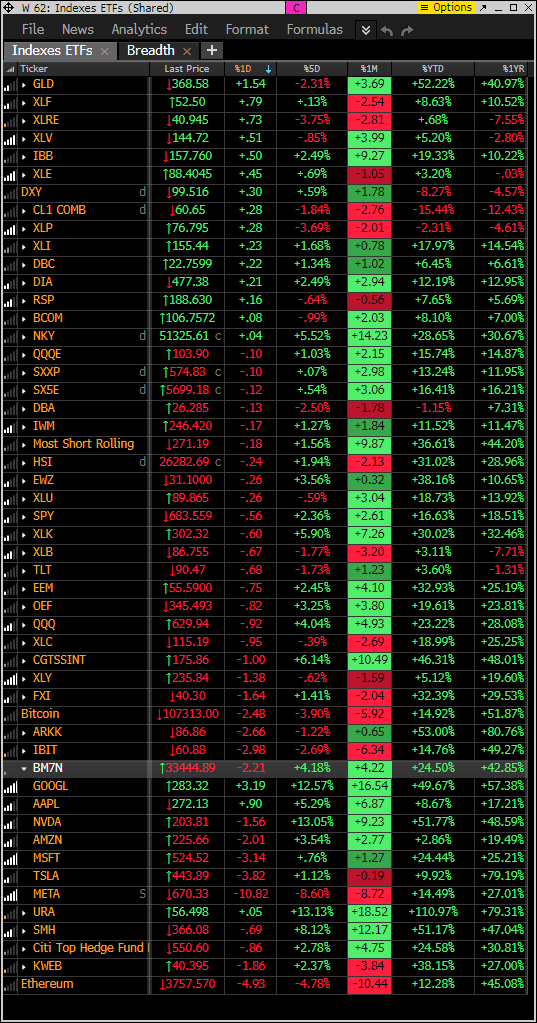
Index ETF and select factor performance
ETF with today’s performance with 5-day, 1-month, and 1-year rolling performance YTD. Gold back to the top along with some defensive sectors with risk on sectors weak on the day.
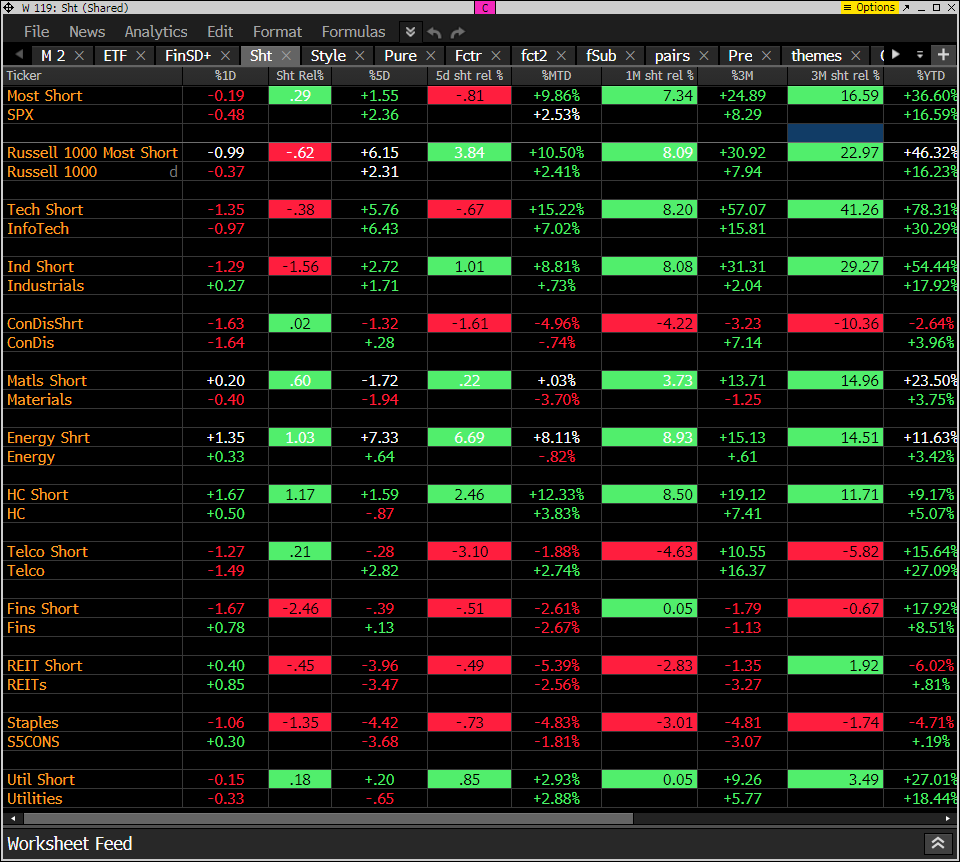
Goldman Sachs Most Shorted baskets vs. S&P Indexes
This monitor has the S&P indexes and the Goldman Sachs most shorted baskets. Short baskets are mixed.
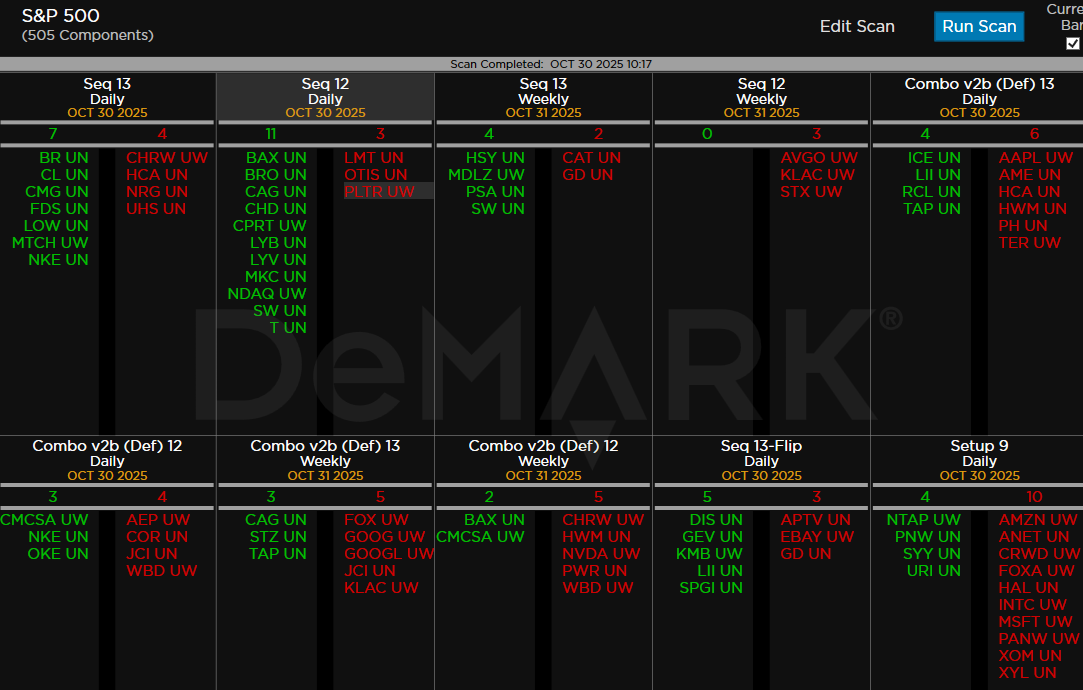
DeMark Observations
Within the S&P 500, the DeMark Sequential and Combo Countdown 13s and 12/13s on daily and weekly periods. Green = buy Setups/Countdowns, Red = sell Setups/Countdowns. Price flips are helpful to see reversals up (green) and down (red) for idea generation. The extra letters at the end of the symbols are just a Bloomberg thing. Worth noting: Look more buy signals vs sell signals! And the S&P hit a new all time high yesterday. To see more buy signals vs sells after hitting an all time high is unique however a lot of been declining in sectors out of favor
Major ETFs among a 160+ ETF universe. The weekly 13’s have some important sell signals

If you have any questions or comments, please email us. Data sources: Bloomberg, DeMark Analytics, Goldman Sachs, Street Account, Vital Knowledge, Daily Sentiment Index, and Erlanger Research