
Recent sentiment has been below the extreme zone (>80%) for a while, as the S&P and Nasdaq 100 have a rolling pattern keeping bullish sentiment above the 50% midpoint. The number of DeMark sell signals has been elevated recently on the daily time frames. These have been decent at tactical pullbacks or periods of stalling. There haven’t been knockout punches thrown. The Mag 7, which has led for the last two years, is down YTD by nearly 4%. The S&P and Nasdaq 100 have ticked into negative territory YTD, but nothing a good TACO trade can’t resolve. I’ve said for the last year that the market doesn’t like tariffs, and this weekend’s news of potential tariffs against the EU brought them back into the narrative. And traders are watching each day to see if SCOTUS rules on Trump’s tariffs from last year. Nobody really knows what will happen, one way or another, with the recent tariff threats and the SCOTUS decision. I’d suggest fund managers should hold off on buying a new Ferrari.
One thing we can clearly see is that there is extreme positioning combined with extreme complacency. It’s not just one survey, but the major bank prime broker reports show correlated data. People are positioned all in, levered, and complacent. I typically share highlights from the Bank of America fund manager survey, and below I’ve posted more than usual, as it clearly shows risks when nobody expects them. One thing people have been conditioned to is that minor pullbacks are always a buying opportunity, as Trump will back down from threats/tariffs, etc. My hope is that a meaningful pullback will occur to open up a decent, lower-risk buying opportunity, with internals oversold, combined with lower sentiment and DeMark buy Countdown 13s. A period of consolidation would go a long way toward addressing some of the imbalances in positioning and complacency.
There are still places in the market that are getting oversold (software and staples) and semis in some categories that are extremely overbought, with parabolic, sharp upside moves and unsustainable moves. The rotation into defensive sectors I’ve shown in recent weeks might be starting.
On another note, I’ve been working on a new, shorter-term equity trading strategy. More testing is needed, and how I post each day the buys and sells is TBD. I probably will bring back something like the mid-morning email note, just with the signals. So far, I’ve pulled together a list of about 30 notable, liquid individual stocks to focus on. When I have more to share, you’ll be the first to know.
Quick Market Views
Stocks: Ugly day with indexes near the lows. Breadth is very weak with NYSE down net ~2400 issues, Nasdaq down net ~1900 issues. S&P breadth has 114/387 up and down. Consumer Staples is the only sector higher… barely, but still it shows rotation into defensive sectors.
Bonds: Rates remain elevated with upside DeMark Countdown’s in progress. 2’s up only 1bp, 10’s up 6bps and 30’s up nearly 8bps. 2/10 spread is steepening at +69bps
Commodities: Mixed day. Crude is up 2%, Natural Gas up 25% (two days) Grains lower. Copper down 0.6%, Gold up 3.6%, Silver up 6.5%.
Currencies: US dollar index is down 0.9%. Bitcoin is down 3.35% under 90k again.
Current Portfolio Ideas:
Changes: I will hold what I have as I still see downside with shorts and longs still holding in except for ADBE.
Thoughts: The short-term SPY and QQQ momentum indicators remain on sell signals. I’ll be more active with ideas if we can break out of this defined range.
US INDEXES
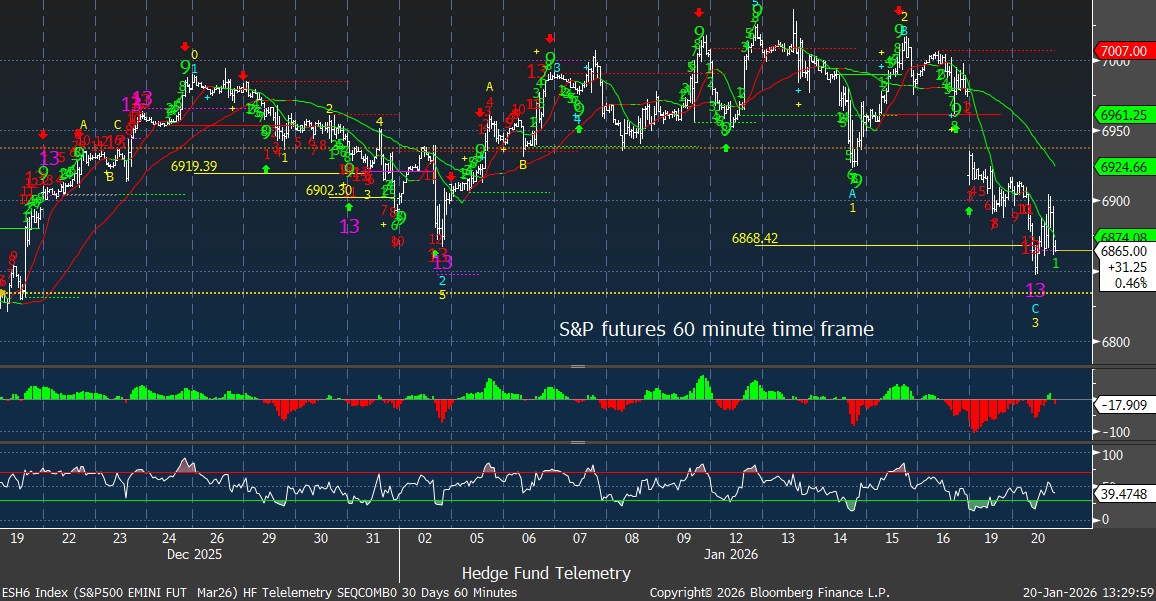
S&P futures 60-minute tactical time frame did bounce moderately but did not qualify corrective wave 4 (with a 13 hour closing high) It remains in downside wave 3
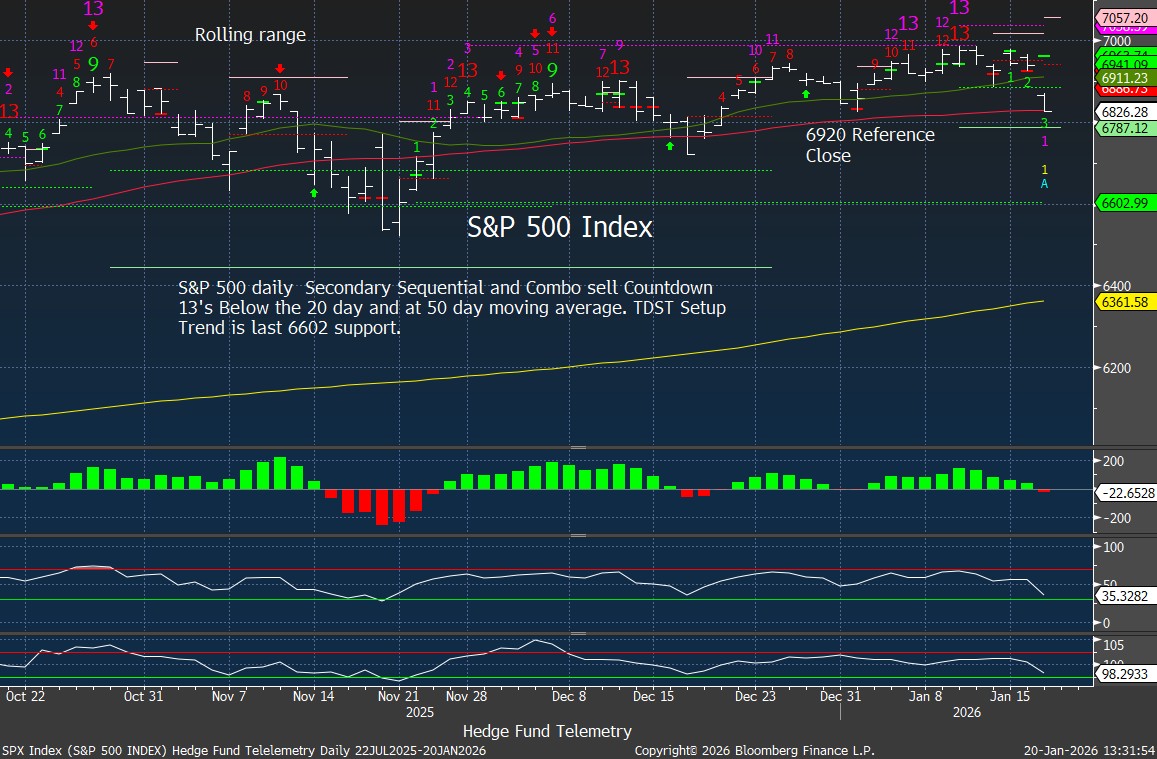
S&P 500 Index daily with recent DeMark Sequential and Combo sell
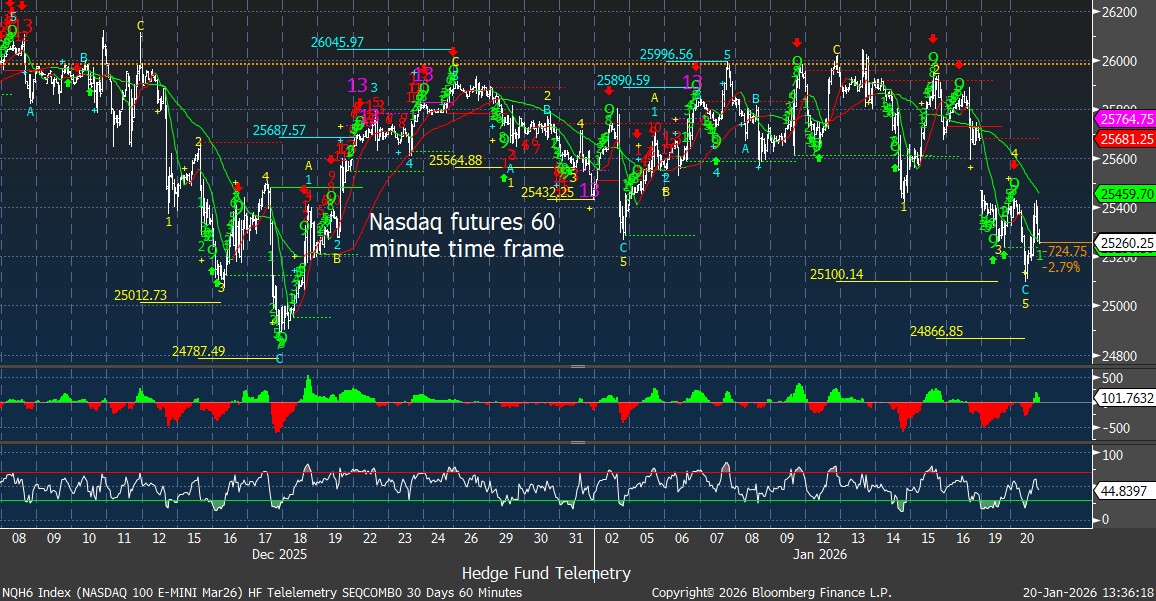
Nasdaq 100 futures 60-minute tactical time frame has seen Setup 9’s at inflection points with lower highs. ~24,800 is the mid December low to watch.
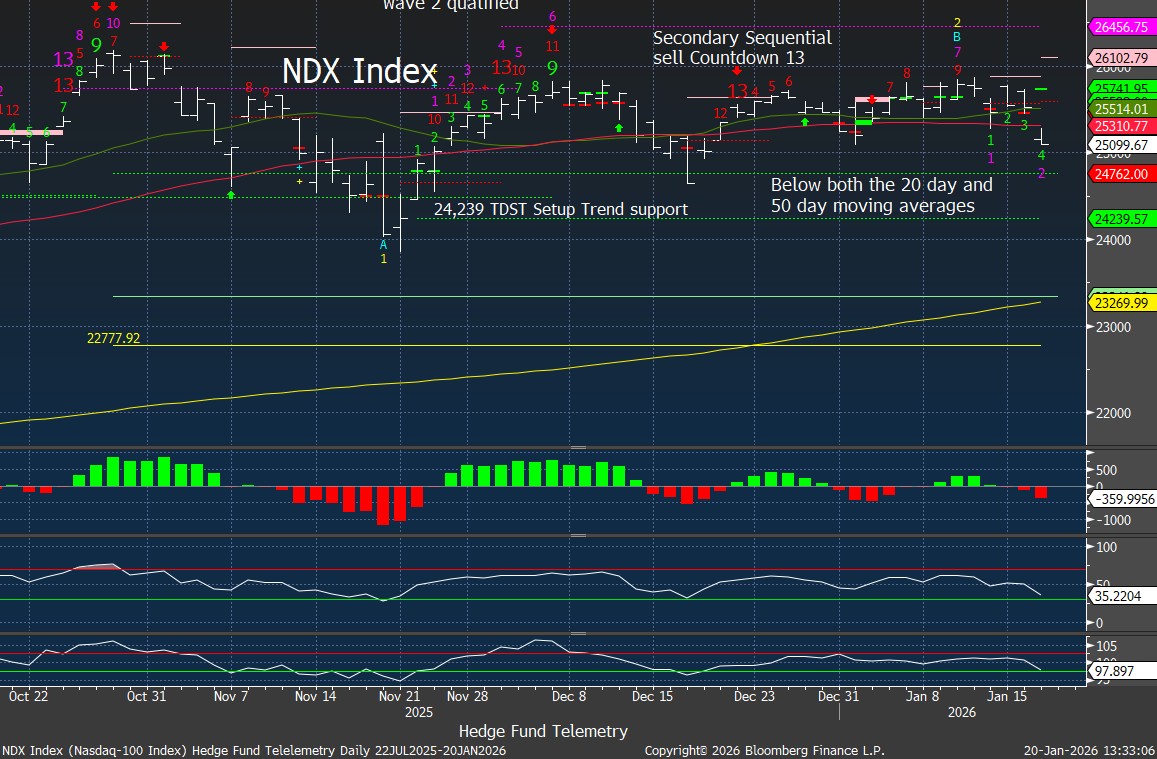
Nasdaq 100 Index daily continues to roll with support levels intact
Current Portfolio

The short term SPY and QQQ momentum indicators remain on sell signals despite the gaps up and down.

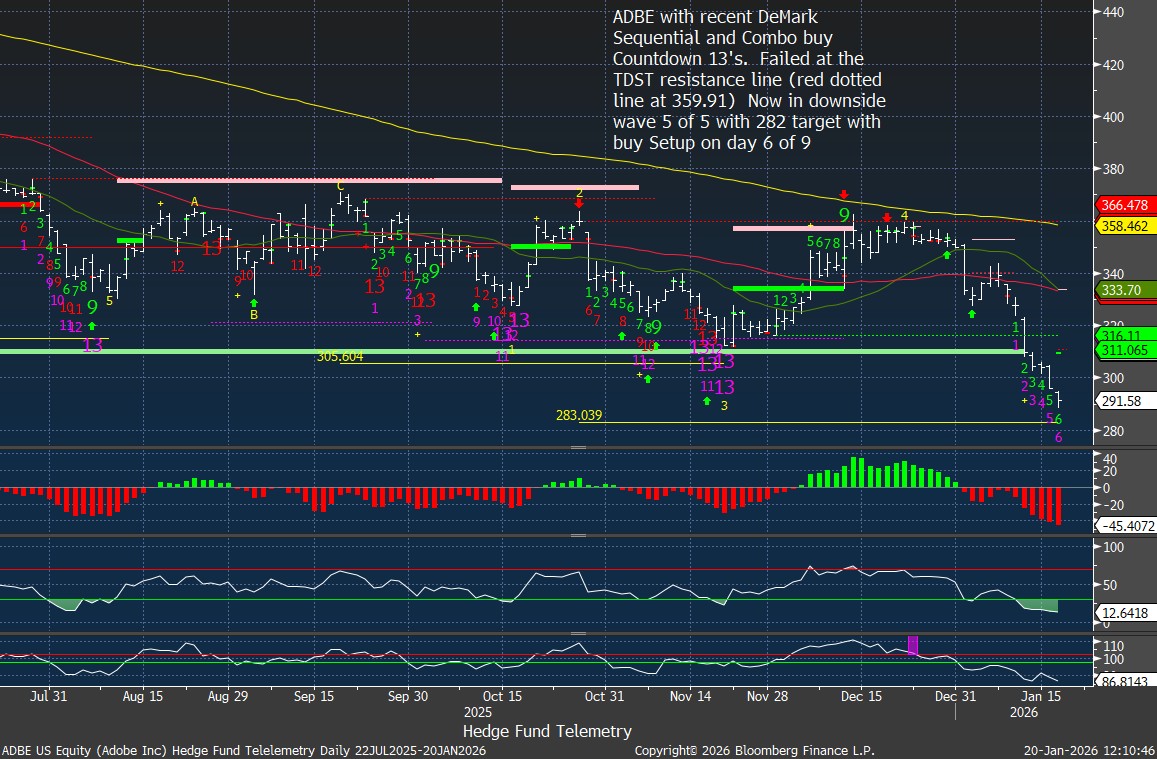
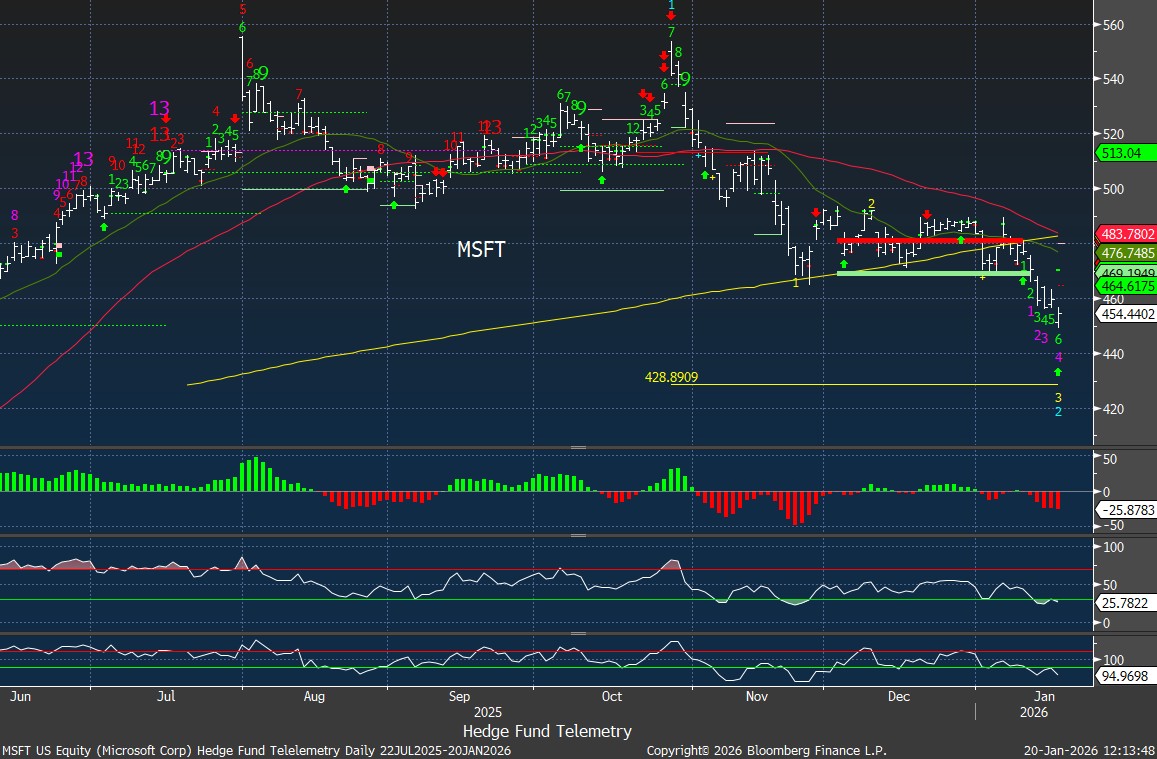
Qualify software has been hammered. ADBE and MSFT broke lower with buy Setup on day 6 of 9. Let’s see if these can get to 9’s this week. ADBE is close to a downside wave 5 of 5 price objective. I will likely buy more ADBE once we get a turn.
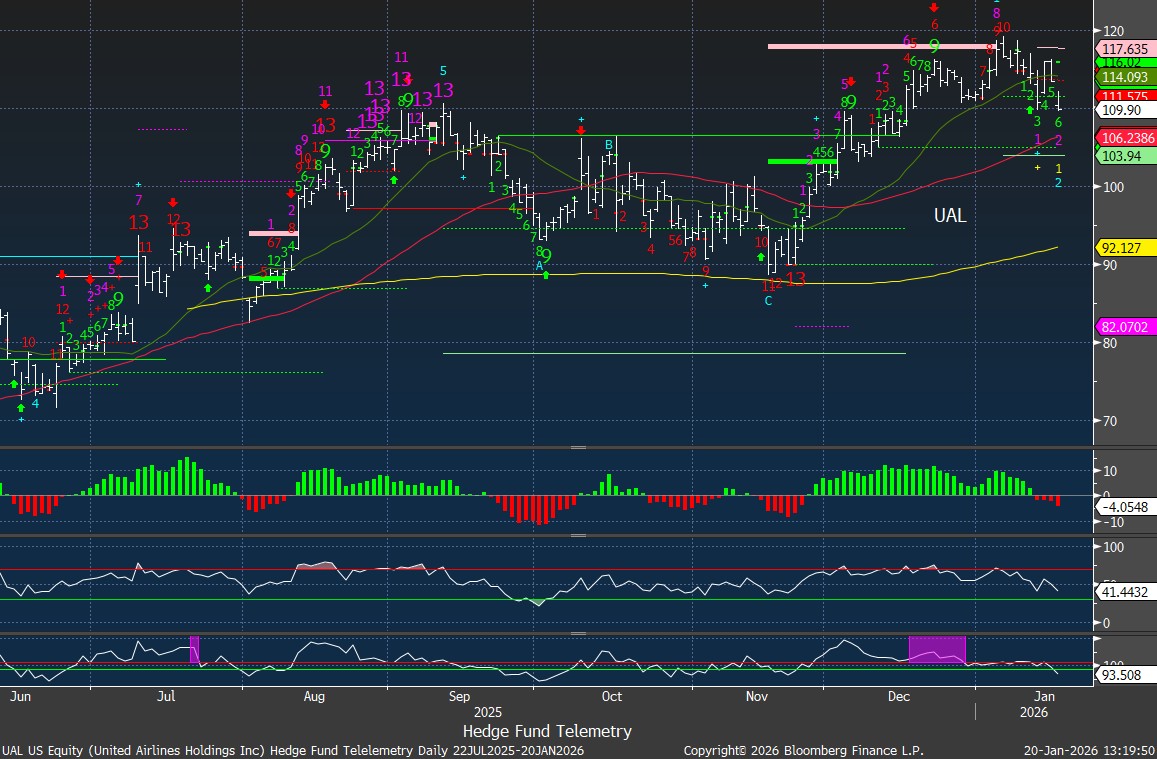
UAL United Air Lines reports later today and I backed off from doing a full preview. Short interest has declined while call buying has been steady. It has a bit of a rolling top and could move perhaps back to 100. I didn’t have enough conviction to do anything here as earnings in the coming days will not matter or move stocks more than the political / tariff news. DAL had decent numbers last week yet still dropped.
Bofa Fund managers survey – extremes
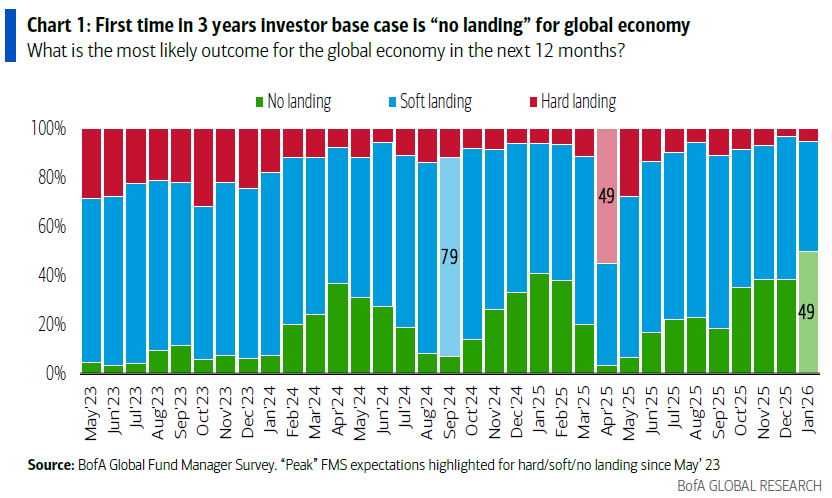
This month’s Bank of America fund manager survey is extreme. Extreme positioning and complacency. I typically throw in a few highlights and I added more since they are relevant.
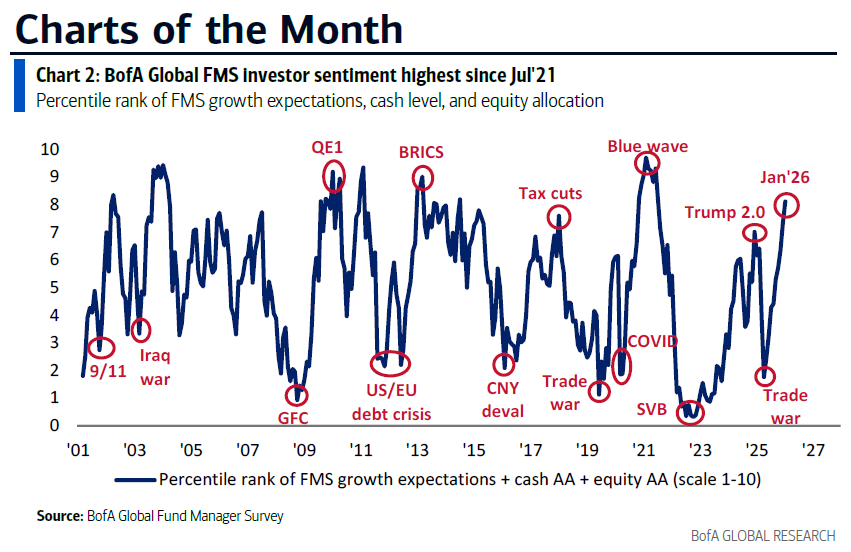
First up, this is one of my favorites because when things get skewed, either with no landing peaking, combined with a hard landing, very low, it has signaled market pullbacks. On the other hand, when it’s the opposite, with hard landing spiking higher and no landing very low, it signals bottoms.
Investor sentiment is at its highest level since July 2021. 2021 was a peak year, followed by some nasty drawdowns in 2022.
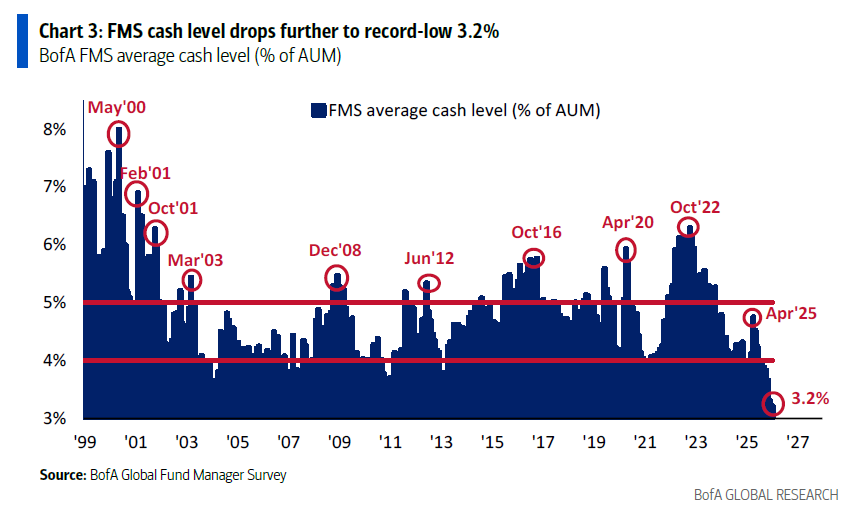
Cash levels are at a new record low at 3.2%. Where is all the cash on the sidelines? This is not supportive of further market gains or broadening, in my opinion.
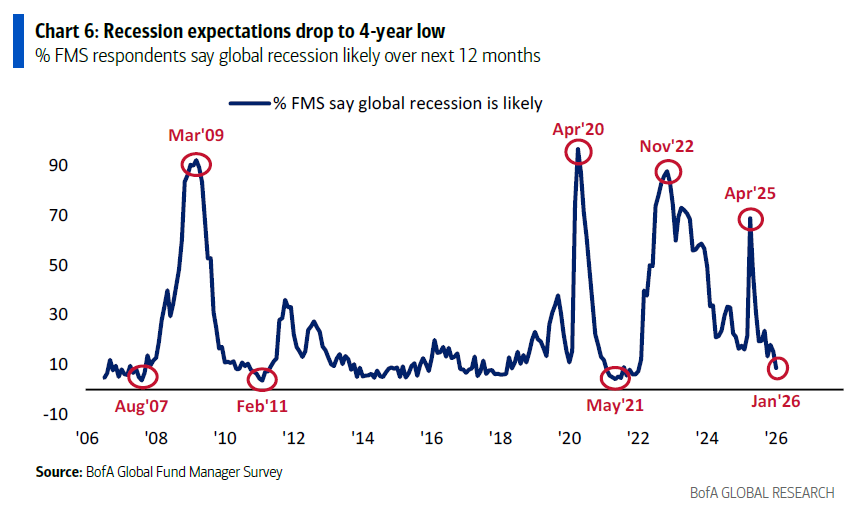
Recession expectations at 4 year low
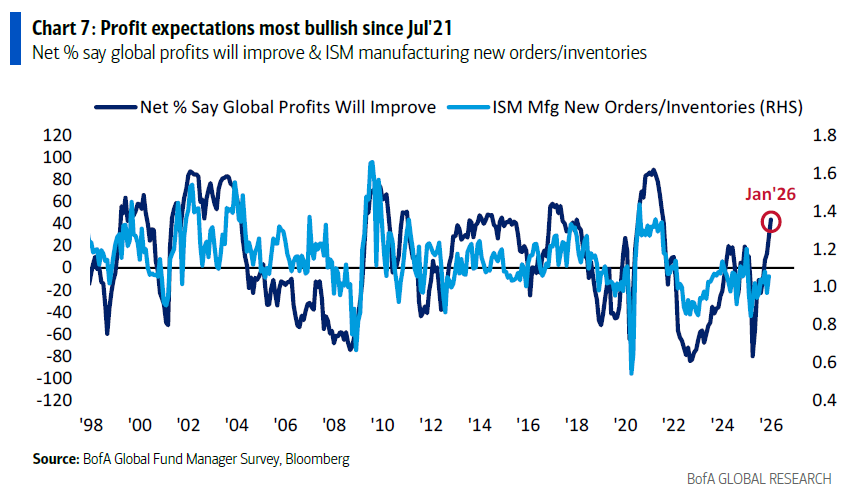
Profit expectations have spiked. It can and might go even higher
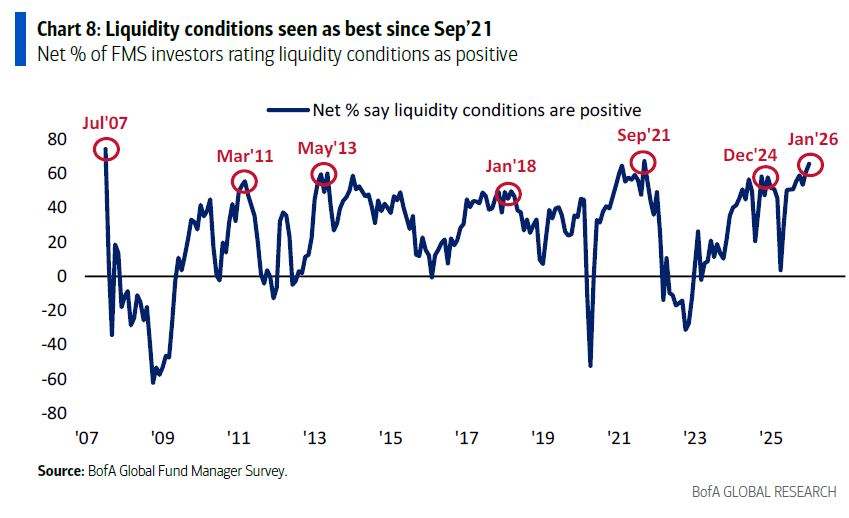
Liquidity conditions also at 2021 levels. Liquidity is like oxygen; you don’t know you need it until it’s gone.
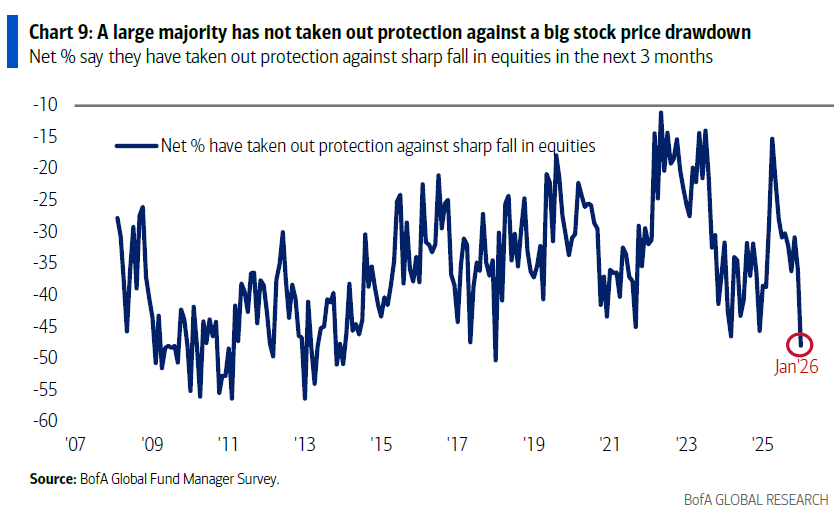
NOBODY is hedged for a big stock price drawdown.
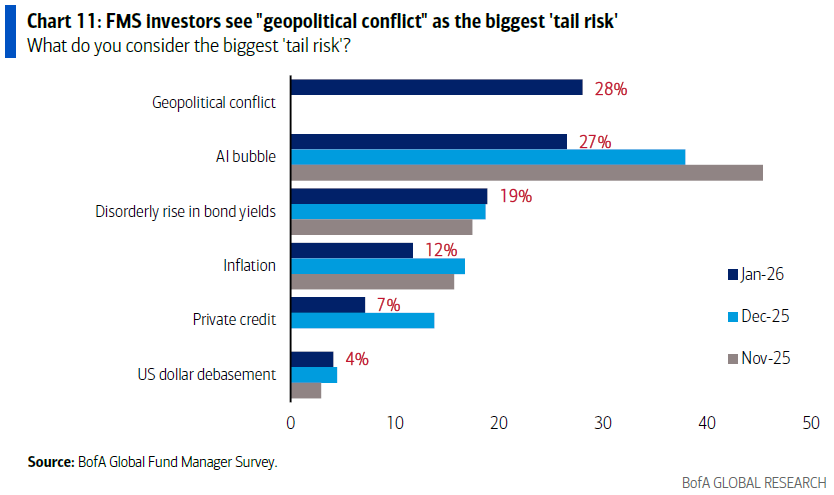
Geopolitical conflict wasn’t mentioned in recent months, yet it’s now the biggest tail risk.
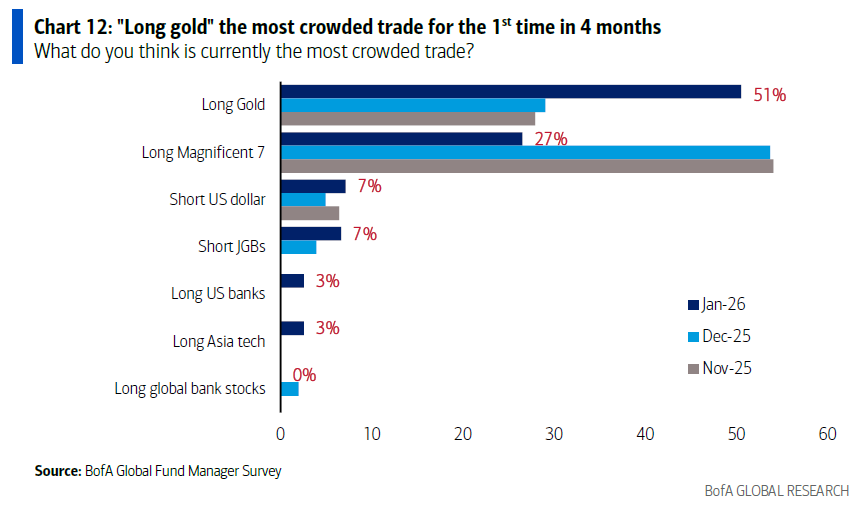
Long Gold is the most crowded trade over the Mag 7
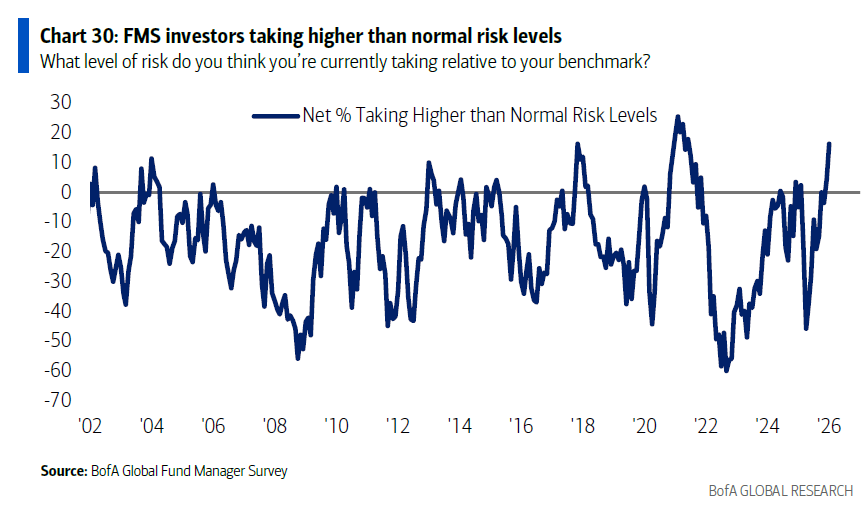
Lining up with everything, at least investors admit they are taking higher-than-normal risk
Hedge Fund Telemetry ETF Percentage Price Oscillator Monitor
The PPO monitor (percentage price oscillator) force ranks ETFs by percentage above/below the 50-day moving average. This monitor and others are offered to Hedge Fund Telemetry subscribers on Bloomberg. Metals remain the hiding place. Silver is now 47% above the 50 day – crazy. UNG is above the 10 and 20 day moving average and only 7% below the 50 day. I expect to see Natural Gas continue higher with very cold weather coming later this week and into next week.

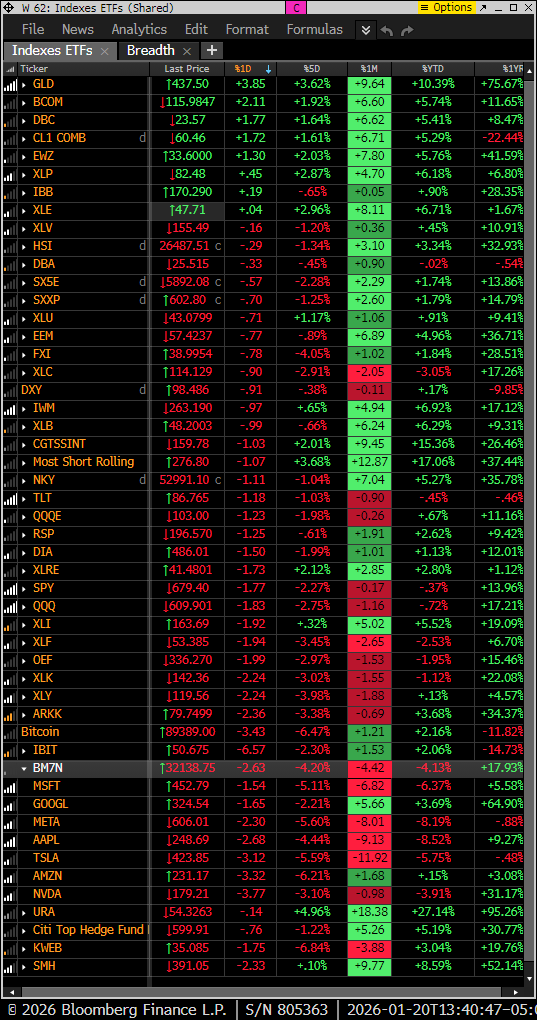
Index ETF and select factor performance
ETF with today’s performance with 5-day, 1-month, and 1-year rolling performance YTD. Best performing US sector is Consumer Staples. Mag 7 down over 4% YTD.
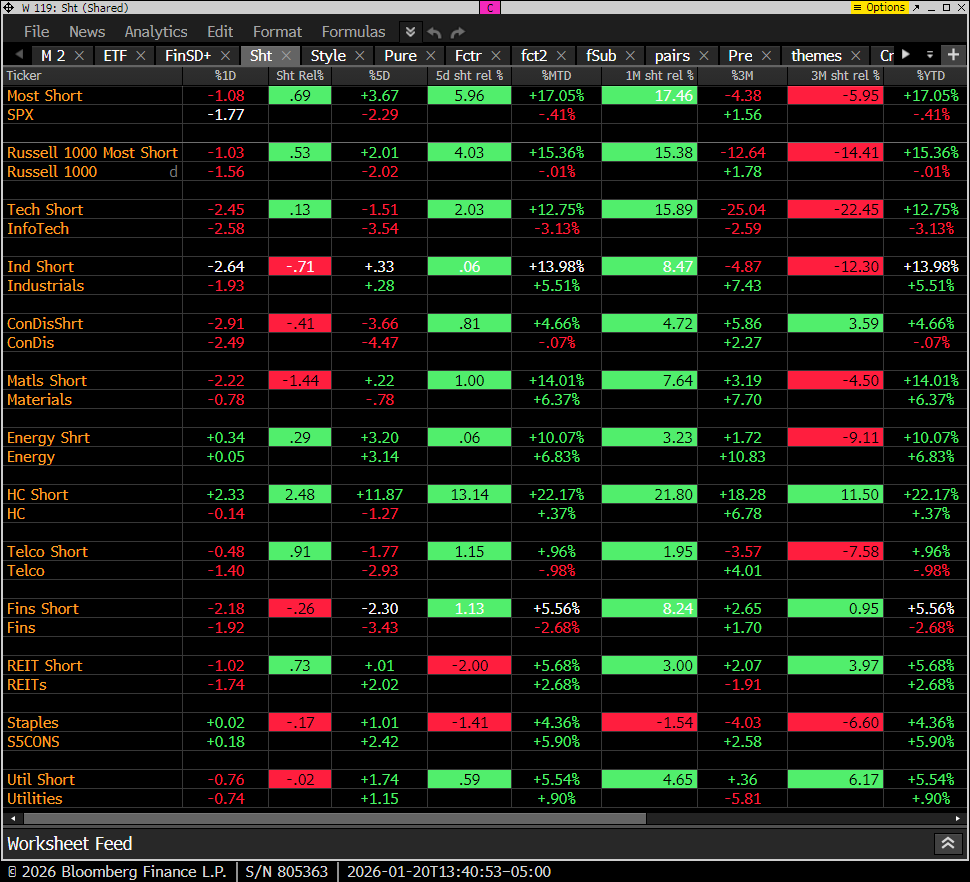
Goldman Sachs Most Shorted baskets vs. S&P Indexes
This monitor has the S&P indexes and the Goldman Sachs most shorted baskets. Mixed action in markets with a few short baskets up on the day.
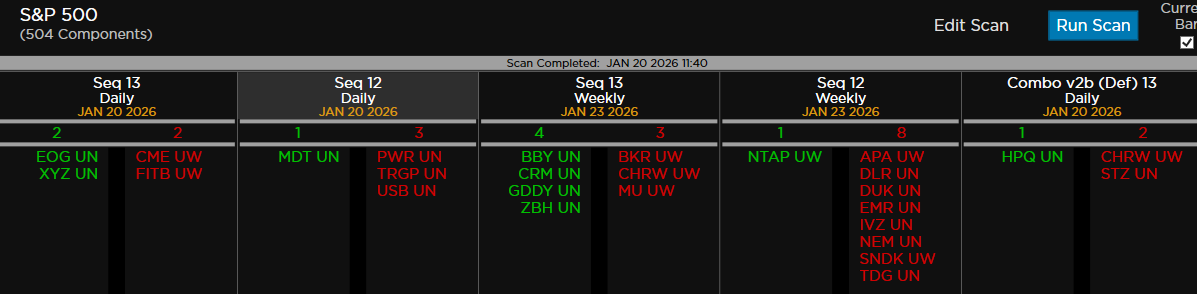
DeMark Observations
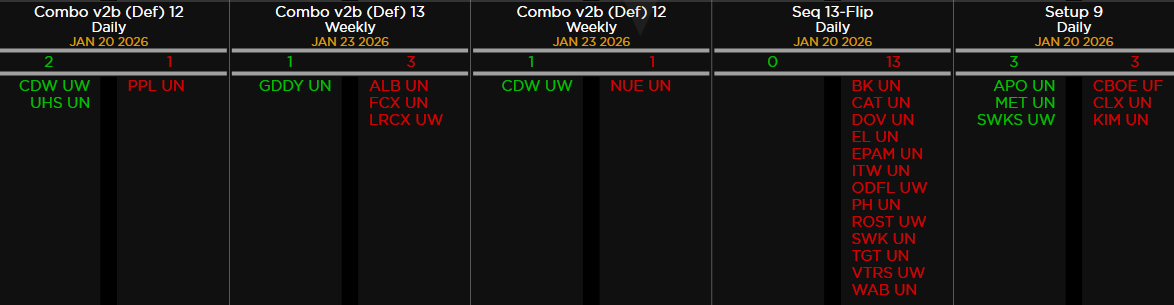
Within the S&P 500, the DeMark Sequential and Combo Countdown 13s and 12/13s on daily and weekly periods. Green = buy Setups/Countdowns, Red = sell Setups/Countdowns. Price flips are helpful to see reversals up (green) and down (red) for idea generation. The extra letters at the end of the symbols are just a Bloomberg thing. Worth noting: Seeing some oversold stocks with buy Countdown’s on daily and weekly time frames and overbought showing up as sells – expecially on weekly. Keep an eye on the price flip down column for short ideas.
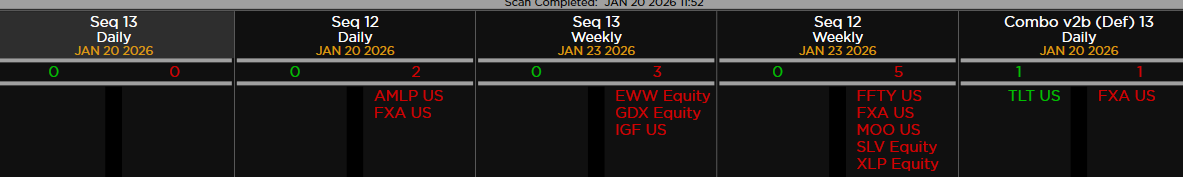
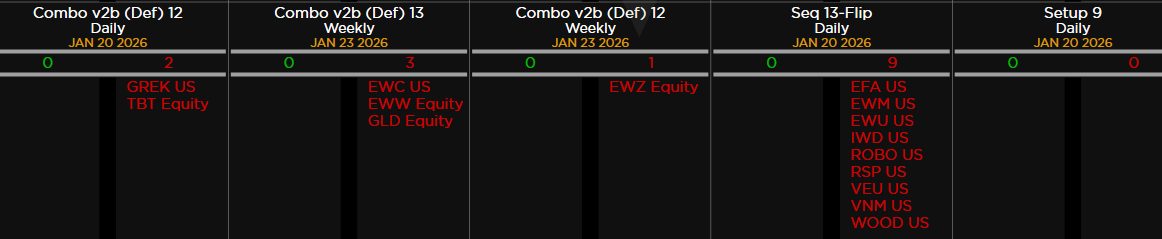
Major ETFs among a 160+ ETF universe. Similar story. Several Gold proxies with weekly sell signals
If you have any questions or comments, please email us. Data sources: Bloomberg, DeMark Analytics, Goldman Sachs, Street Account, Vital Knowledge, Daily Sentiment Index, and Erlanger Research