
Late Cycle, Not End Cycle
The market continues to send a message that both bullish and bearish investors do not want to hear. While sentiment, positioning, leverage, and speculation have reached levels typically associated with market peaks, the underlying macro and liquidity backdrop remains far healthier than the bears would prefer.
The result is a market that, from a leadership perspective, increasingly resembles 1999 with a blow-off top, but operates within a macro environment that looks far more like 2017.
That combination is dangerous—but not necessarily bearish yet.
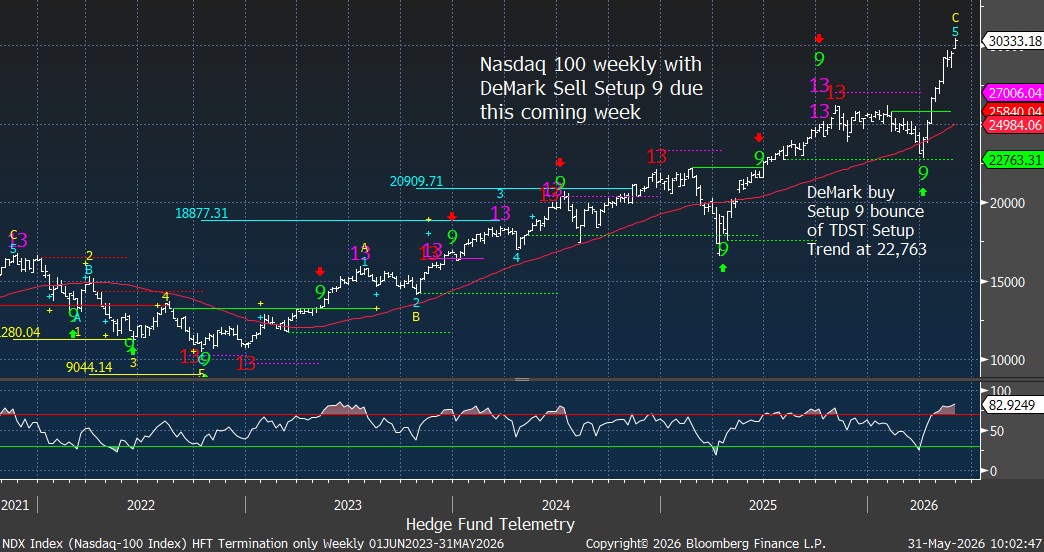
The S&P 500 and Nasdaq have recovered from the spring correction and pushed back to new highs. The Nasdaq 100 enters June with a weekly DeMark Setup 9, while the S&P 100 and 500 are approaching completion of daily Sequential and Combo Countdown sell signals. These are legitimate exhaustion warnings, but exhaustion is not the same as a bear market; we will want to see confirmation with price moving below the 10-day and preferably below the 20-day. Historically, weekly Setup 9s now in play have tended to produce consolidation and rotation rather than immediate trend reversals.
Beneath the surface, internals have historically been weak relative to the strong index price action. Breadth is no longer confirming price. In May, more S&P stocks were down than up, while in the Nasdaq 100, it was mostly even. The McClellan Oscillator and Summation Index continue to diverge from the advance, while participation measures, such as the percentage above the 20- and 50-day moving averages, have failed to fully confirm recent highs. Bullish Percent and Golden Cross indicators remain positive but have flattened. The market is advancing, but leadership is narrowing.
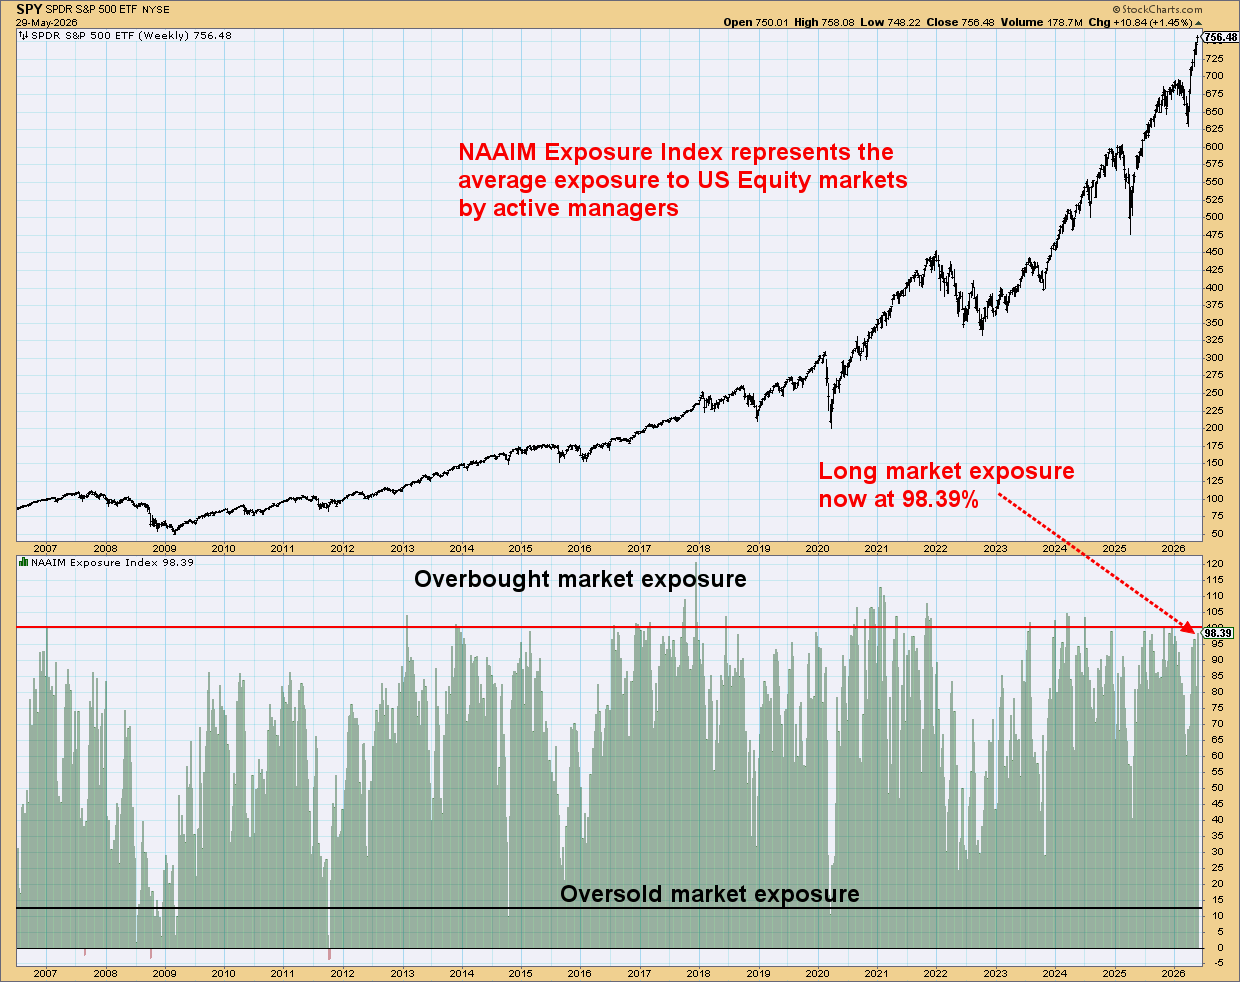
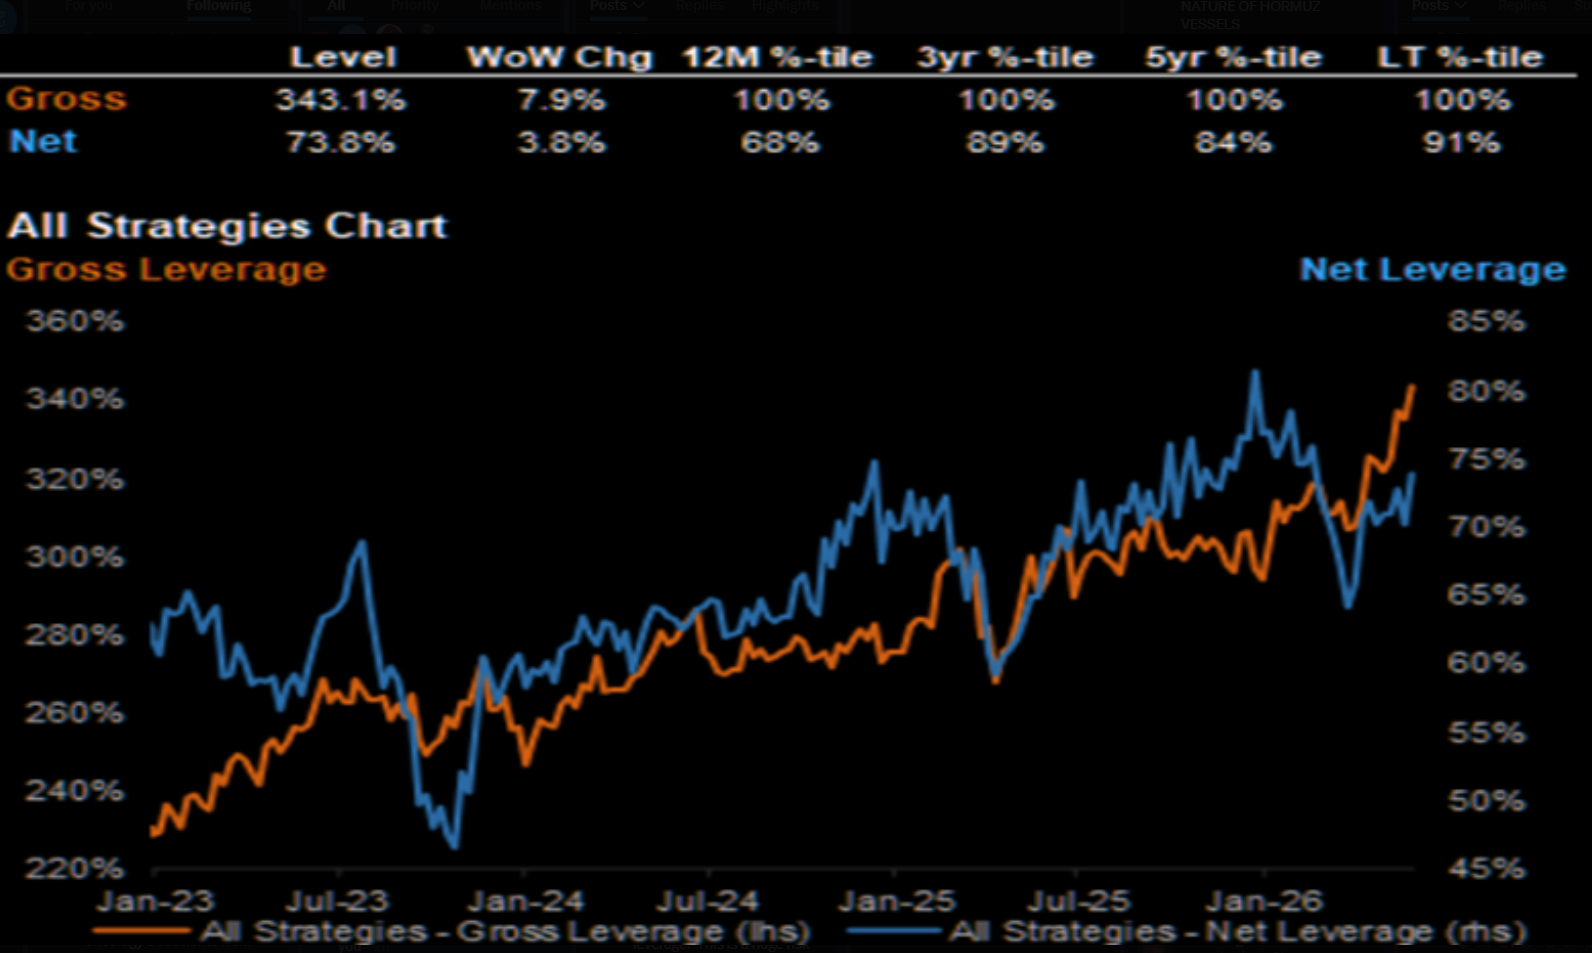
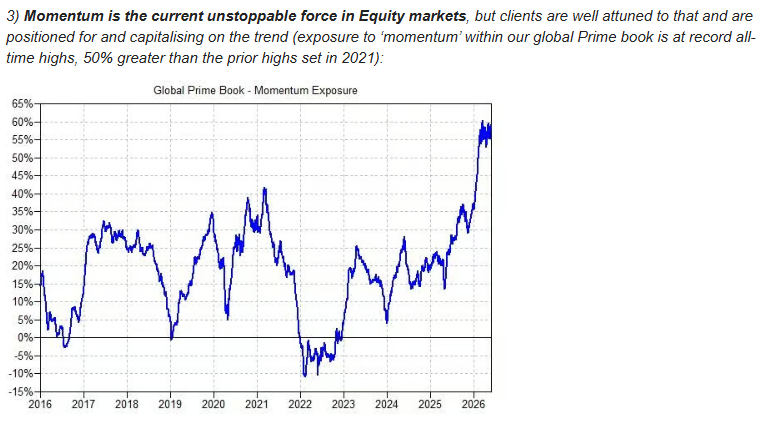
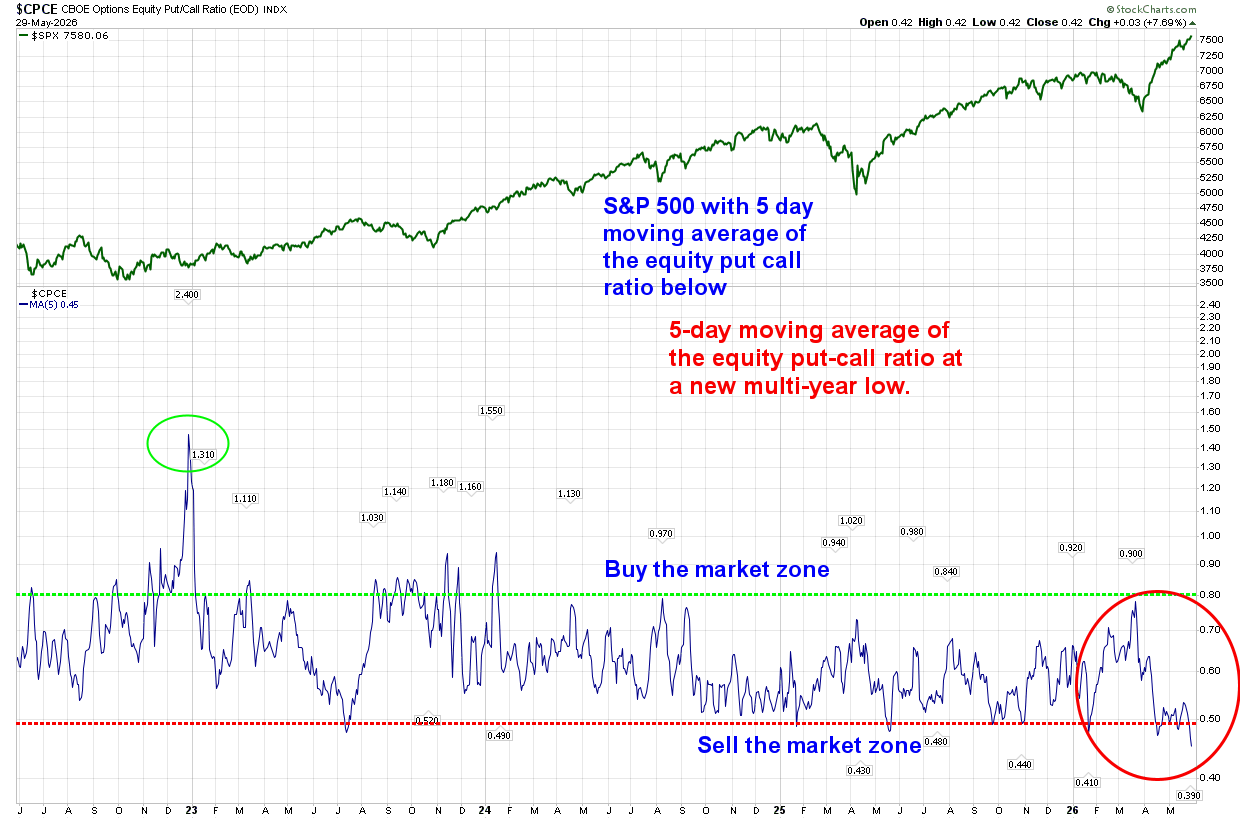
Concentration remains extraordinary. Hedge fund leverage is near record levels. NAAIM exposure has climbed to 98%, among the highest readings of the past two decades. Equity put-call ratios have collapsed while call buying has surged to extreme levels. Momentum exposure across hedge fund portfolios now exceeds even the 2021 peak, while assets flowing into leveraged single-stock ETFs tied to AI and semiconductor beneficiaries continue to accelerate.
This is what speculative behavior looks like.
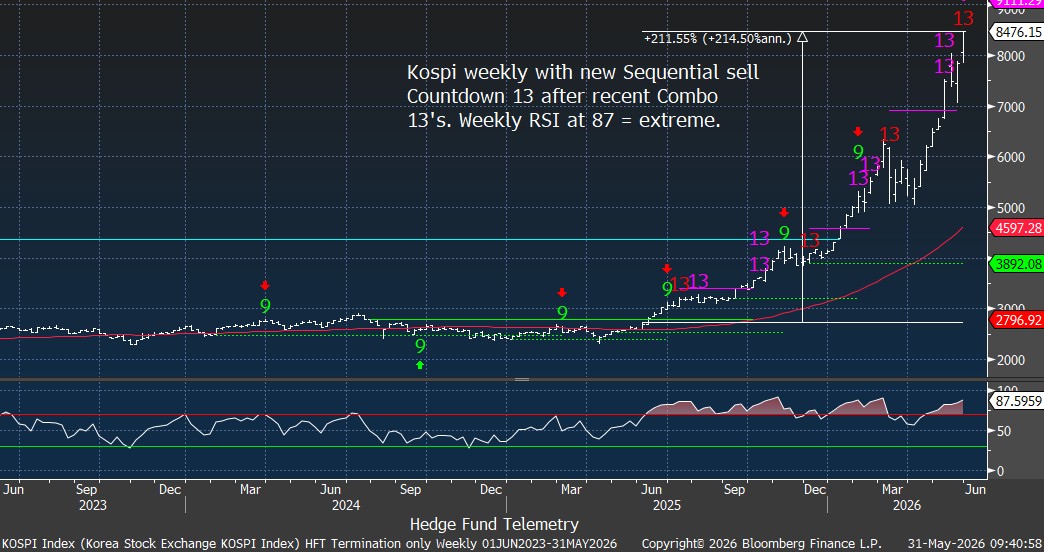
South Korea provides perhaps the clearest example. The KOSPI has more than tripled from its lows and now carries weekly Sequential and Combo 13 exhaustion signals alongside RSI readings approaching 90. KOSPI stats for May are extraordinary, with the index up 28.5%. The percentage of KOSPI stocks down 20% or more was 27.5%, while just 4.8% were up 20% or more. Korea has effectively become the purest expression of the global AI memory trade, led by SK Hynix. Historically, semiconductor leadership often peaks in Korea before broader technology leadership begins to cool elsewhere.
Yet despite growing excesses, the macro foundation remains supportive.
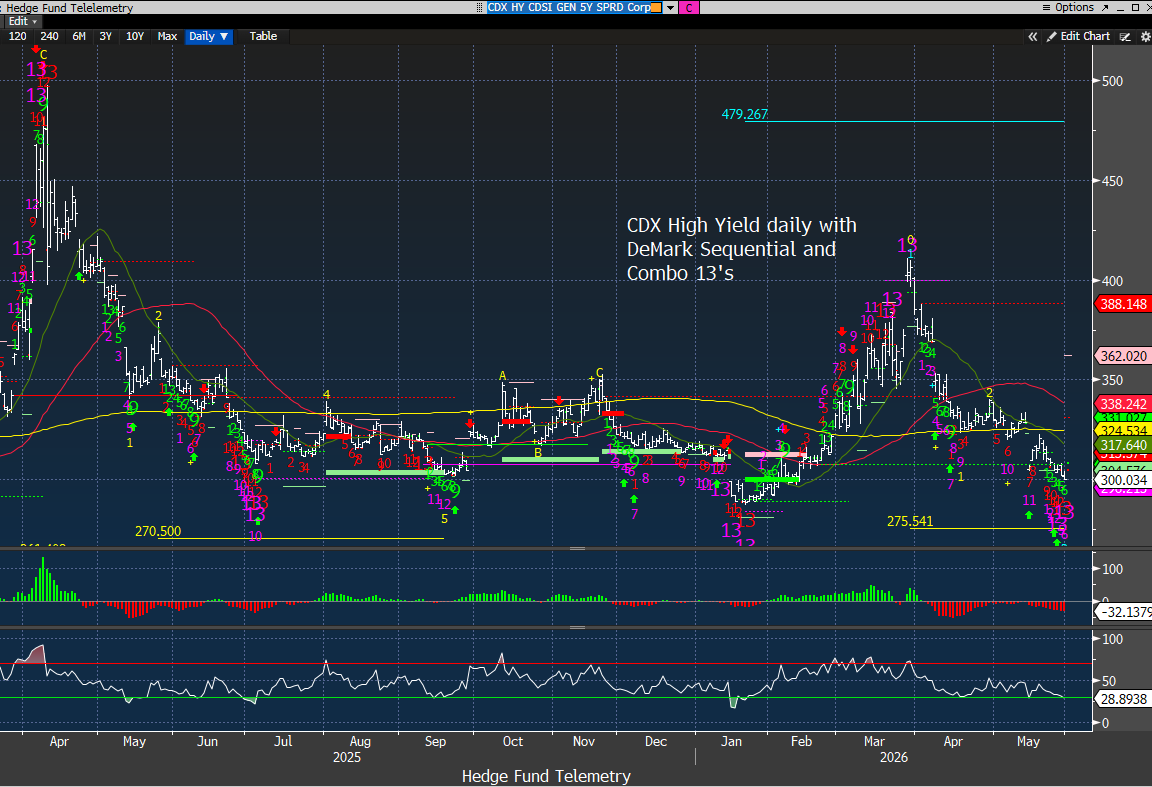
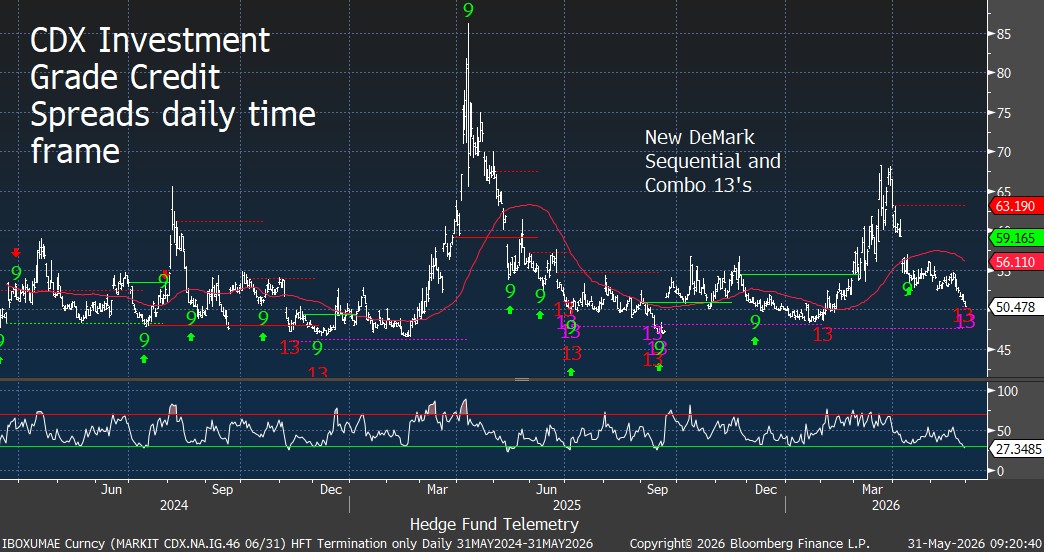
Credit remains the single most important chart in the market. Investment-grade and high-yield credit spreads continue to tighten and recently registered new Sequential and Combo 13 signals at supportive levels. Major bear markets rarely begin with healthy credit conditions. Until spreads begin to widen meaningfully, the case for a cyclical downturn remains difficult to make; however, the new DeMark exhaustion signals for credit spreads must be watched and respected since these have signaled and correlated with equity market tops even better than the volatility indexes.
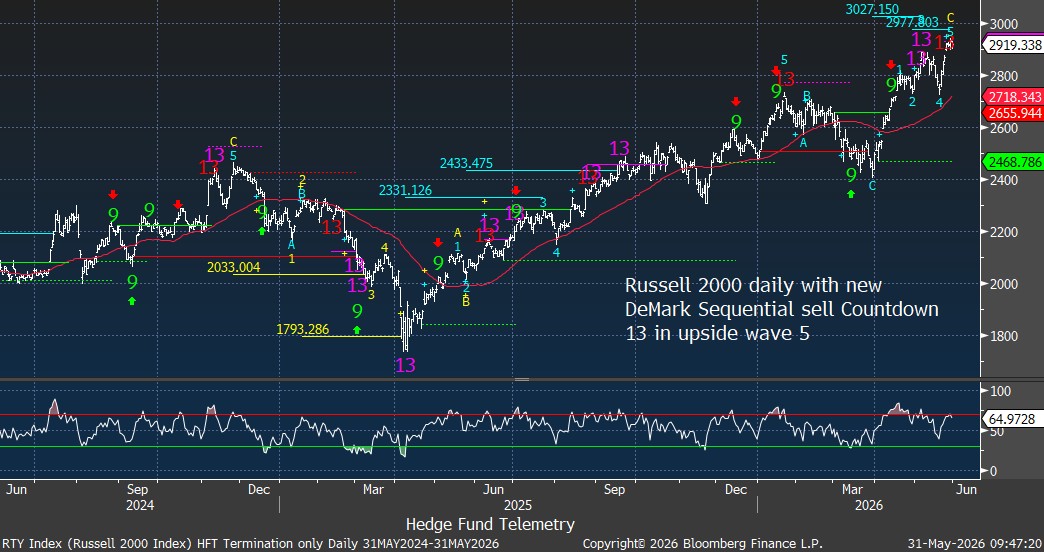
The same message is coming from small caps. The Russell 2000 recently completed its own Sequential Countdown 13 while pushing toward new highs. Unlike prior rallies driven almost exclusively by mega-cap technology, participation has broadened to include small caps. Bulls will argue for rotation, not collapse.
The bullish inflation story is that it can start to cool, or the bearish story is that it reaccelerates in the coming months.
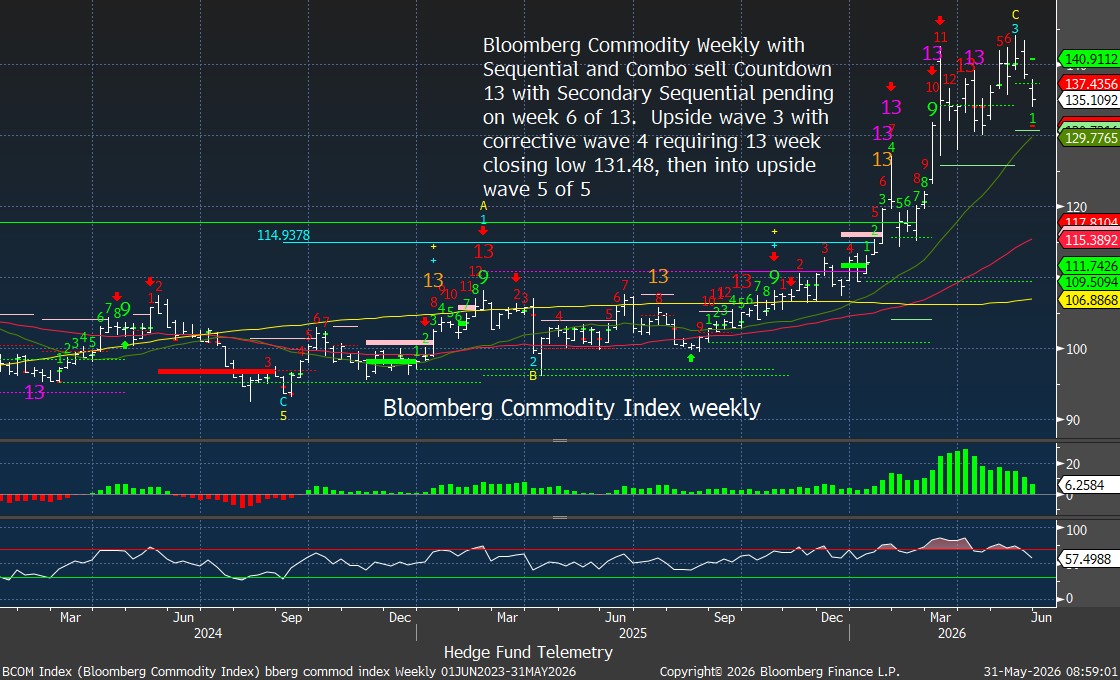
The Bloomberg Commodity Index recently completed Sequential and Combo 13 sell signals following a powerful advance. Gold remains soft despite generating a new buy Countdown 13, while silver has largely stalled. Commodity momentum is fading across several markets and could be a corrective higher-low wave 4 of 5 pattern. Economic bulls hope commodities enter a corrective phase and inflation expectations cool without requiring a recession. Gold and Crude are nearing upside reversals after the pullbacks. Spoiler alert: It is time to start buying some gold with a plan to scale into this.
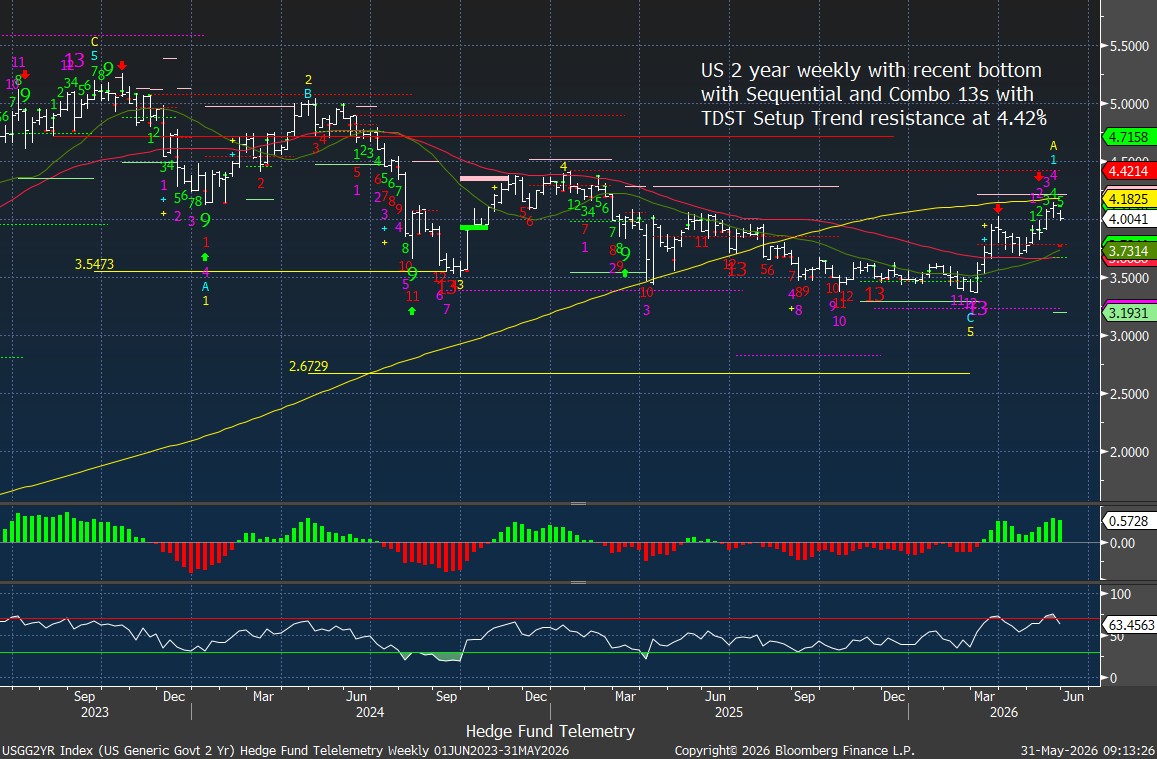
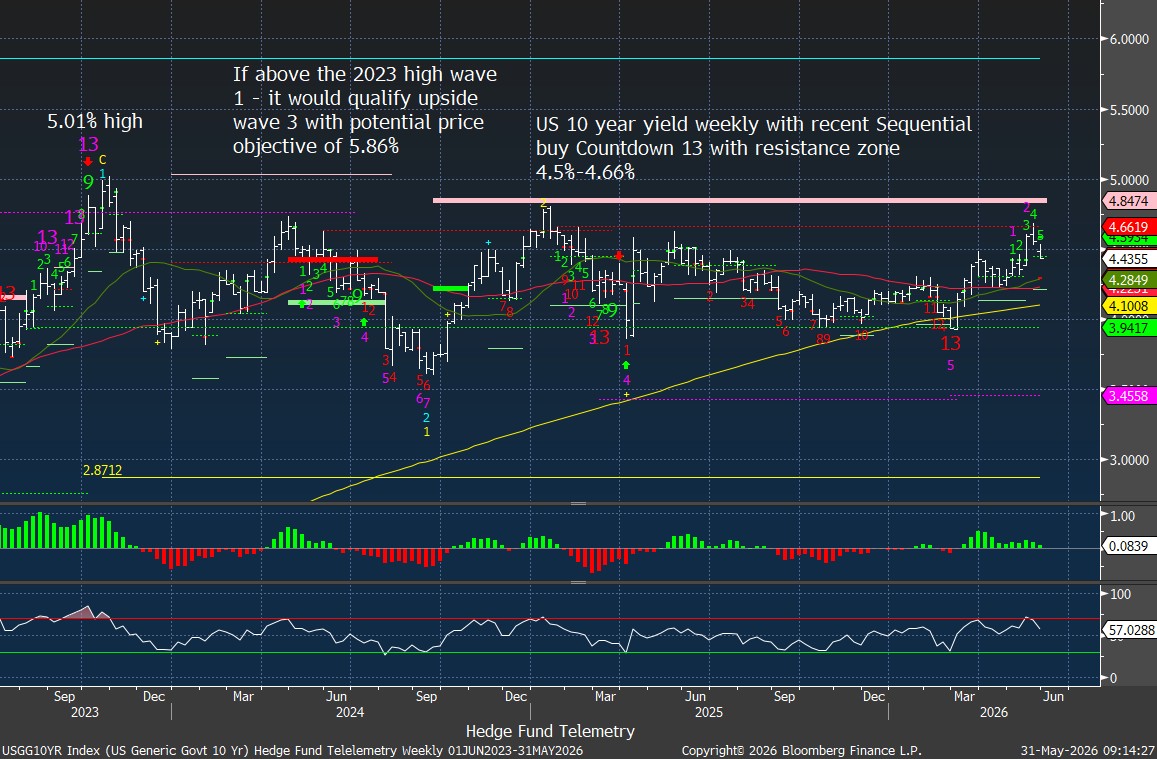
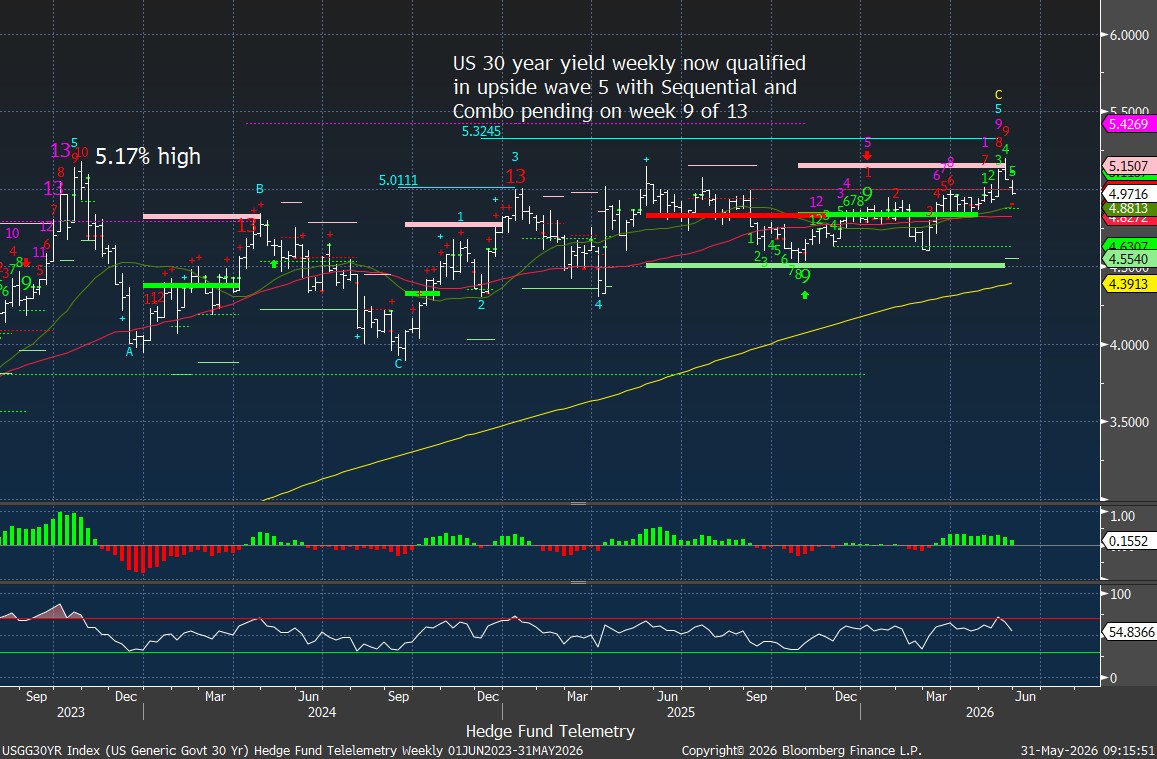
That possibility matters given the bond market, with rates recently pulling back. The 10-year Treasury yield continues to test major resistance between 4.50% and 4.66%, while the 30-year remains near cycle highs at around 5%. Both are displaying their own signs of exhaustion. If inflation pressures ease, yields may stabilize rather than continue higher, supporting equity multiples and extending the current cycle. Rates remain elevated across the curve and the Fed Funds Rate expectations are skewed for the next move to be a rate hike. The bar, politically, is high for the new Fed Chairman, Warsh, to even discuss a hike.
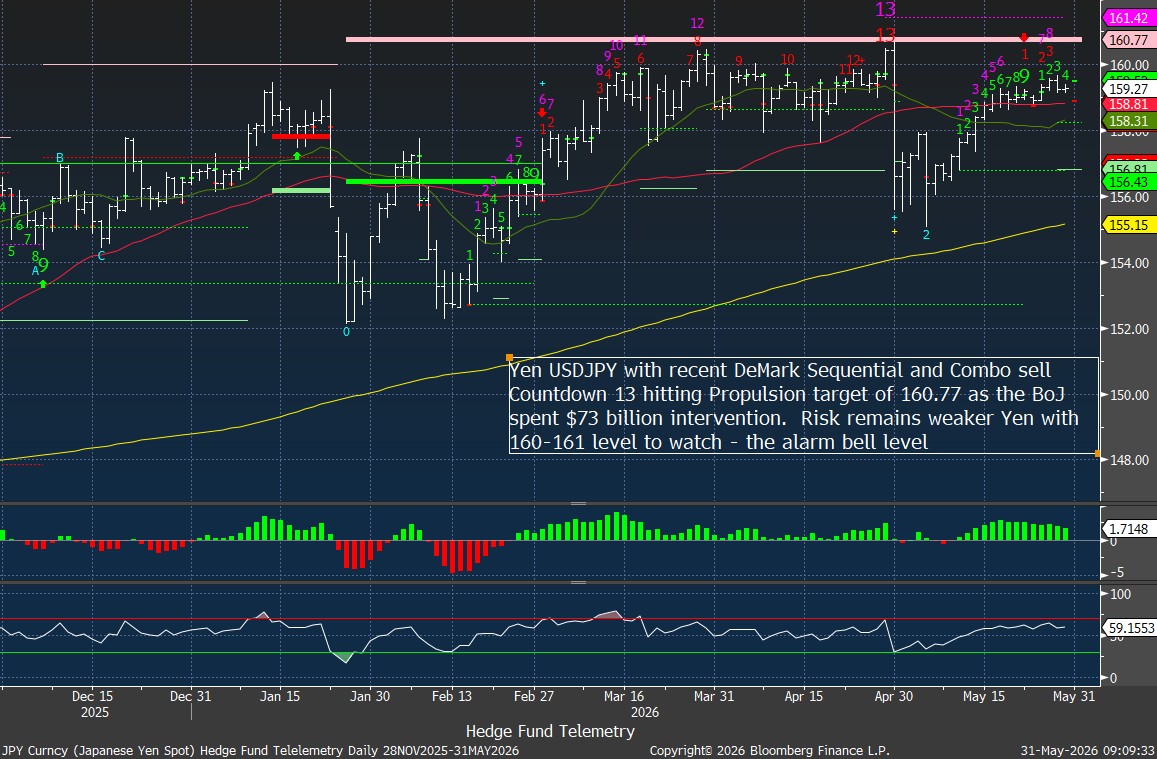
One of the largest macro risks remains Japan. USD/JPY has reached the critical 160-161 zone after completing multiple exhaustion signals across daily and weekly timeframes. The Bank of Japan has already demonstrated a willingness to intervene aggressively, but it’s been useless. A sustained move above this level would increase the risk of intervention, pressure global carry trades, and tighten liquidity conditions. If there is one chart capable of disrupting the current risk-on environment, it is the Yen.
Outside the United States, the equity picture is becoming more mixed. Europe is beginning to show signs of fatigue following a strong advance, while the Euro Stoxx 600 has generated sell Countdown signals and, more recently, an elevated number of sell Countdown signals on many individual stocks. India continues to lag in global markets, while Japan and Korea remain among the strongest-momentum markets, albeit with increasingly mature markets and Korea’s dangerous upside structures.
Crypto markets tell a different story. Bitcoin recovered following a major exhaustion sequence earlier this year to the downside-sloping 200-day, and remains below key resistance levels. Ethereum continues to lag, remaining trapped within a broader corrective structure. Neither market is fully confirming the speculative enthusiasm currently visible in equities.
Taken together, the evidence suggests a market that is increasingly stretched but not yet vulnerable to a major cyclical decline.
Speculation is elevated. Sentiment is euphoric. Positioning is exceptionally crowded and levered. Momentum is extreme.
The bullish case has credit remaining healthy. Participation has broadened. Inflation pressures may be easing. Commodity momentum is fading. Earnings expectations continue to improve, particularly across AI infrastructure and semiconductors.
The highest-probability outcome remains a summer consolidation or correction led by the largest AI beneficiaries rather than the start of a new bear market. The “catch-down” scenario.
The cycle is becoming increasingly mature.
Late cycle, not end cycle.
Let’s get into the details.
HEDGE FUND TELEMETRY MACRO SCOREBOARD
| Category | Score | Trend | Commentary |
|---|---|---|---|
| Liquidity | 0 | → | Tight but stable. Watch USDJPY and Treasury issuance. |
| Monetary Policy | -1 | → | Restrictive policy remains in place, due to inflation risks despite growth resilience |
| Growth | +1 | ↓ | Slowing but not breaking. Labor markets remain supportive, with consumer sentiment at dire levels. |
| Inflation | 0 | ↓ | Commodity exhaustion suggests inflation pressures may peak but remain elevated for months ahead. |
| Market Internals | -1 | ↓ | Breadth divergences persist beneath new highs. Narrow |
| Sentiment | -2 | ↑ | NAAIM, extreme options activity, and leverage reflect excessive optimism with sentiment in the extreme zone >80% |
| Valuation | -1 | ↓ | Elevated versus rates and historical norms. |
| Credit | +2 | ↑ | Tightening spreads continue supporting risk assets. Watch new DeMark signals. |
| Geopolitics | -1 | ↑ | Slowing but not breaking. Labor markets remain supportive, even as consumer sentiment remains at dire levels. |
Macro Score Total: -3 Late Cycle Expansion
The scoreboard has improved materially since earlier in the year as credit spreads have tightened, commodity momentum has faded, and growth has remained resilient. The environment remains late-cycle but does not yet resemble a pre-recession setup.
EQUITY INDEX PROBABILITY FRAMEWORK
| Scenario | Probability | Description |
|---|---|---|
| Rotation / Consolidation | 50% | Leadership narrows, AI pauses with “catch-down”, broader market catches up |
| Continued Bull Trend | 30% | Credit deteriorates, and liquidity conditions tighten |
| Major Correction | 20% | Credit deteriorates, and liquidity conditions tighten, AI trade breaks |
The market is likely entering a period in which gains become harder to achieve rather than impossible. The debate is whether leadership broadens or narrows further.
MARKET FRAGILITY INDEX Current Reading: 6 / 10
Elevated but Stable
| Asset Class | Fragility | Bias | Key Driver |
|---|---|---|---|
| S&P 500 | Medium | Neutral | Breadth divergences |
| Nasdaq / AI | High | Correction Risk | Crowded positioning |
| Treasury Yields | High | Volatile | Inflation expectations |
| Dollar | Medium | Neutral | Policy divergence |
| Commodities | Medium | Consolidation | Exhaustion signals |
| Credit | Low | Bullish | Tight spreads |
| Global Equities | Medium | Rotation | Regional divergences |
The market remains vulnerable to shocks, but systemic stress remains absent.
Credit remains the key difference between today’s environment and prior major market peaks. That might change this summer if spreads start to widen, if the AI funding/huge buildout plans weaken, or if private credit/equity slips on a banana.
Credit spreads are narrow with exhaustion
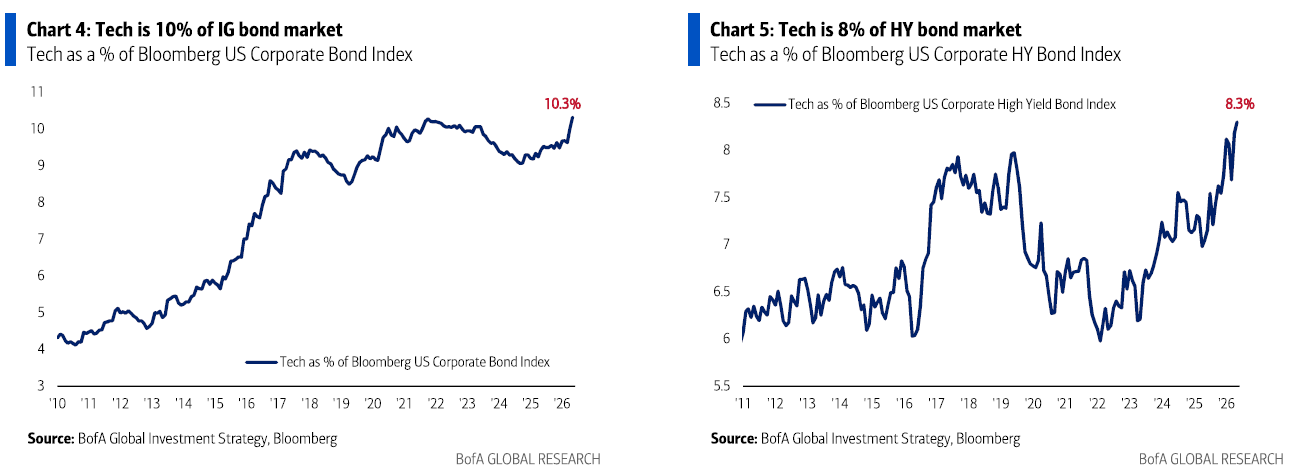
The most important charts in the entire market remain High-Yield and Investment Grade Credit spreads
Credit spreads continue to tighten despite elevated equity valuations and rising rates. Historically, major bear markets begin when credit deteriorates first. Today, credit continues to be supportive and off the warning signs radar.
Until this changes, it remains difficult to build a high-conviction bear market case.
Key Charts
- CDX High-Yield and Investment Grade Credit Spreads with new DeMark Countdown 13’s
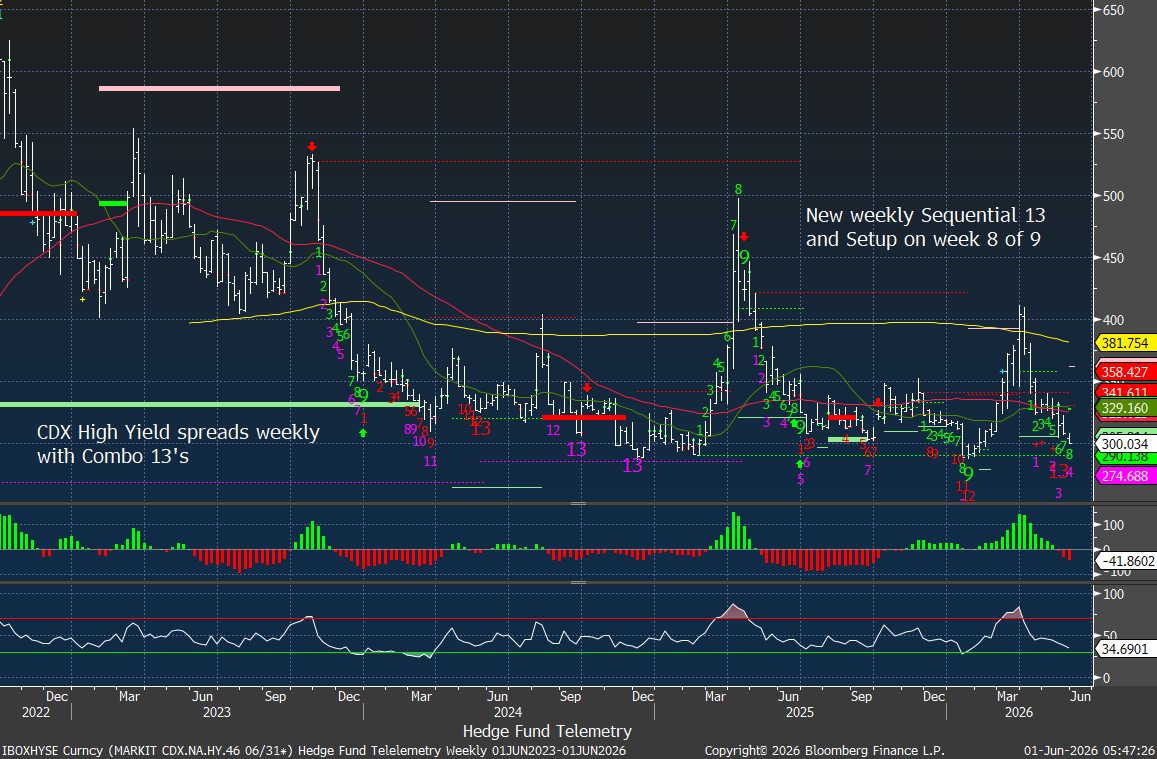
High-Yield spreads on a weekly time frame are also developing exhaustion signals
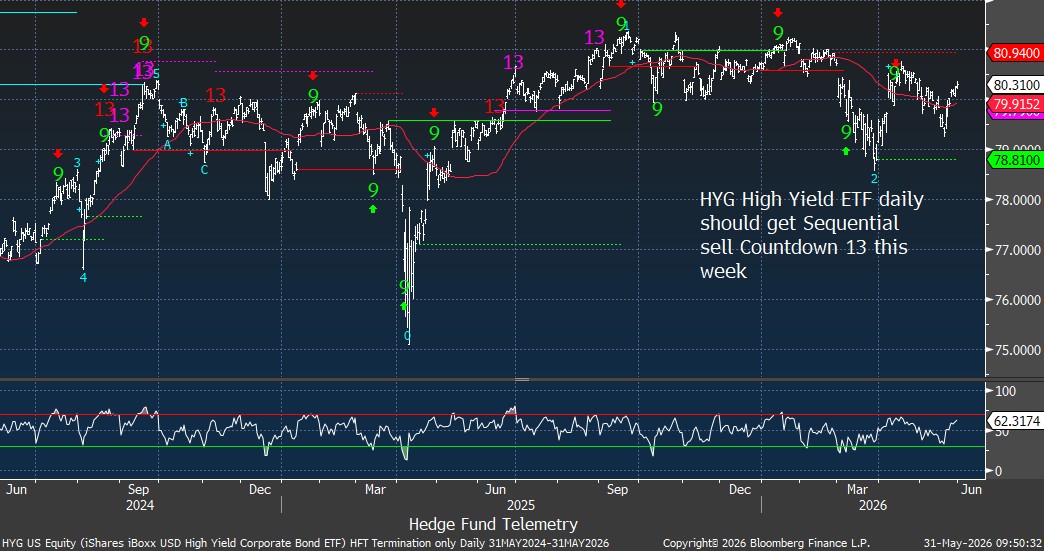
HYG weekly will get a new Sequential sell Countdown 13 this week.
The tech sector has the highest exposure within credit markets
Inflation: Peaking or just a pullback
The Bloomberg Commodity Index weekly recently completed Sequential and Combo 13 exhaustion signals. Secondary Sequential is lurking, with potential to qualify a corrective higher low wave 4 followed by upside higher high wave 5.
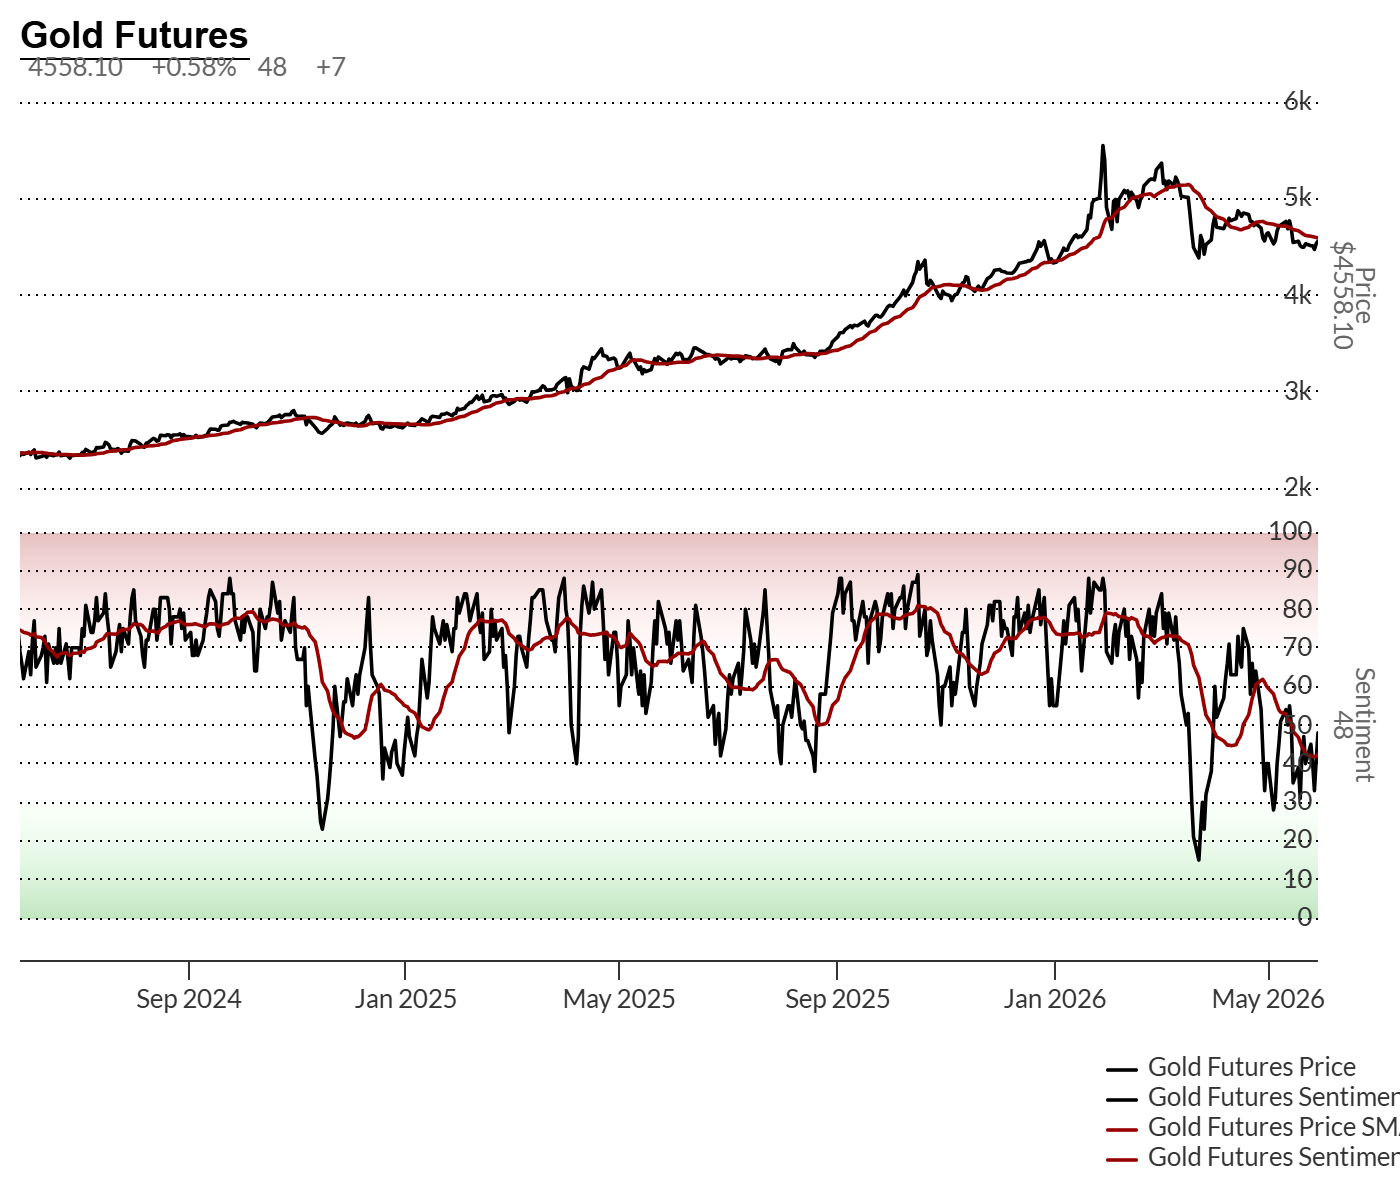
The bull case for gold
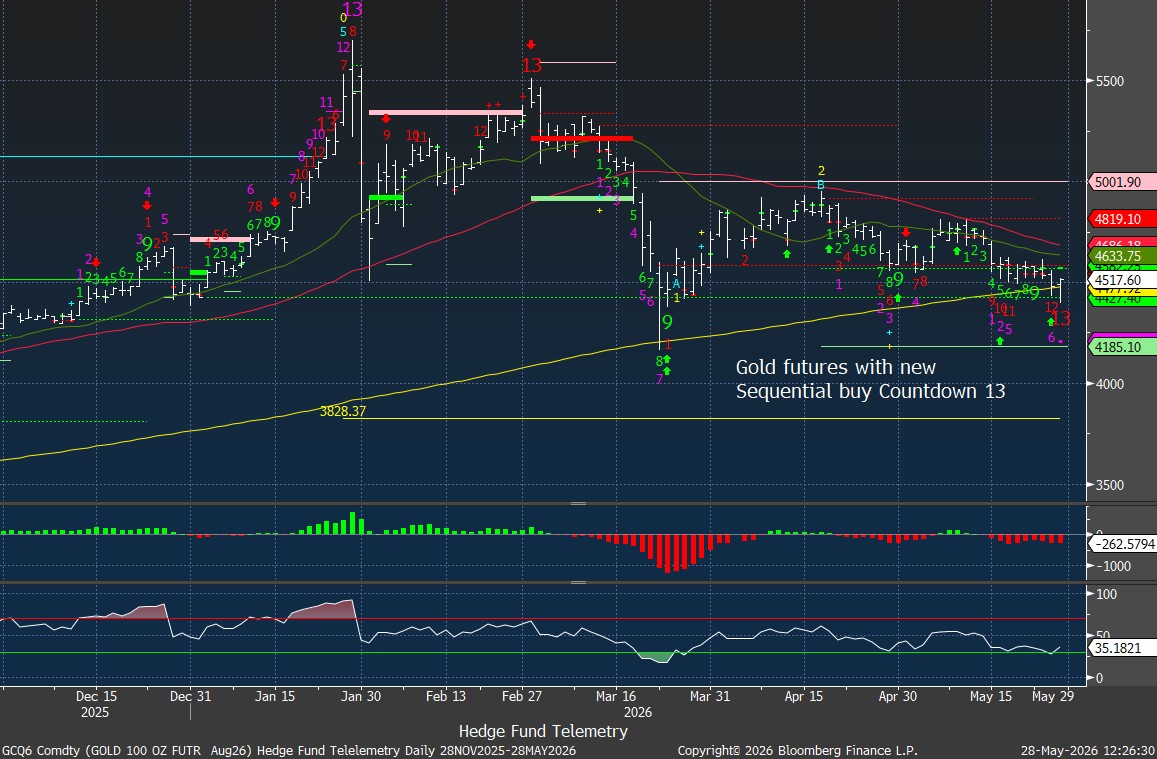
Gold now has:
- Sequential Buy Countdown 13
- Oversold momentum
- Improving sentiment despite not getting fully oversold
- Significant support at the 200-day
This dramatically changes risk/reward. Gold conviction scale:
| Gold Level | Conviction |
|---|---|
| Above 4500 | Moderate |
| 4400-4300 | High |
| 4200-4100 | Very High |
| Under 4000 | Maximum Conviction |
Gold Futures with new Sequential buy Countdown 13 at the 200-day (yellow line)
Gold vs USD with new Sequential buy Countdown 13.

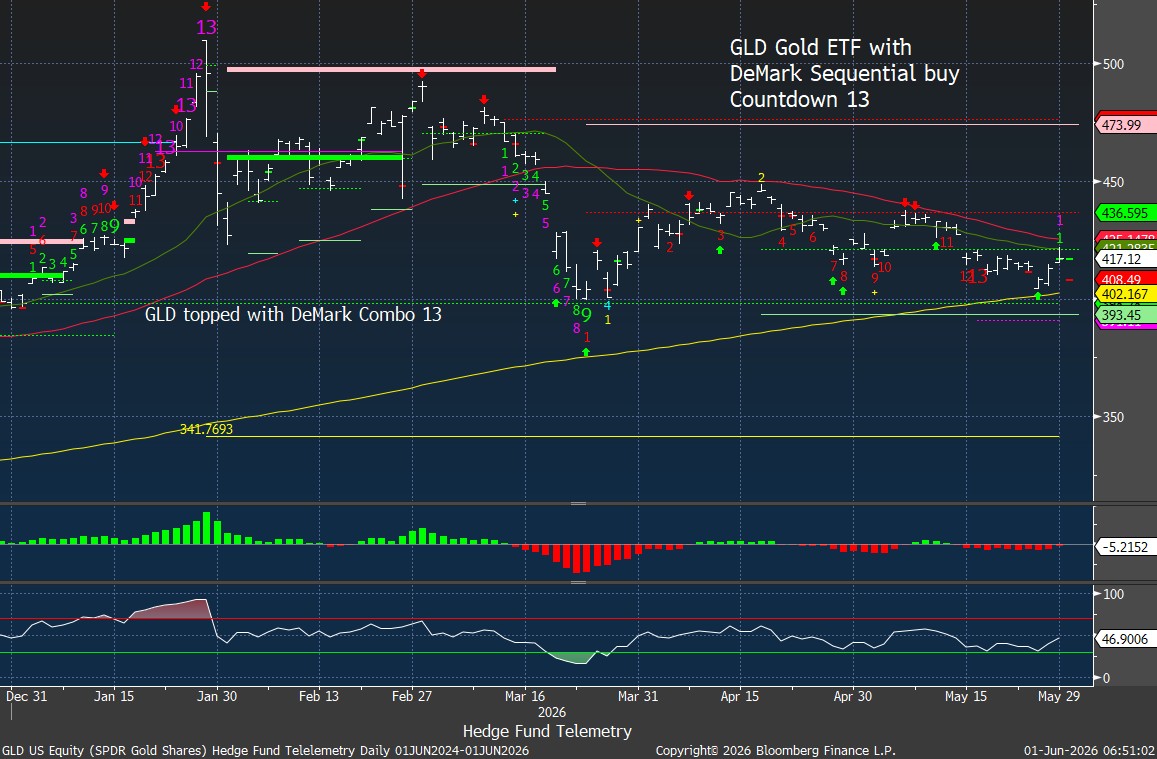
GLD Gold ETF also with Sequential buy Countdown 13
Gold bullish sentiment over the past two years has bounced from these levels
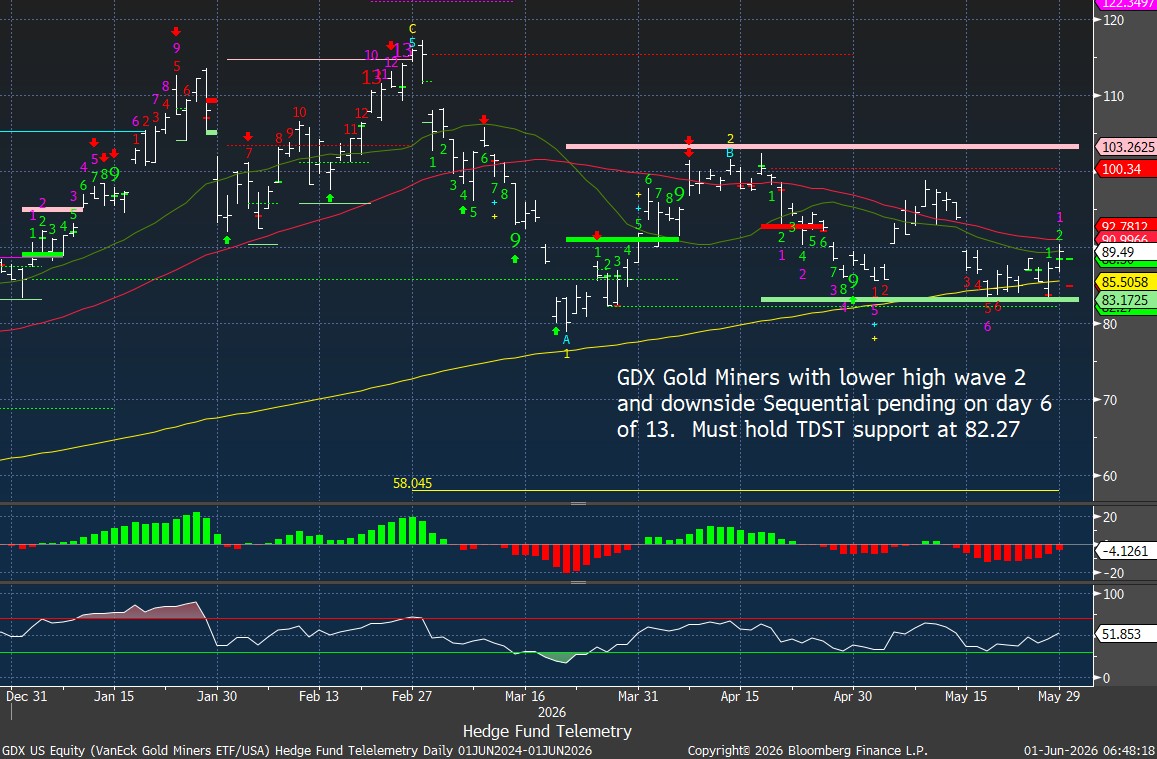
GDX Gold Miners doesn’t show exhaustion yet, and I’d like to buy GDX soon based on the signals. This needs to hold the TDST Setup Trend support.
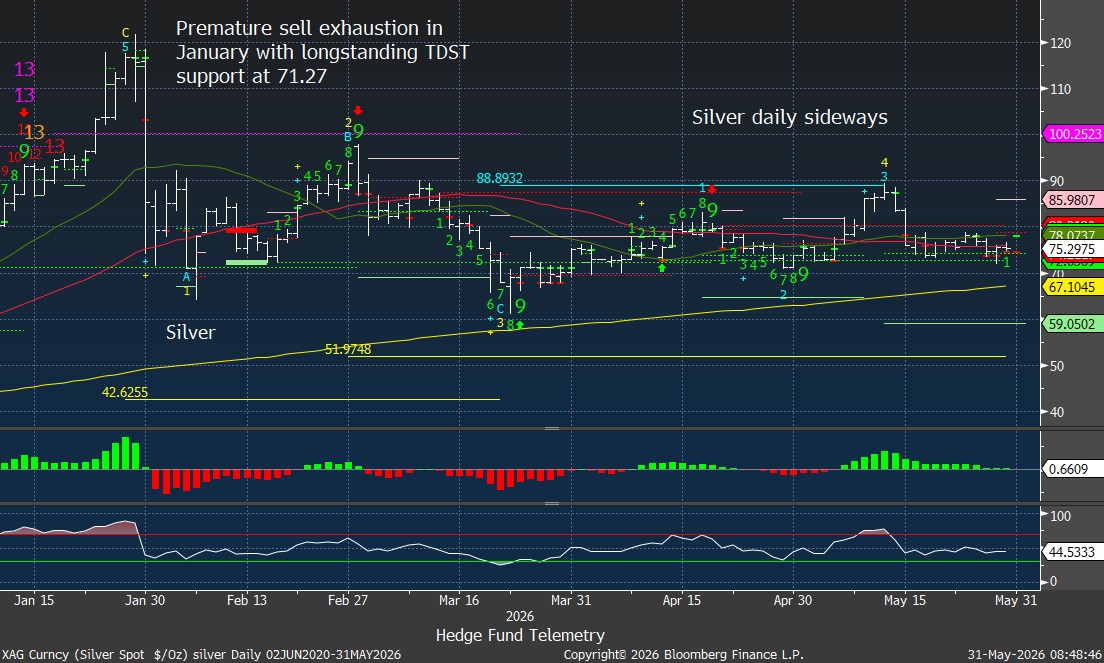
silver and copper view = neutral
Silver doesn’t have the same signals as gold so I’ll stick with gold for now.
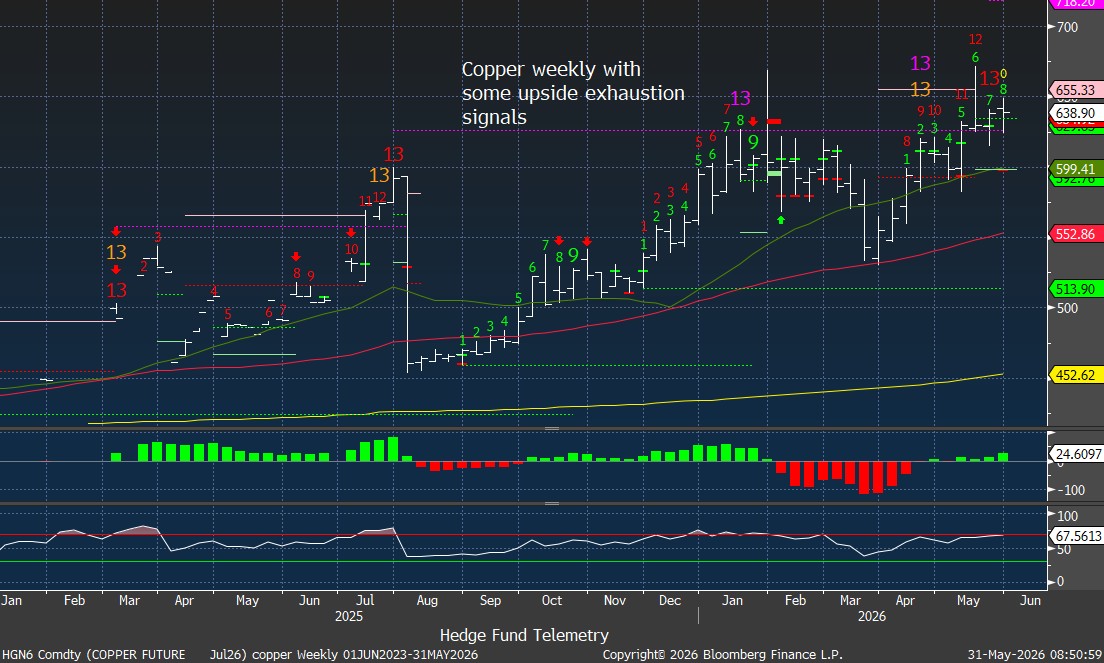
Copper daily still has an upside trend intact, holding upside sloping 20 and 50 day
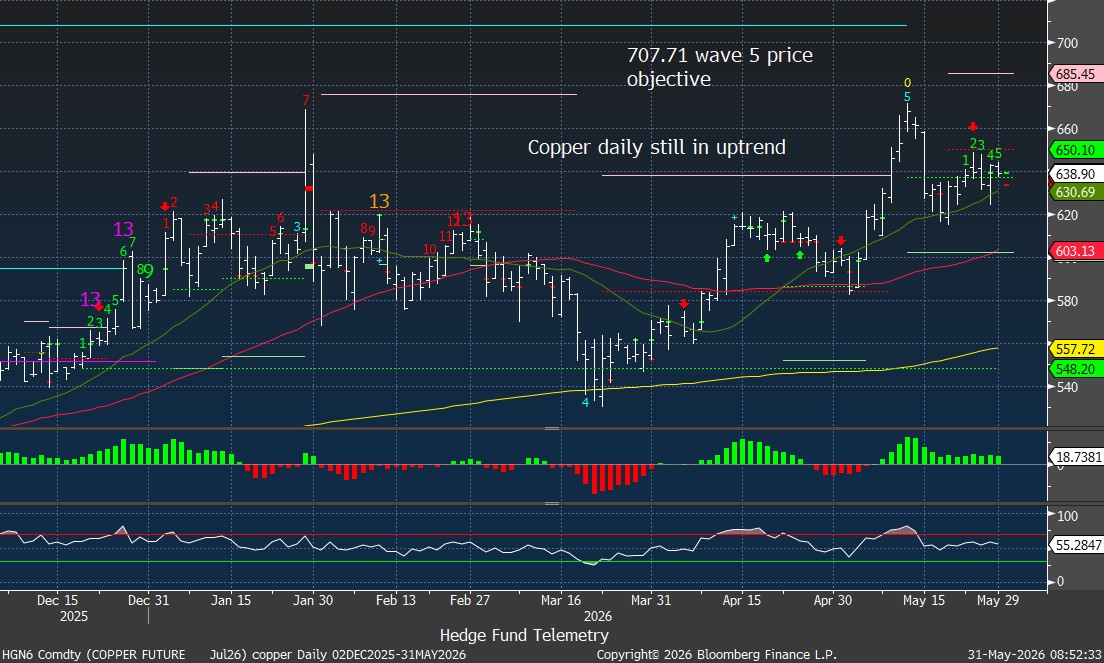
Copper weekly has some upside exhaustion to note.
crude thoughts
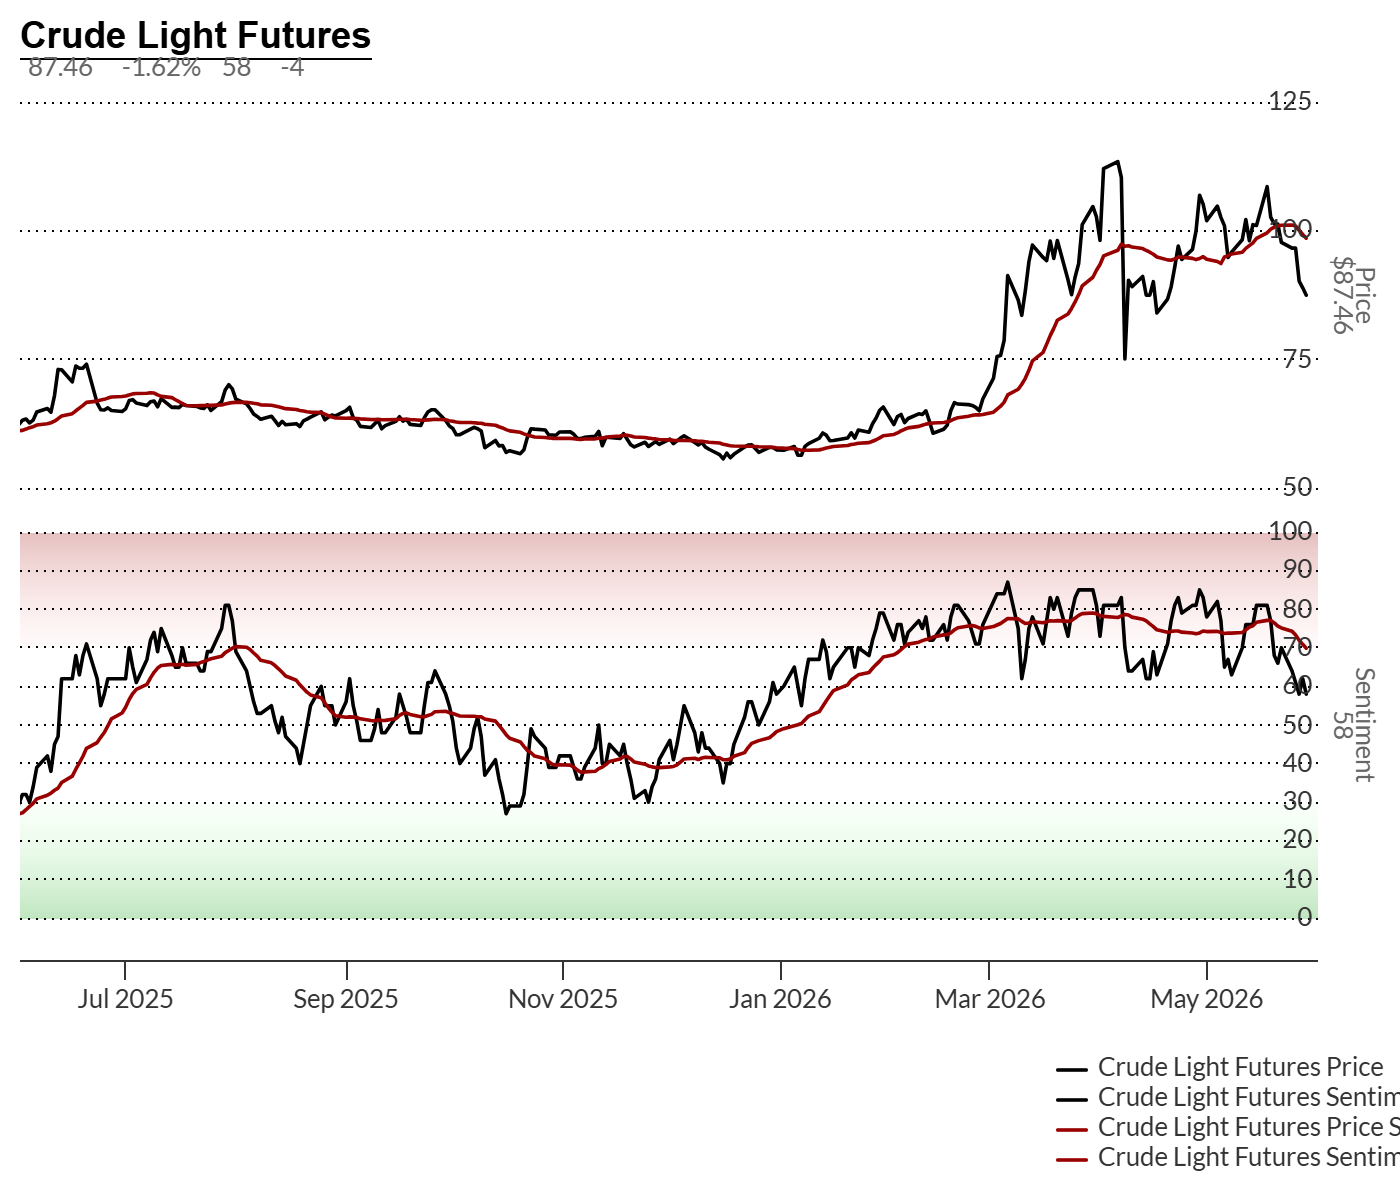
Crude bullish sentiment has pulled back to levels where it bounced during the US-Iran war. Breaking 50% likely will see deeper move in crude price with sentiment support at 30%
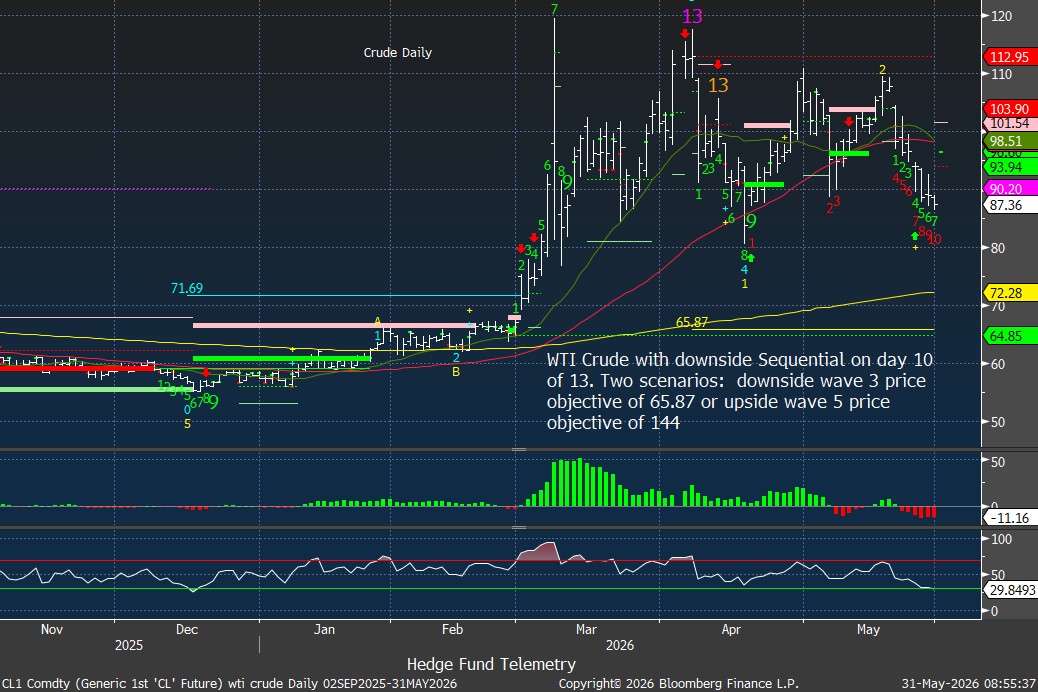
WTI Crude daily with Sequenital on day 10 of 13. Getting closer to downside exhaustion, perhaps this week.
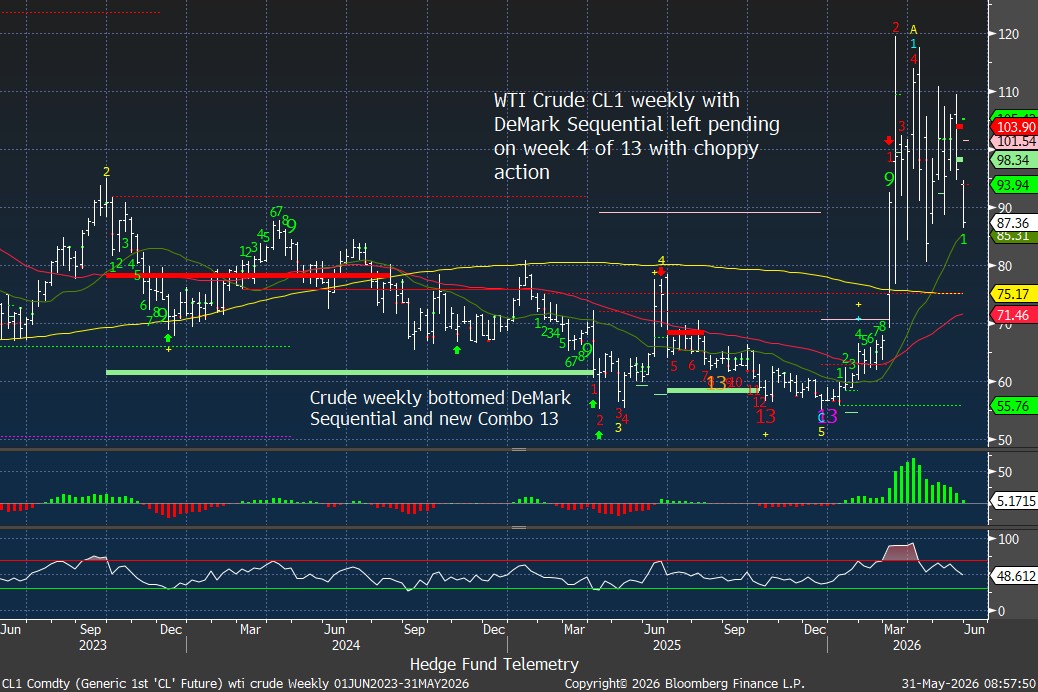
Crude weekly had buy Countdown 13’s at the end of the year and I said crude was one of my favorite commodities for a lift of 10-20%. We got a little more upside than expected.
Small Caps with upside exhaustion in wave 5
The Russell 2000 continues making higher highs while carrying exhaustion signals of its own in final upside wave 5
Equity Positioning Has Become Extreme
The most obvious risk today is positioning, leverage, and concentration.
NAAIM exposure has surged to 98%.
Prime Broker leverage remains near cycle highs. Gross exposure at 100th percentile on all time frames!
Momentum exposure sits at record levels at GS Prime Brokerage
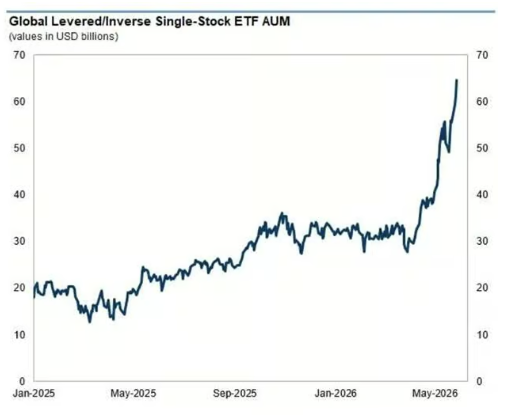
Global leveraged single stock AUM has more than doubled in the last two months! SK Hynix and the memory chip concentration.
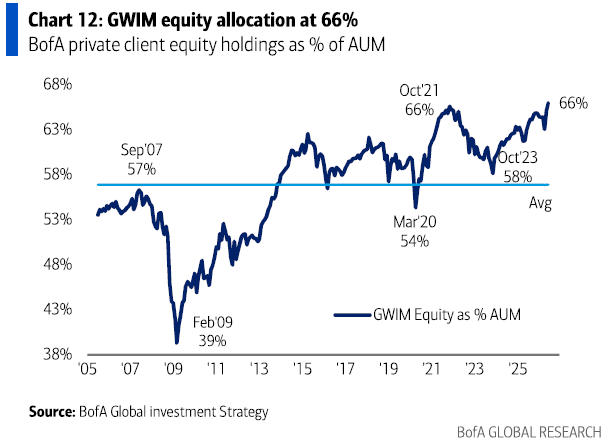
Investors are all in with the highest equity exposure in years
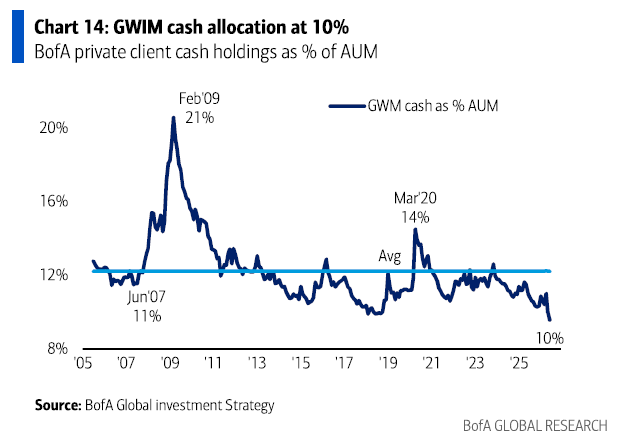
While cash levels are at historical lows.
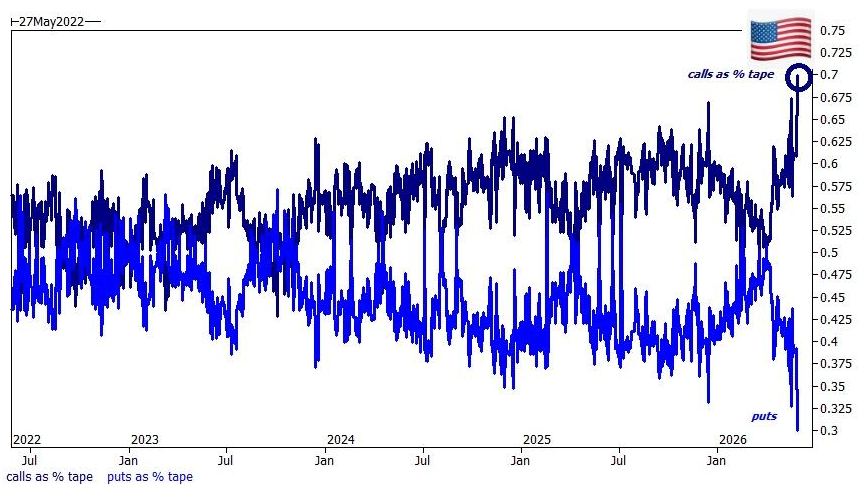
Options activity remains overwhelmingly skewed toward call extreme buying. This is dangerous speculation that ends badly.
GS posted this one, which clearly shows the extreme call buying and lack of put buying.
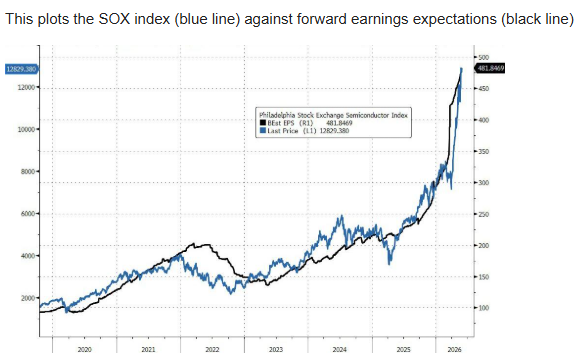
So much is riding on the AI infrastructure narrative, and has skewed earnings for the S&P vs other sectors.

Korea, japan, hong kong, india markets
The AI trade continues attracting disproportionate capital in Korea.
The KOSPI has become the clearest global expression of AI enthusiasm, with weekly Sequential and Combo 13 signals now suggesting the risk-reward profile is becoming dangerous, especially given some of the crazy stats mentioned above.
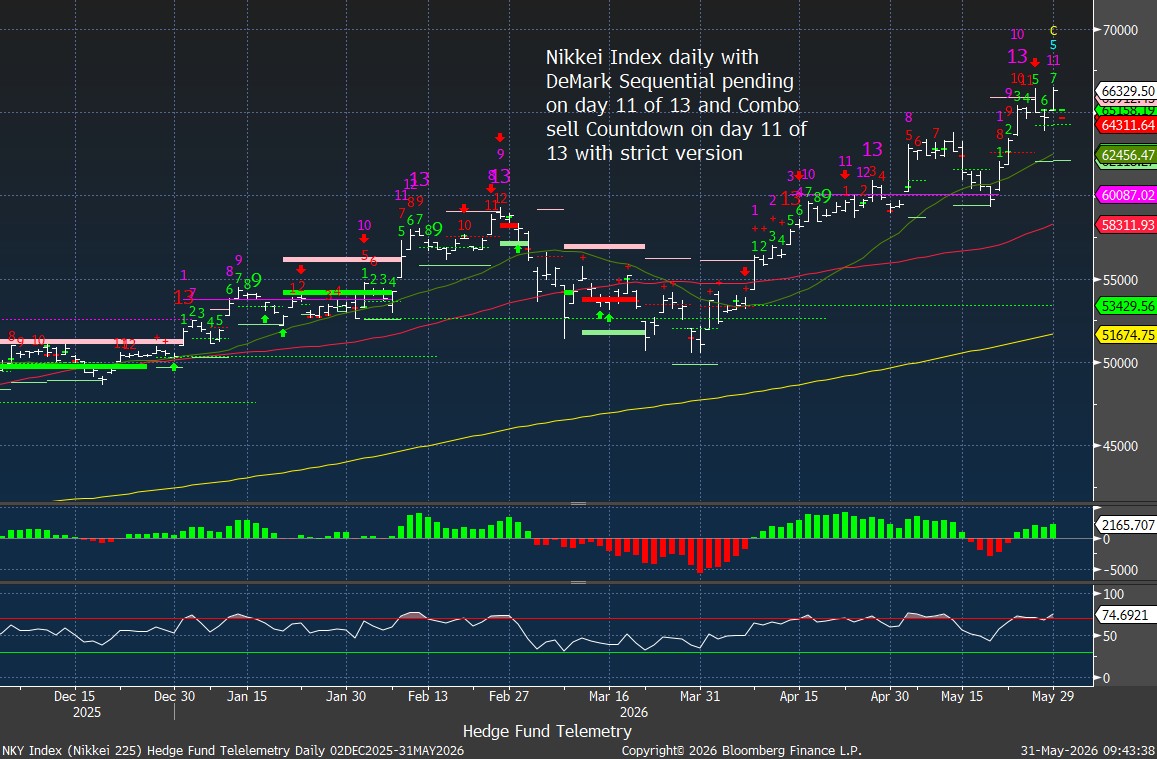
Japan trend still strong with exhaustion signals possible soon
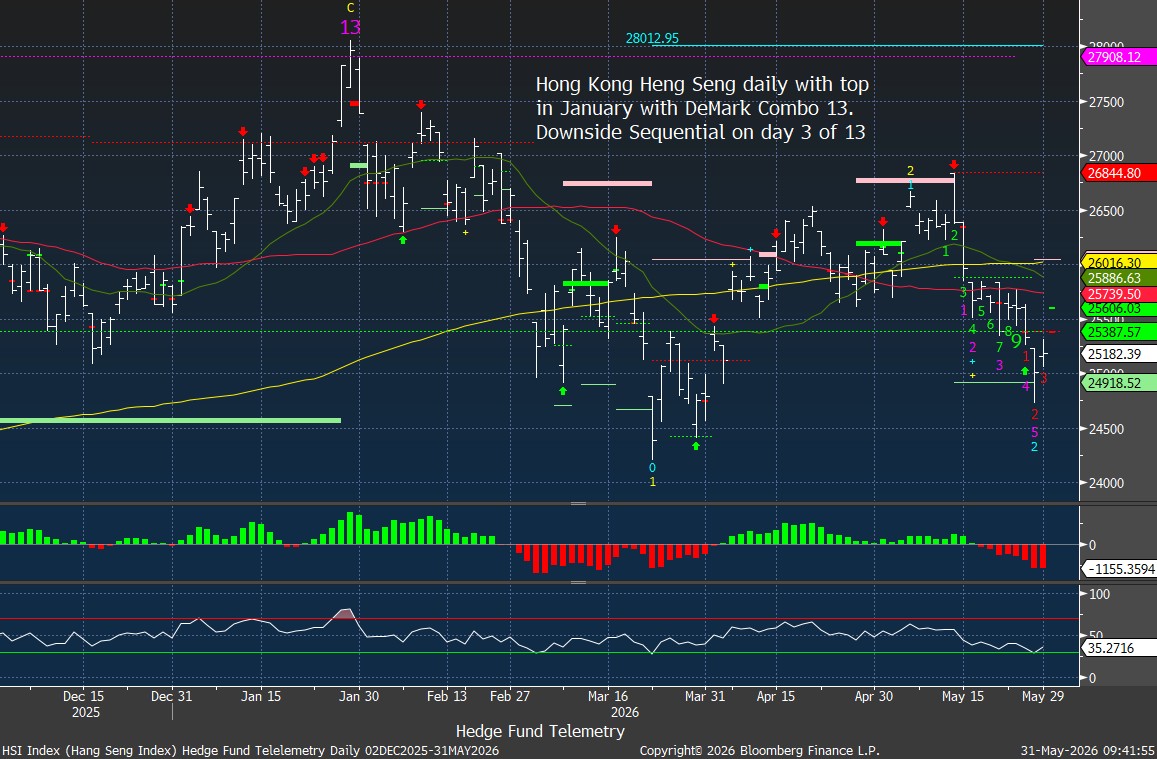
Hong Kong weakness
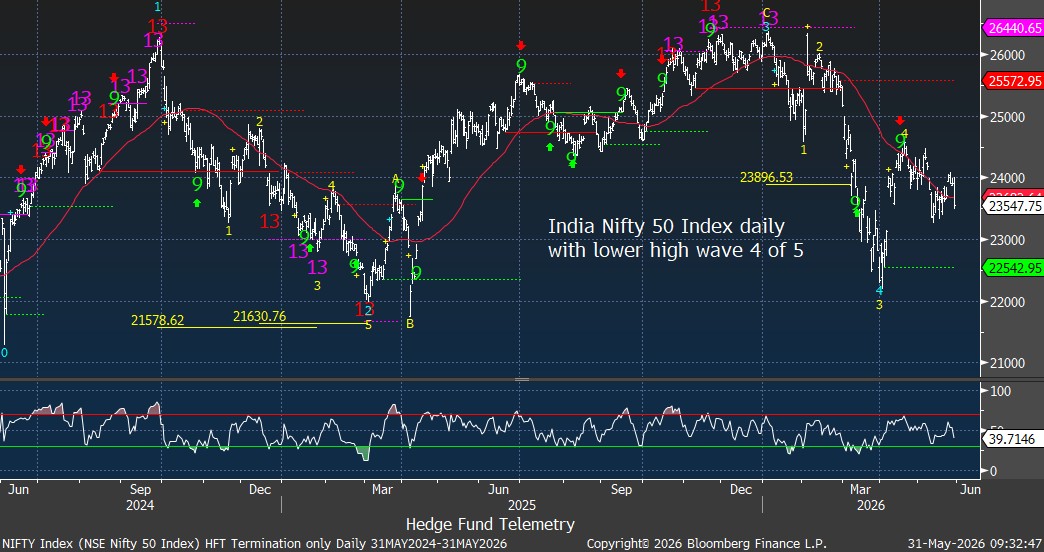
India weaknesss
Europe
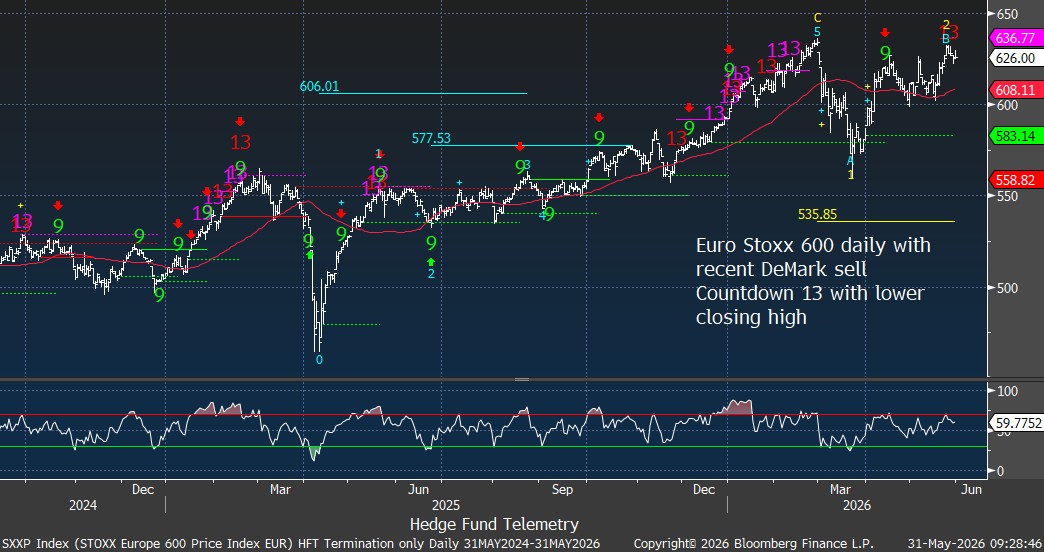
Euro Stoxx 600 with a new Sequential sell Countdown 13 and a slightly lower high vs the February high.
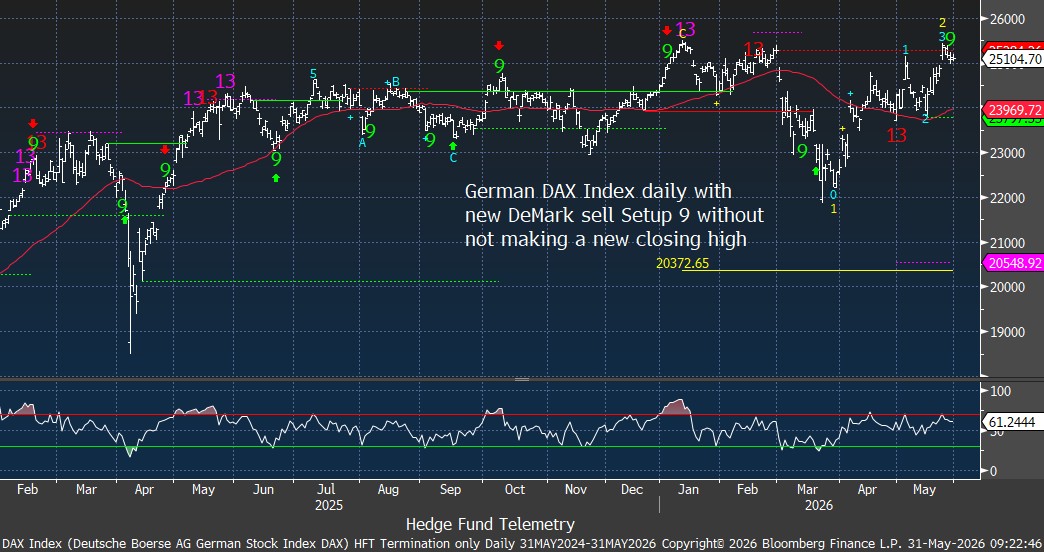
German DAX with new sell Setup 9 and still with closing low below the January high
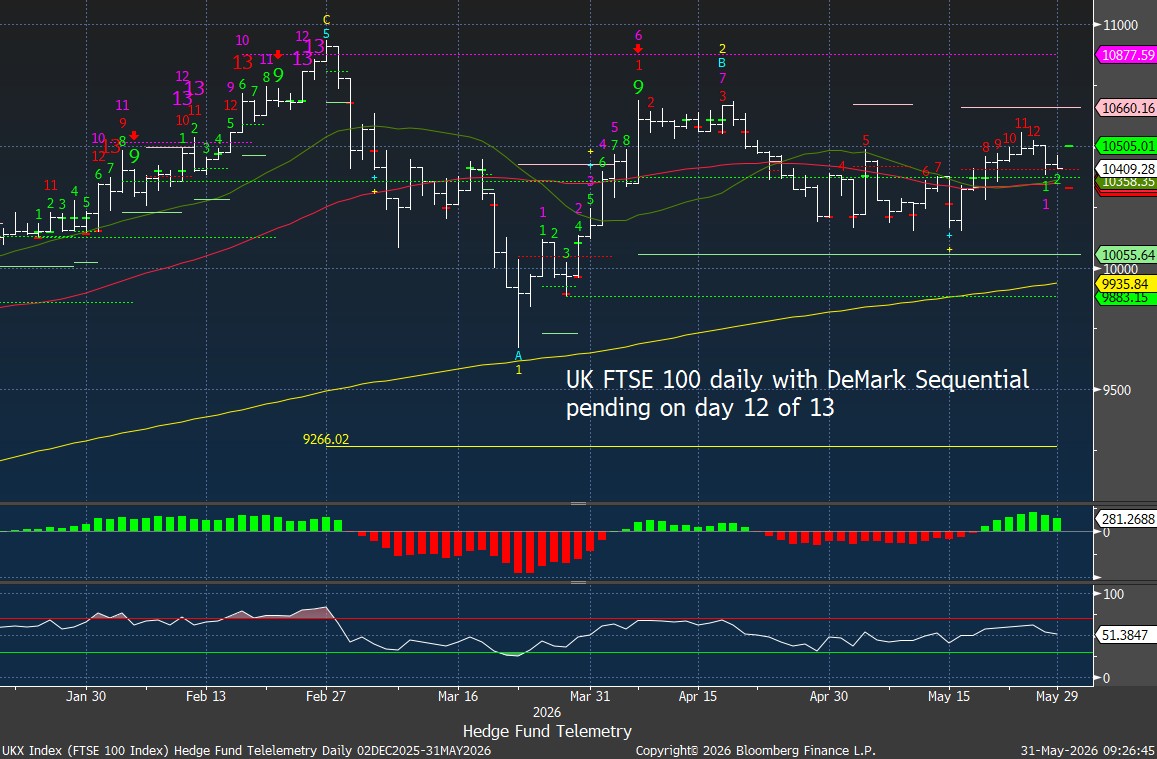
UK FTSE 100 with lower highs
us market indexes to watch
Nasdaq 100
Weekly Setup 9 is approaching completion. Blow off top mode.
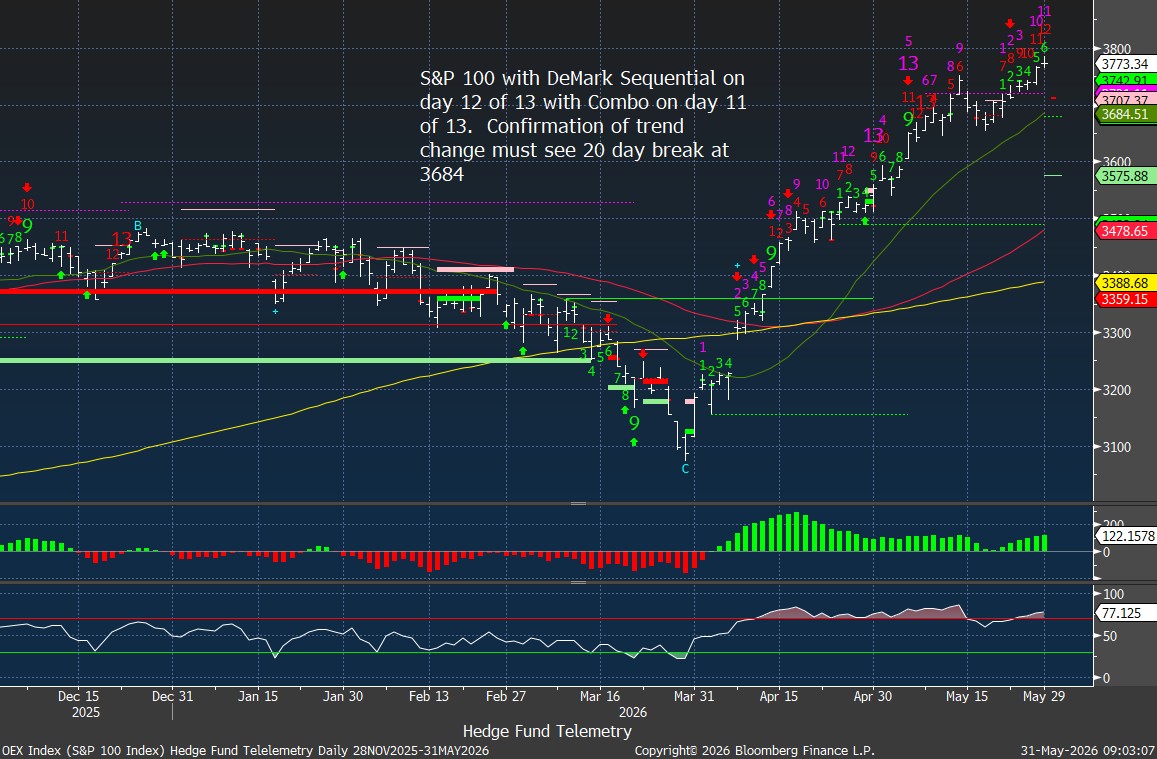
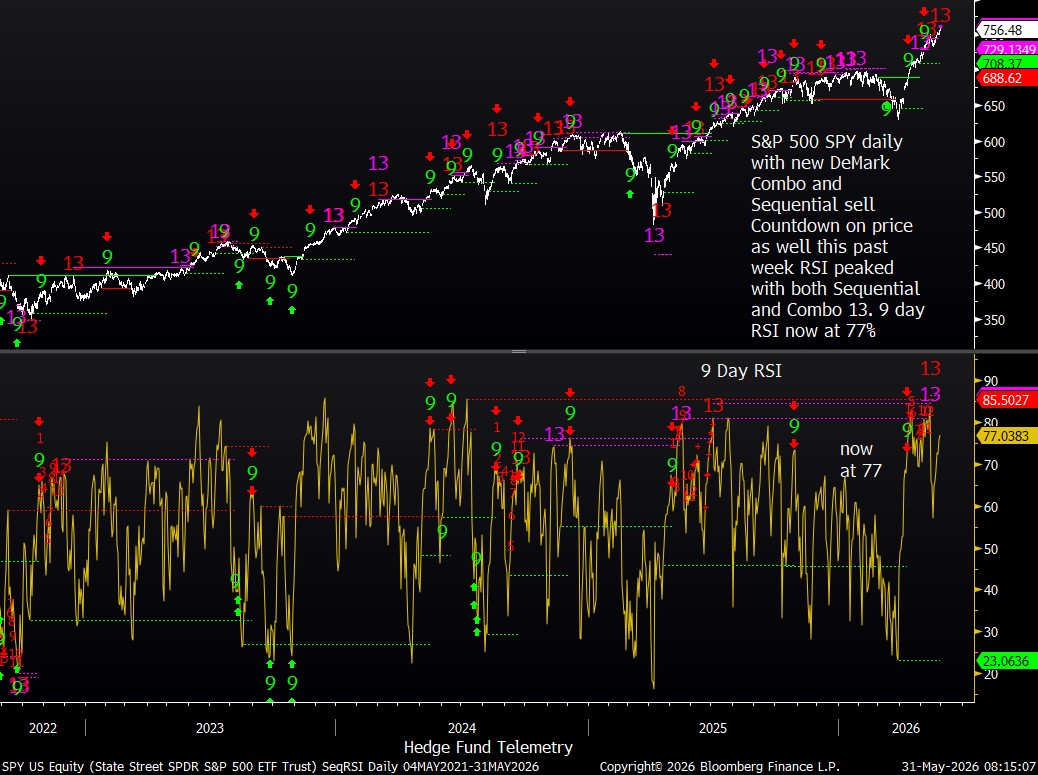
S&P 100 and 500 upside exhaustion
S&P 100 with daily Sequential and Combo exhaustion signals developing. This is the meat of the market with the mega caps. NOTE: On all these index exhaustion signals with the trend so strong, let’s get some confirmation under the 20-day.
The S&P has upside exhaustion 13 as does the percentage of S&P stocks above the 50 day only at 54% – huge negative divergence with price action.
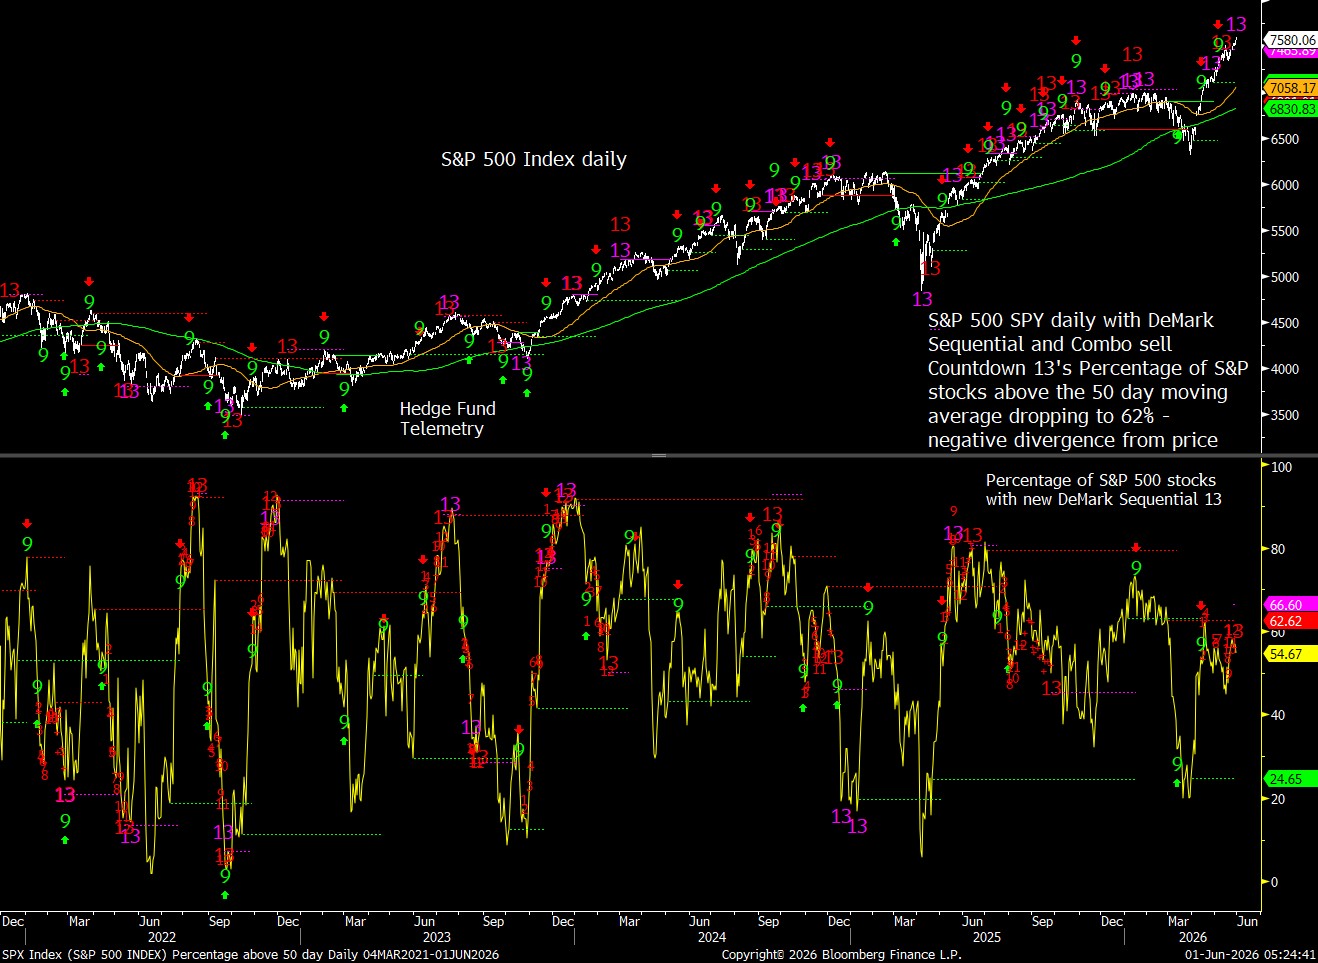
The 9 day RSI peaked recently with new Sequential and Combo sell Countdown 13’s – divergent from price action.
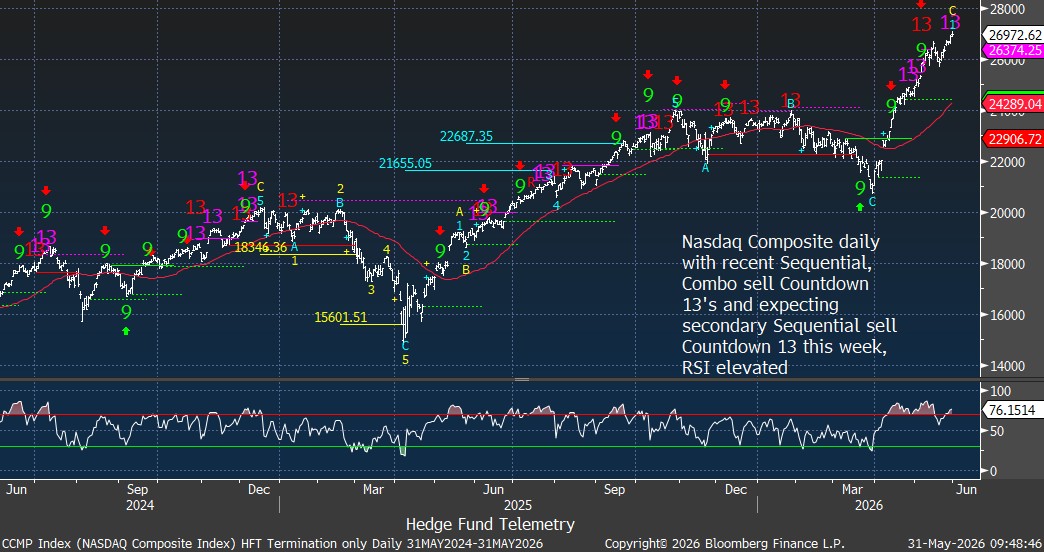
Nasdaq composite
Nasdaq Composite is in parabolic blow-off top mode with upside exhaustion.
yen risk
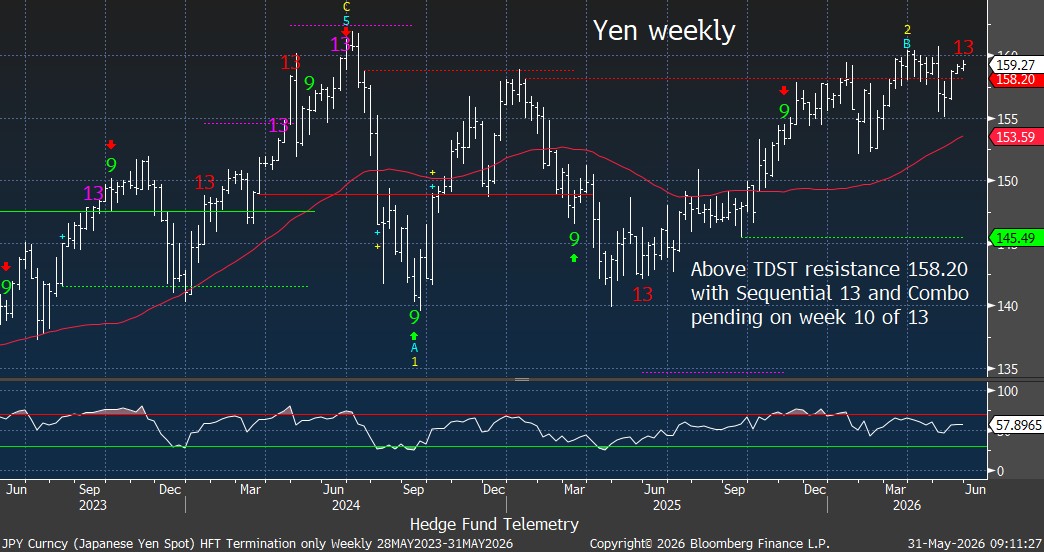
160-161 remains the global liquidity alarm bell for USDJPY, clearly shown on both daily and weekly charts.
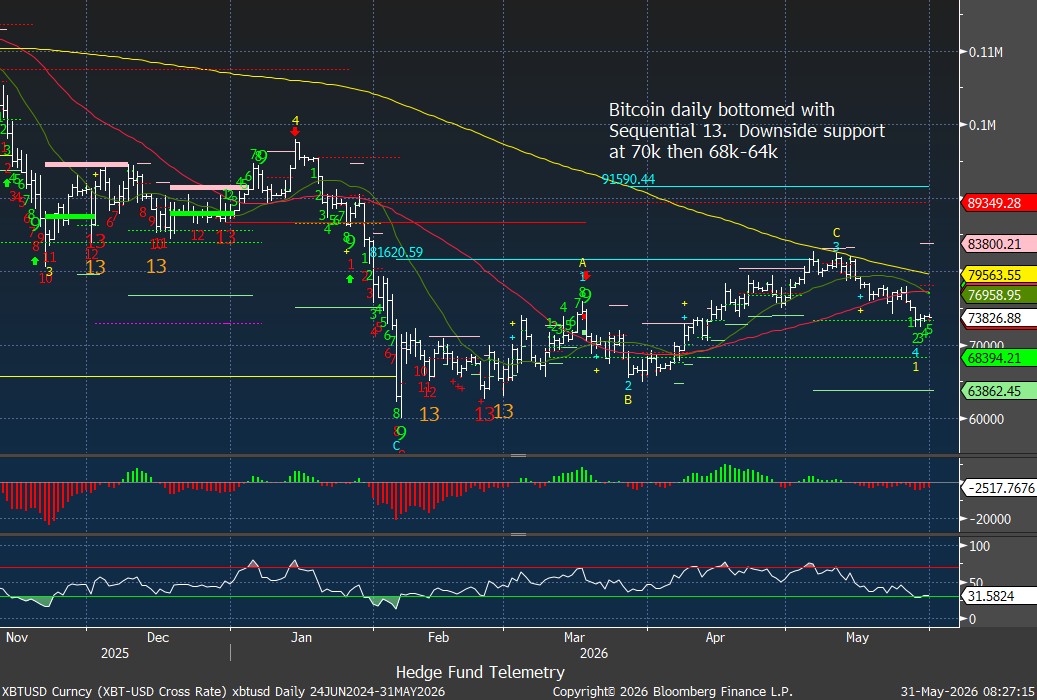
Crypto did not join the speculation party
Bitcoin daily bounced off the downside wave 5 price objective with DeMark Sequential buy Countdown 13. Bounce failed at the downside, sloping 200-day.
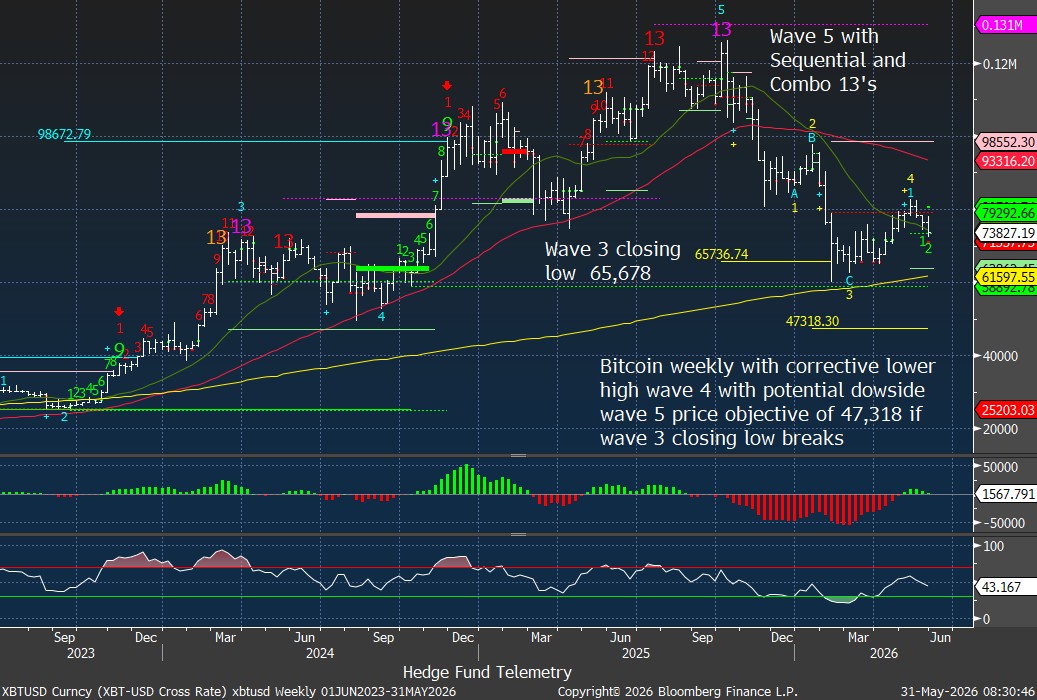
The weekly chart has a corrective lower high wave 4 of 5 pattern with risk of moving into downside wave 5
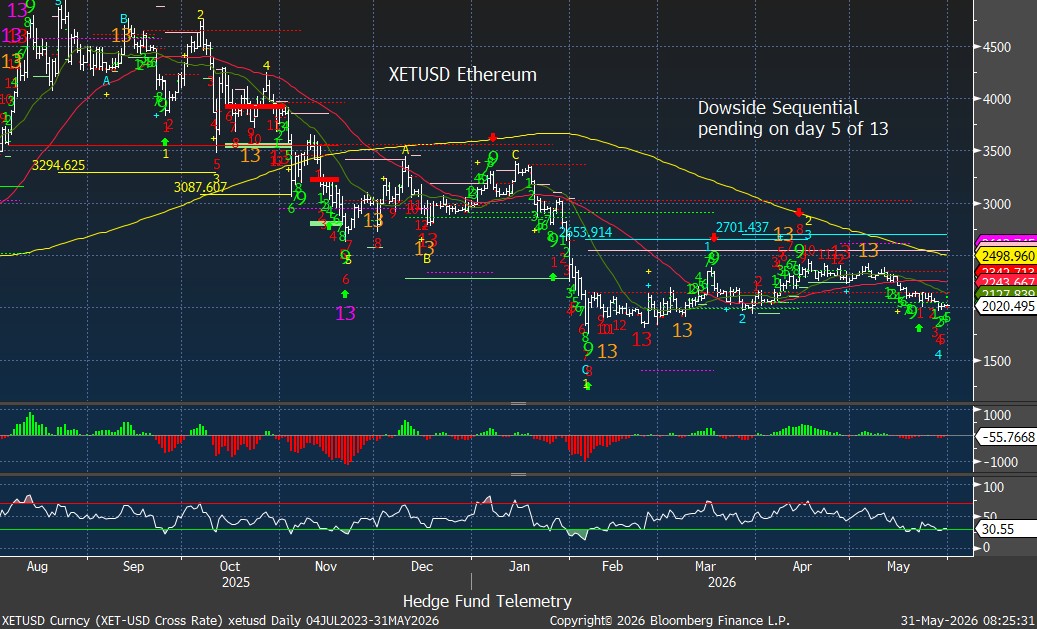
Ethereum doesn’t look good and has a downside DeMark Sequential Countdown in progress.
Treasury Yield upside Breakout risk remains
Recently I published an interim Big Picture note that highlighted the risks with inflation in the Treasury markets. This is being tested now as rates moved higher. A slight pullback from highs hasn’t shifted the risks enough.
If the Treasury curves see rates move higher simultaneously, probabilities shift toward a larger correction with weekly charts.
BOTTOM LINE
The market increasingly resembles 1999 leadership behavior operating within a 2017-style macro backdrop.
Speculation is evident.
Leverage is elevated.
Positioning is crowded.
Yet credit remains healthy, inflation pressures appear to be easing, and growth remains resilient for now.
The evidence supports a market that is becoming more fragile, but not yet broken.
Late Cycle remains the correct framework. End Cycle does not.
Highest Probability Outcome: Rotation and consolidation.
Biggest Risk: Liquidity disruption via USDJPY and credit.
I’ll have interim notes as things develop through June. I welcome your thoughts and feedback, too!