

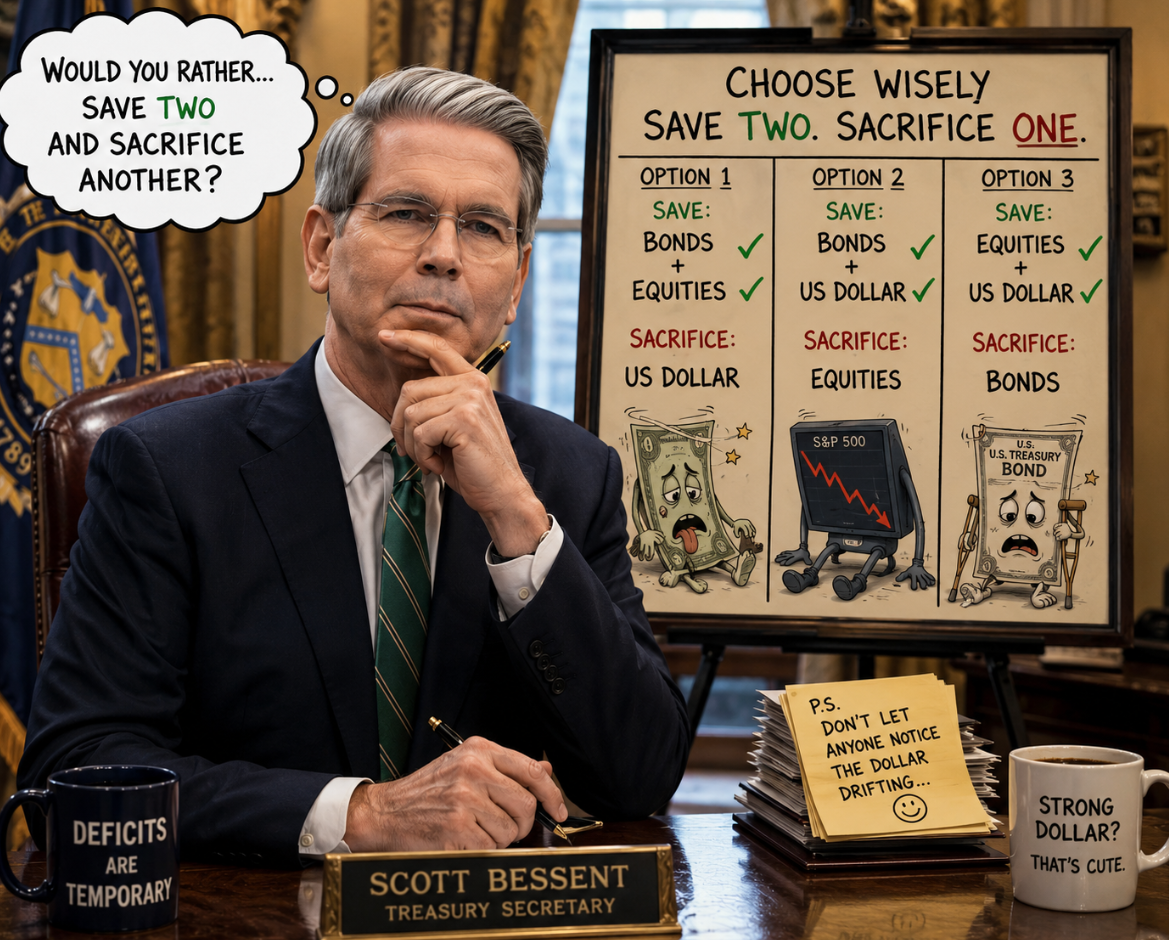
There’s a game called “Would You Rather?” where you’re given two bad choices and forced to pick one.
The U.S. Treasury may be playing its own version right now.
I had a long call yesterday with my friend Julian Brigden, one of the best macro fund managers and market historians I know. I wanted to talk about bonds because I was getting DeMark exhaustion signals and rates were spiking globally. Julian said the Treasury has a challenge. There are three markets on the table: equities, bonds, and the dollar.
The ‘would you rather’ challenge: Save two. Sacrifice one.
You can support equities and bonds, but the release valve may be the dollar.
You can defend the dollar and stabilize bonds, but the casualty may be equities as tighter financial conditions compress multiples and growth.
Or you can protect equities and the dollar, but risk allowing the bond market to clear at materially higher yields — an increasingly expensive proposition with Treasury supply continuing to grow.
What looks increasingly impossible is saving all three at once.
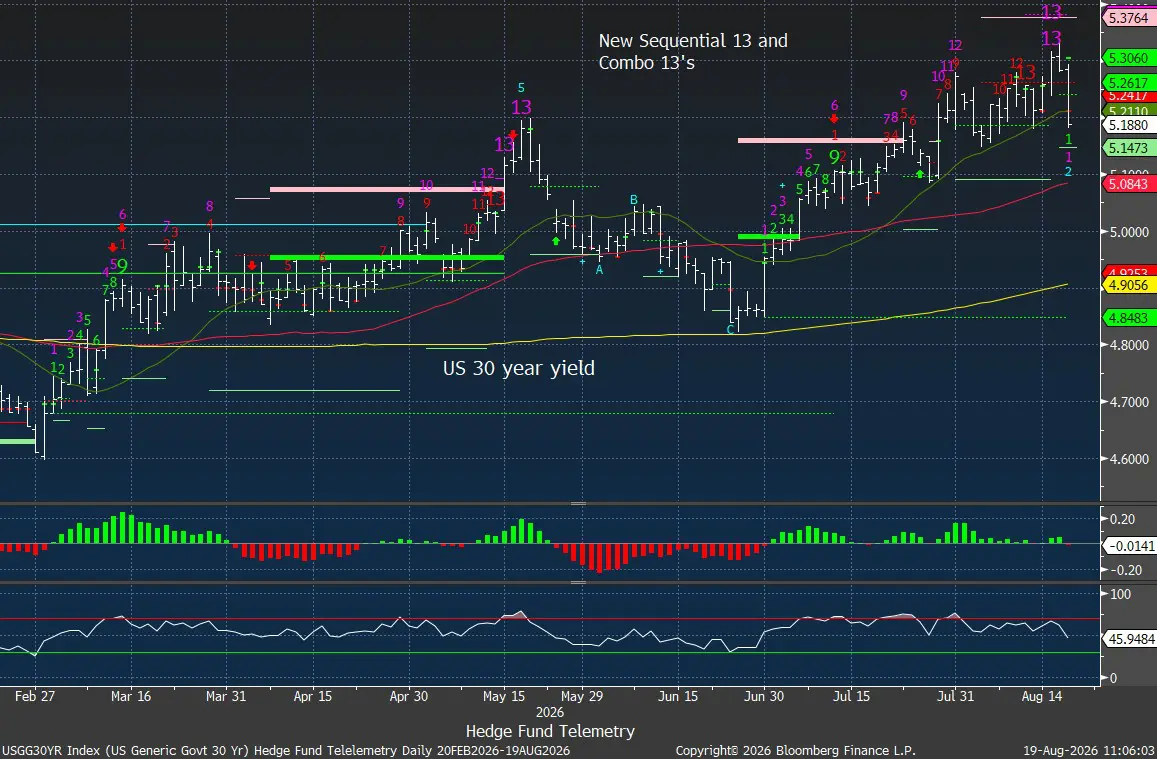
That is the macro setup investors need to understand. The 30-year Treasury yield recently pushed above 5.3%, near levels not seen since 2007, as fiscal concerns, supply and inflation uncertainty push investors to demand more compensation for owning duration.
For years, markets operated under the assumption that policymakers could cushion every meaningful dislocation. With large deficits, inflation still elevated, and Treasury supply increasingly important to price discovery, the room to maneuver looks narrower.
Would you rather?
My sense is Washington is choosing the path that inflicts the least visible political damage. And if something has to become the pressure-release valve, a weaker dollar may be easier to tolerate than a disorderly Treasury market or a major equity drawdown. Today’s Treasury announcement to support the long end of the Treasury market with increased buybacks was the one Scott Bessent chose from the three markets, as it ‘should’ help equities too. The dollar is what gets sacrificed, and we had a preview of this with the recent help with the yen intervention. There will be collateral damage from a weaker dollar. A weaker dollar will push commodity prices higher (and inflation), as we are seeing this morning. Crude is making a new high, grains are rising,Gold is up 3%. Nice because we are long gold, gold miners +8.5% (up 32% from entry), and silver up 3.2%.
The bigger risk is that markets don’t allow policymakers to choose —or, if currency interventions or increased Treasury buybacks do not work as expected. It’s not just a US-centric issue, as global yields have been increasing and other governments have similar issues. When I say do not work, that could be a period when stocks, bonds, and the dollar all decline together. That “triple-red” regime has already appeared episodically and represents the real tail risk because traditional diversification stops working when you need it most. Add in the risk of higher commodity prices, and markets could feel a lot of stress at a time when positioning within equities is elevated, combined with leverage in a narrow group focused on an AI buildout financed with everything that has to go 100% perfect to plan. And we know there is a lot at risk, and nothing is ever easy, and nothing ever goes perfectly to plan.
We’ll do our best to navigate the likely more turbulent waters ahead, which is when we thrive.
Quick Market Views
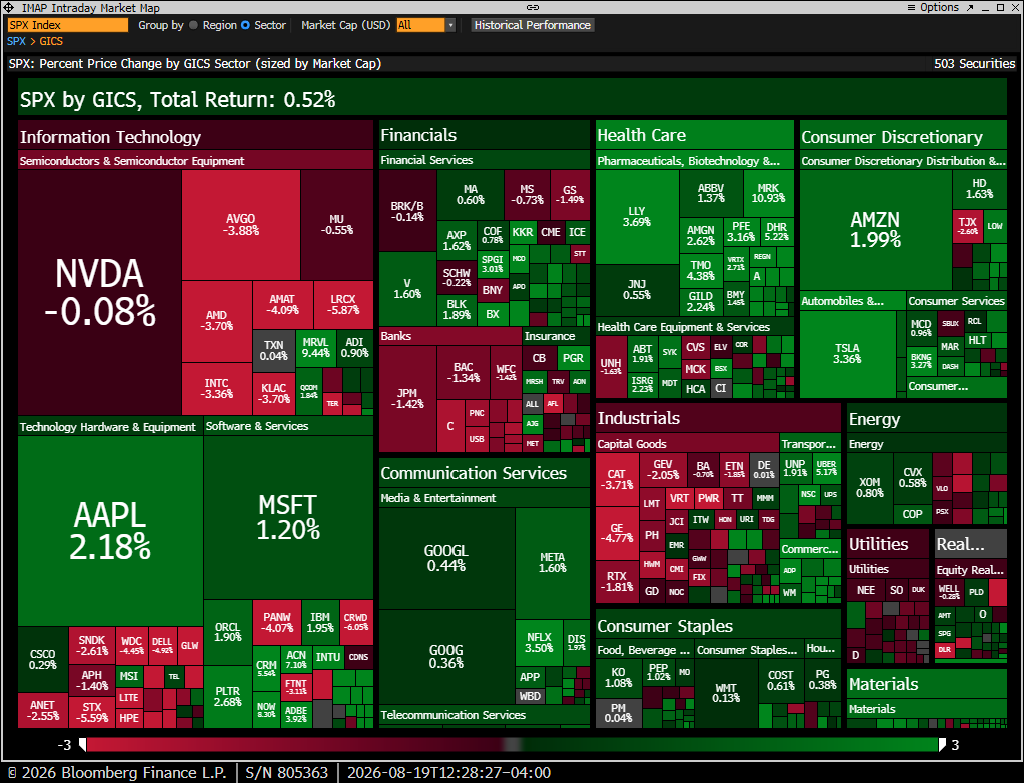
Stocks: A decent move today across the indexes, with Mag 7 strong, healthcare very strong, Consumer Discretionary and Materials doing well, yet industrials and tech are lower. Financials might have run out of mojo. (see below) Semis are down over 1%. I will hold my SMH short and wait to add to others. S&P breadth is good with 315 up and 186 down.
A great WSJ on the AI off-balance-sheet risks below.
Bonds: The big story today with the Treasury has rates down on the long end. 2’s are up 1.5bps, 10’s down 4bps, and 30’s down 7.5bps – off best levels so risk of this being a short term blink remains in the back of my mind.
Commodities: Strong day. Crude is up 1.9%, Natural Gas is up 2.5%, Gold and Silver are both up over 3%. See below
Currencies: US dollar index is getting hit hard down 0.75%. Yen is stronger too which probably has Japan happy. Bitcoin is up big 6% see below
Current Portfolio Ideas:
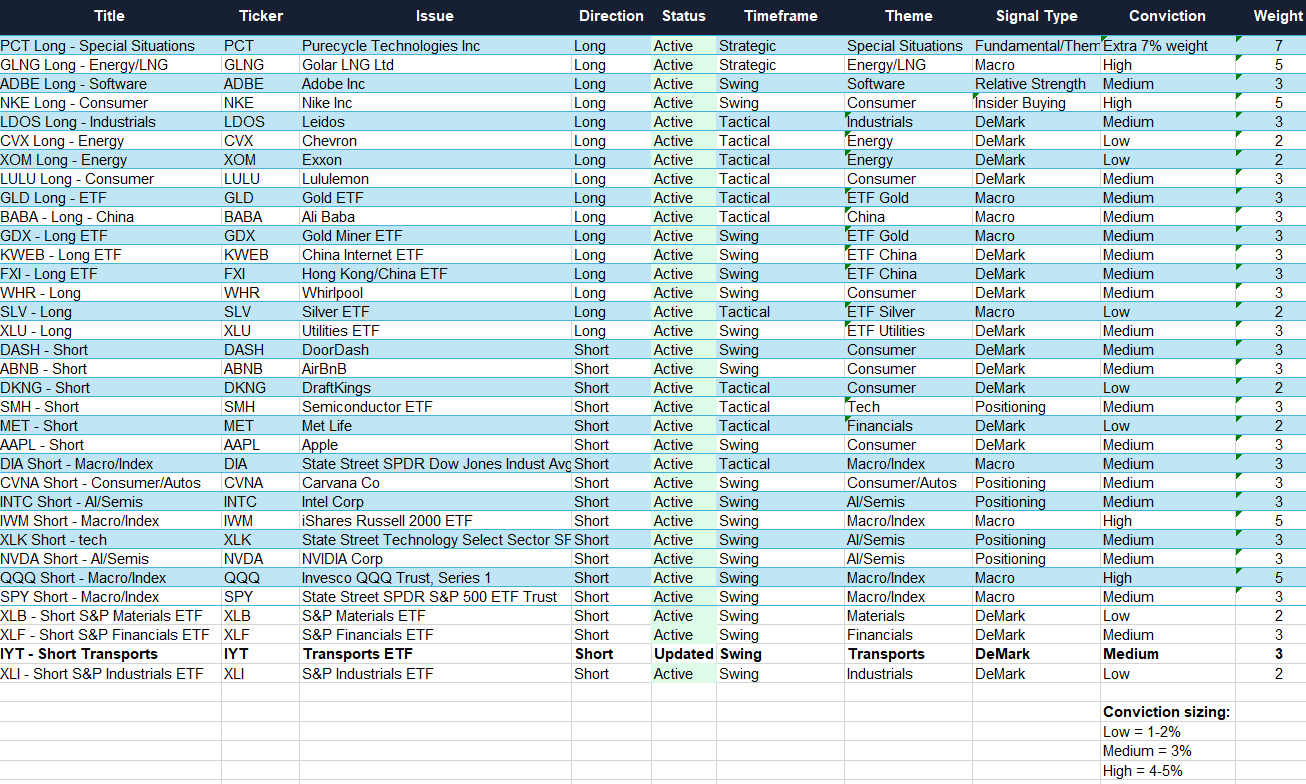
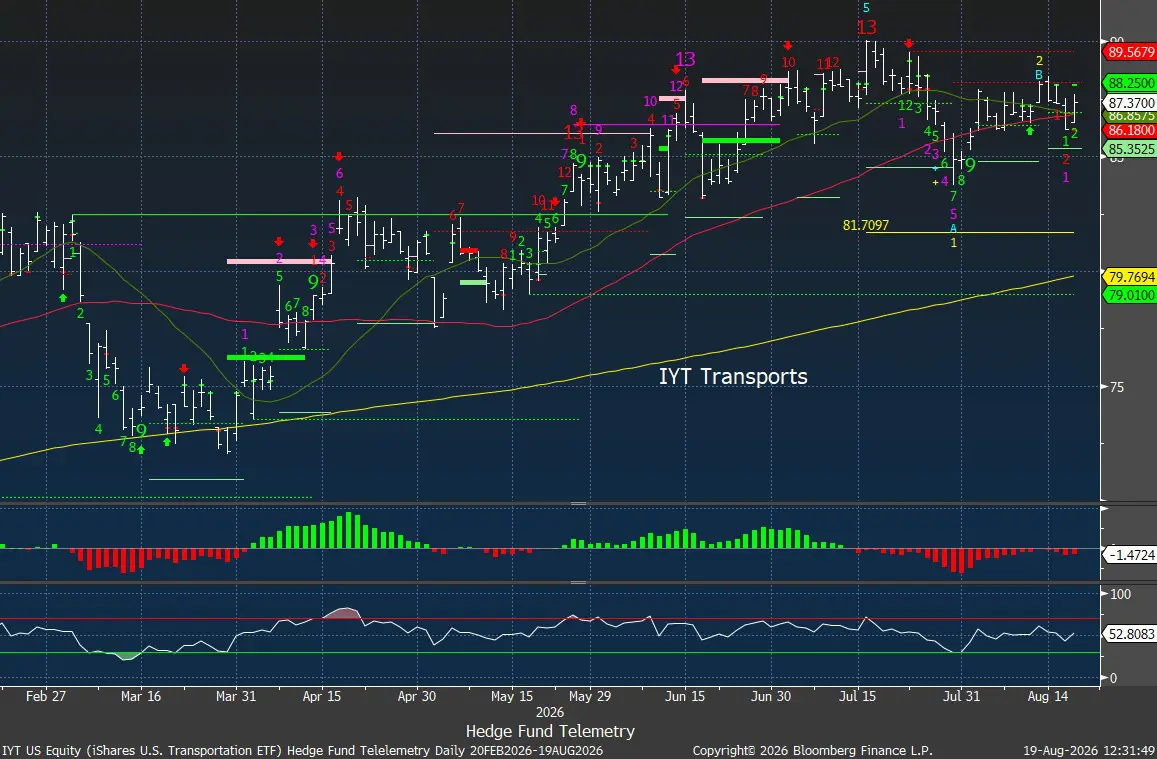
Changes: Just one small change. I will add to the IYT Transports ETF bringing short weight to 3% from 2%.
Thoughts: PCT is back over 7, and I have an August expiration 7 call I bought for 0.50. It’s trading at 0.35. I will sell it here for a small loss. It’s small, so it might work with 2 days to go if the market can keep it together.
US INDEXES
S&P Index 60-minute tactical time frame still at risk of lower, with a lower-high wave 2 of 5 and a pending downside Sequential.
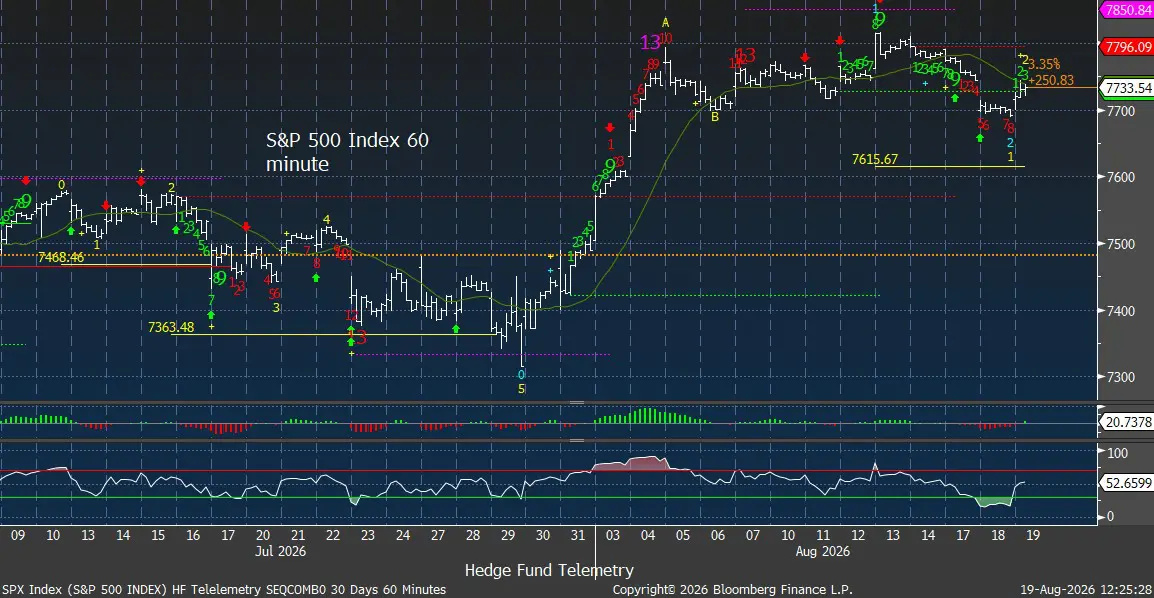
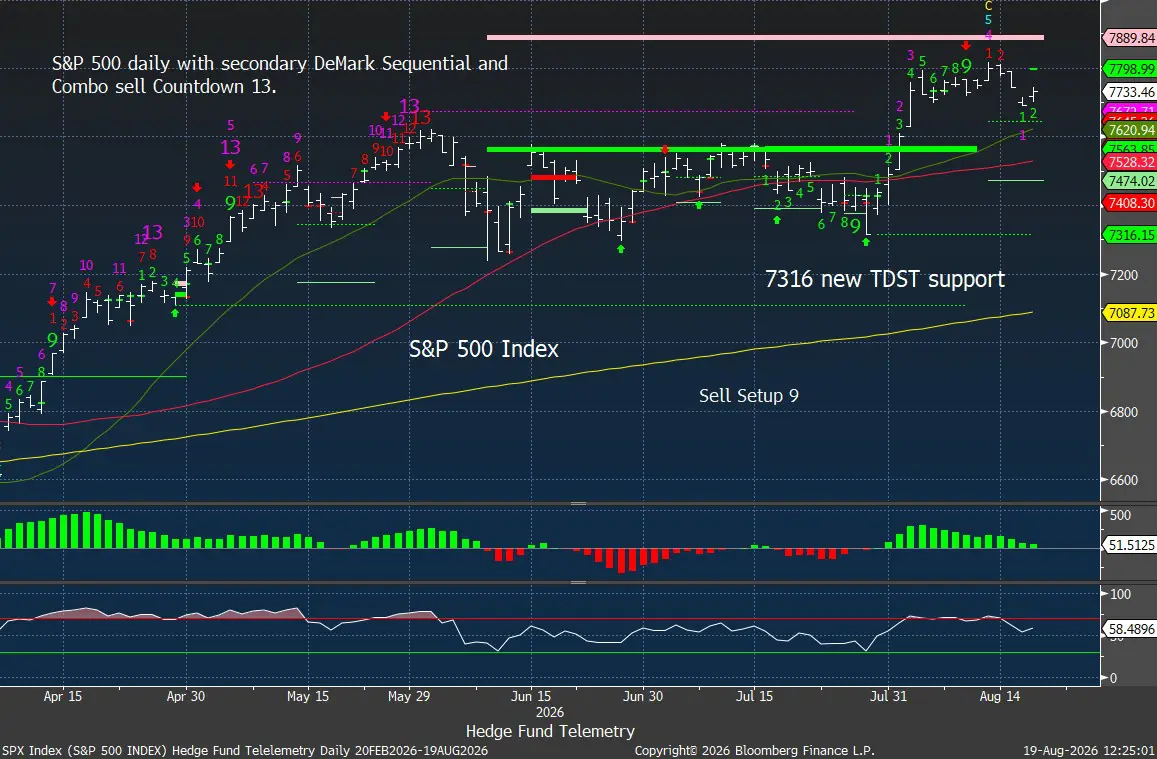
S&P 500 Index daily well above the 20-day and 50-day. Yesterday’s low is the key level to watch; if it breaks, it could signal a reversal.
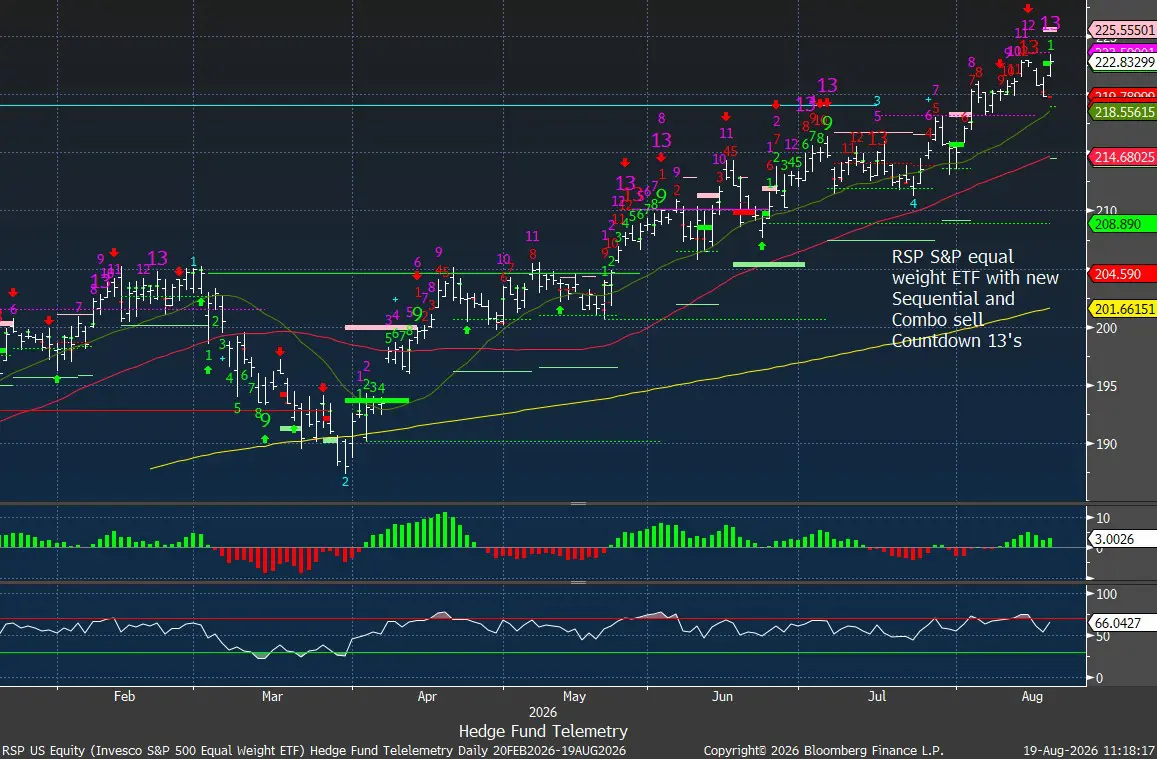
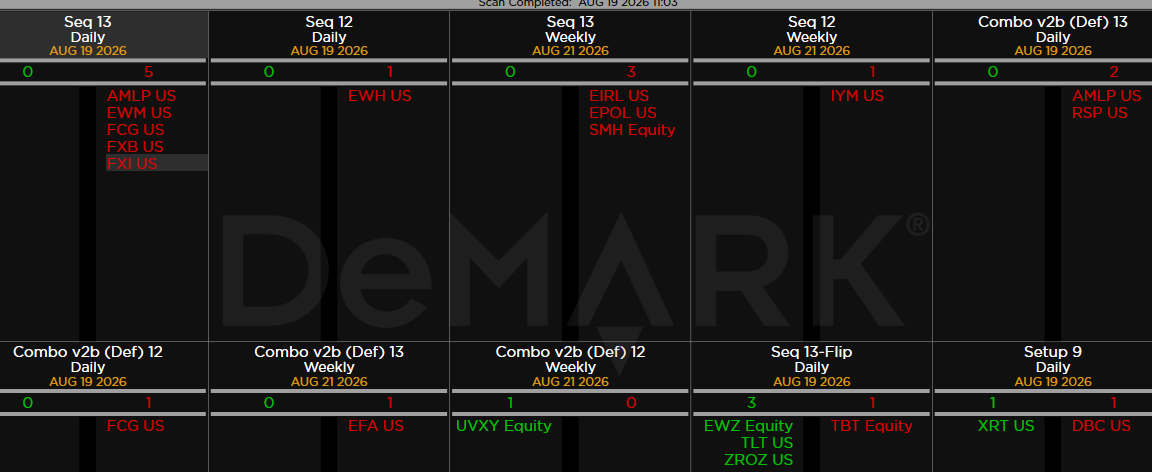
RSP S&P equal weight ETF with a new Combo sell Countdown 13. Other 13’s and 9’s saw moderate brief pausing and pullbacks.
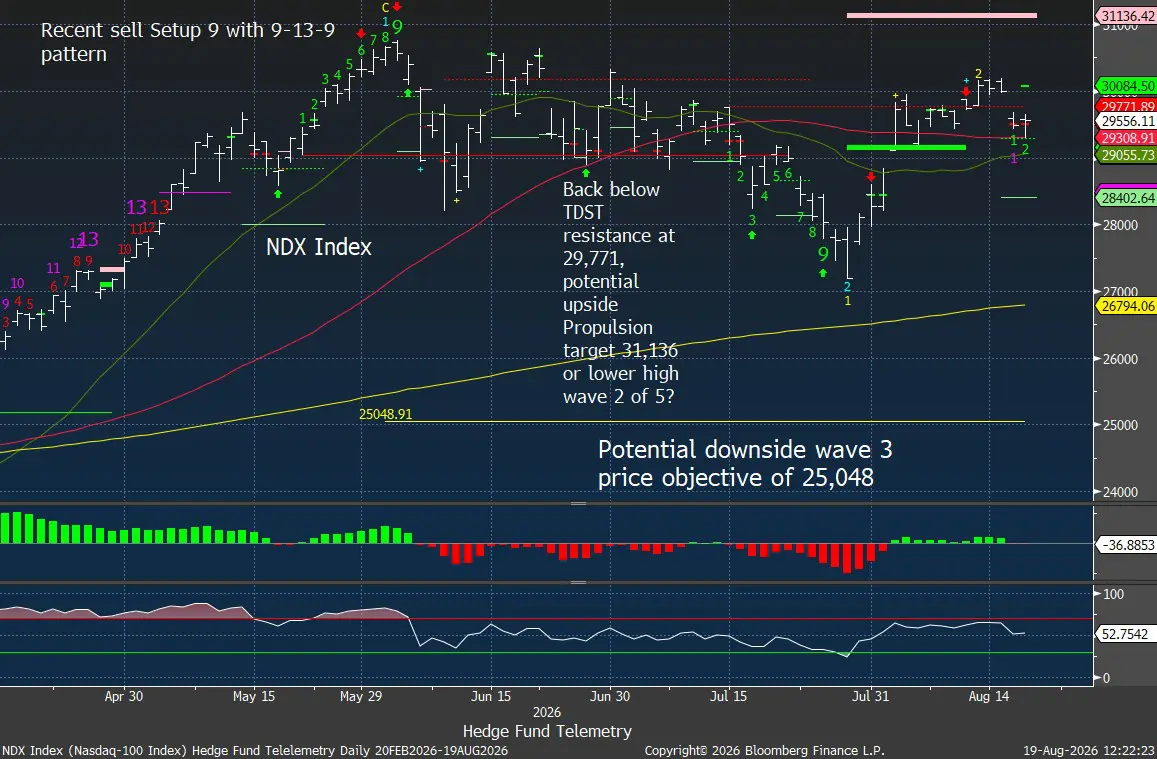
Nasdaq 100 Index daily holding the 50-day after yesterday’s gap down. I expect this to break lower
S&P heatmap
Nearly the opposite of what is working today and what isn’t working vs yesterday’s action.
US 30-Year Yield update
Recent Sequential and Combo 13s marked the top here. A similar pattern happened in May with a month-long pullback. If rates move higher after the Treasury move, it’s bring-your-helmet-to-work day.
Current Portfolio
Recently took some partial gains with XOM, CVX, BABA. Increasing IYT Transports short weight
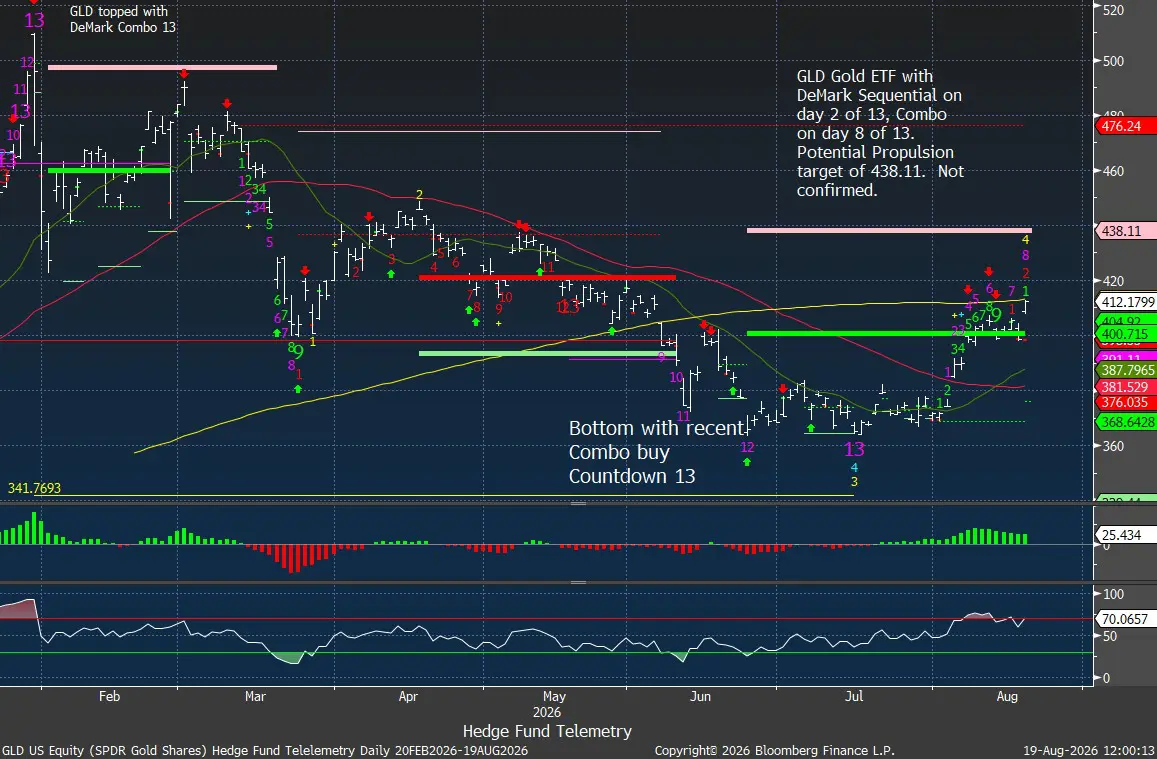
On a recent Big Picture note, I highlighted buying Gold. I figured the downside wasn’t done, and I set up a scale to buy it from 4400-4000, with the scale getting larger near 4000. Using a shotgun vs a sniper rifle worked. GLD had a nice Combo buy Countdown 13 at the low and sell signal at the top in late January.
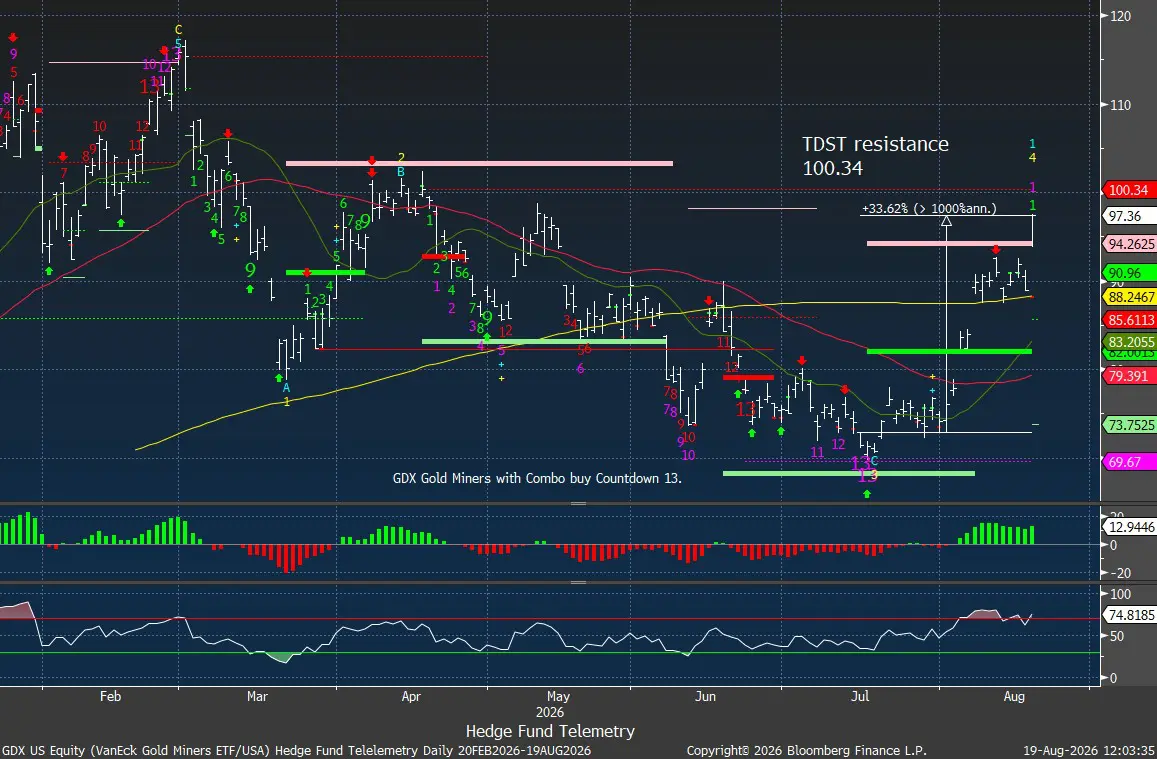
GDX Gold Miners has been a solid long and couldn’t be happier up 33%
IYT Transports looks toppy after the recent Sequential sell Countdown 13, with a possible lower-high wave 2 of 5. I will increase my short position to medium conviction (3% vs 2%) low conviction. Higher diesel costs can’t be helping them.
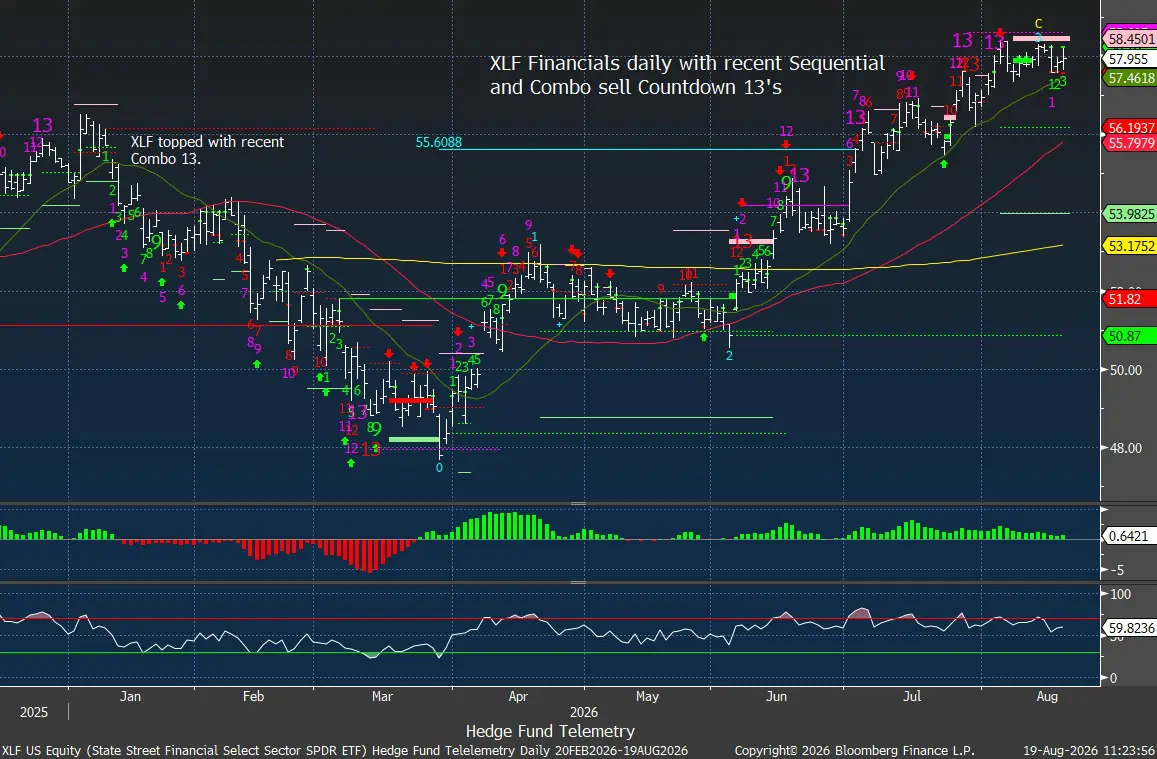
XLF Financials ETF with recent upside exhaustion sell Countdown 13s. Looking a little toppy, but the break of the 20-day at 57.46 needs to confirm a real turn lower. I continue to hold a medium conviction level short
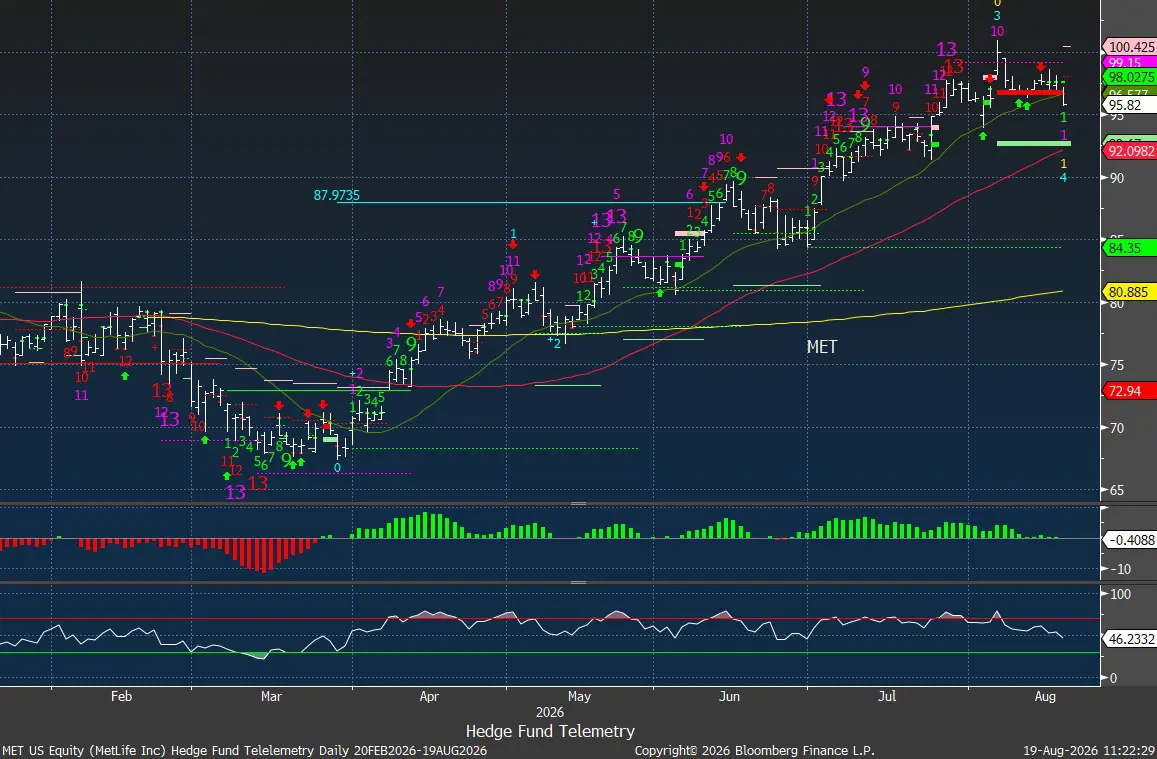
MET Metlife like other financials and insurance companies is stretched. I added a small short up here and will continue to hold for a low 90’s target.
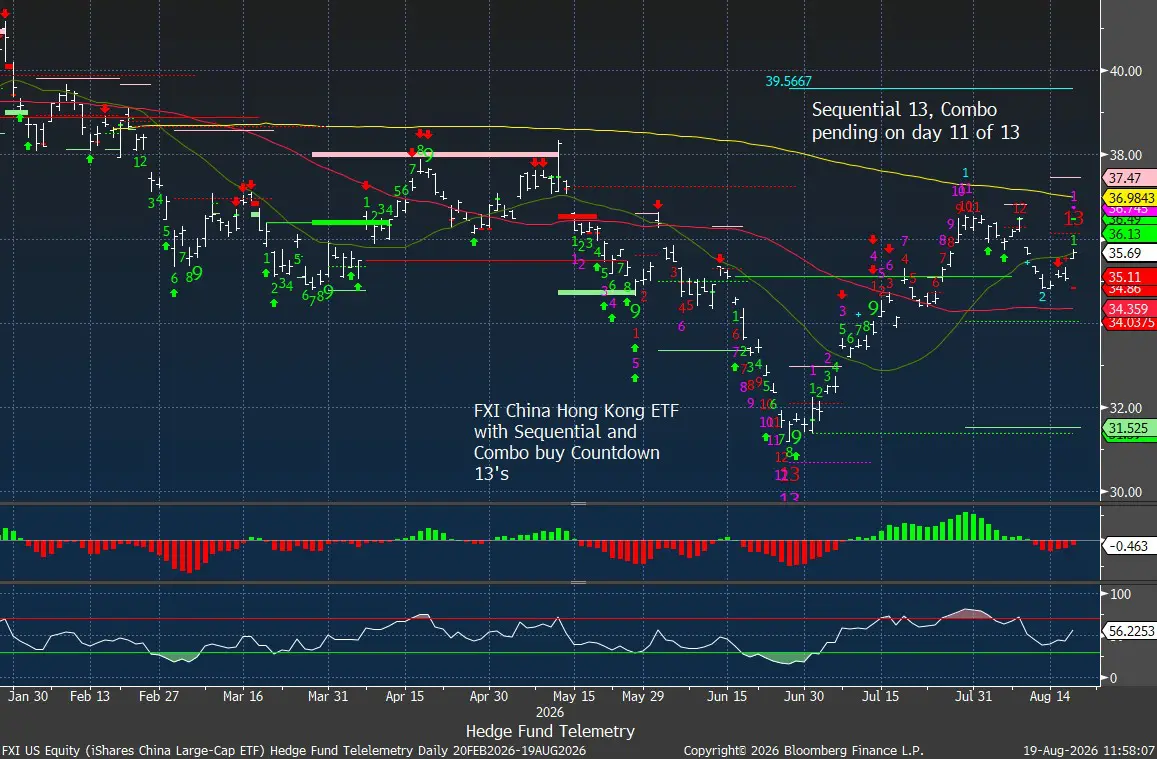
FXI China/Hong Kong ETF with new Sequential sell Countdown 13 (BABA had one yesterday). At the recent high I said I expected a pullback with a higher low wave 2 which we have now. I will continue to hold the current position as well KWEB and BABA at 3% weight each.
Bitcoin update
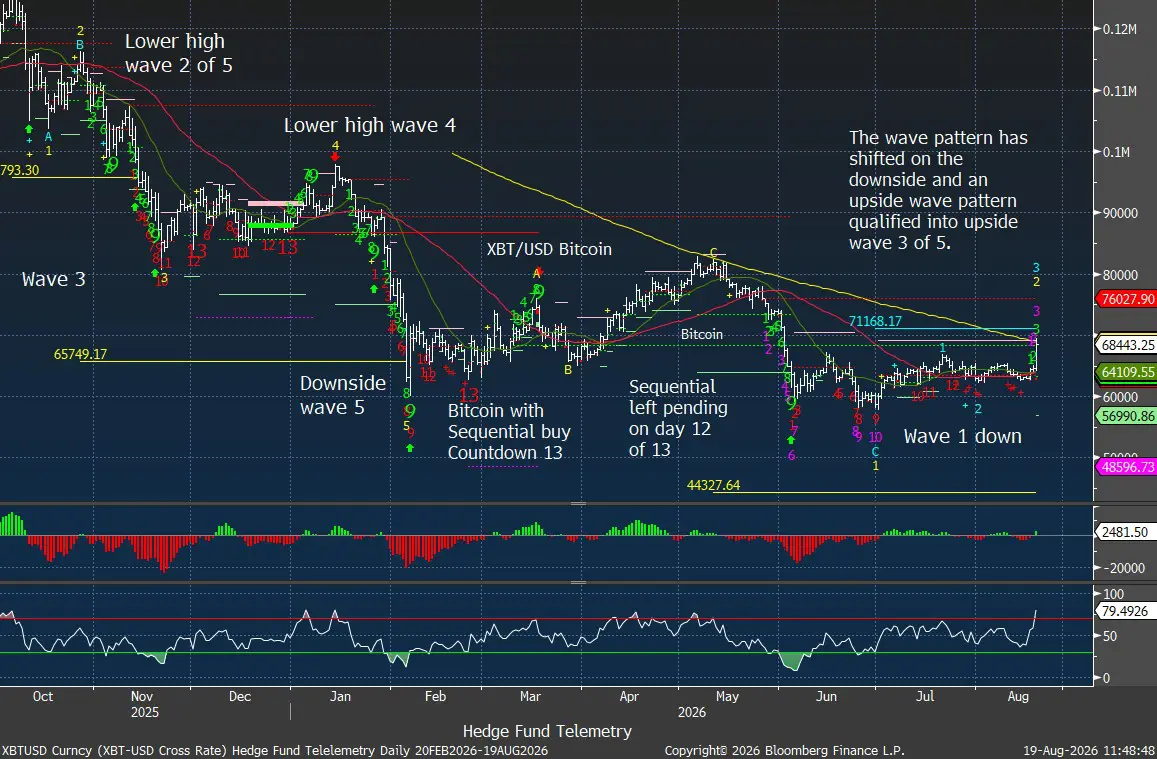
For all the Bitcoin fans with laser eyes, this might be the best day of the year.
Two days ago, I talked in detail about the potential upside and downside, and today’s upside has shifted the waves. On the upside with a move over the recent wave 1 (blue 1) it qualified into upside wave 3 with a potential price objective of 71,168. On the downside wave pattern (in yellow) the downside wave 1 remains but with a lift above the July high the wave 2 shifted the downside potential wave 3 price objective to 44,327 if the wave 1 closing low breaks.
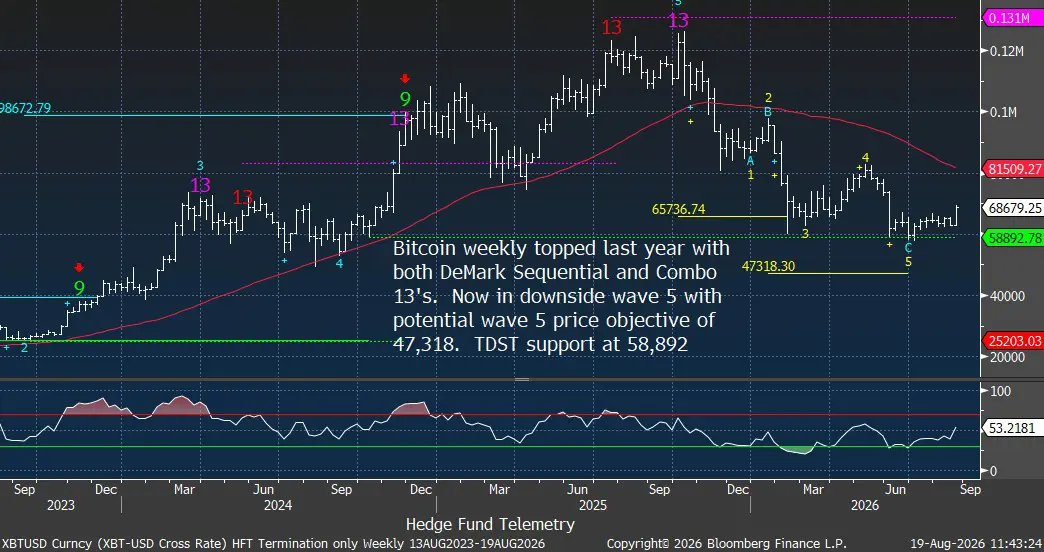
The weekly charts topped in 2025 and moved down in 5 waves after moving up in 5 waves. The TDST support held and that might be it for downside wave 5.
Important story on Big Tech AI spending
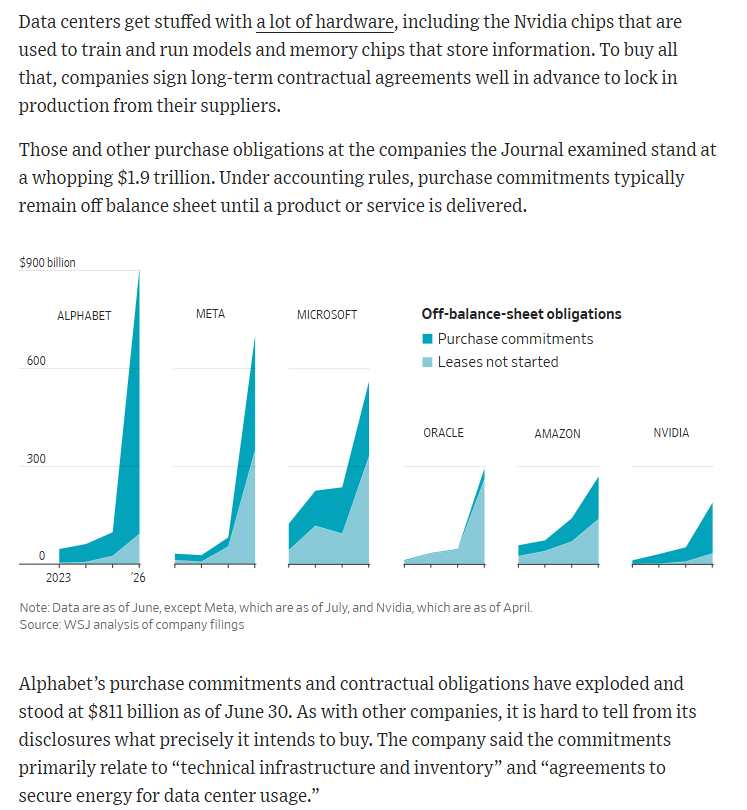
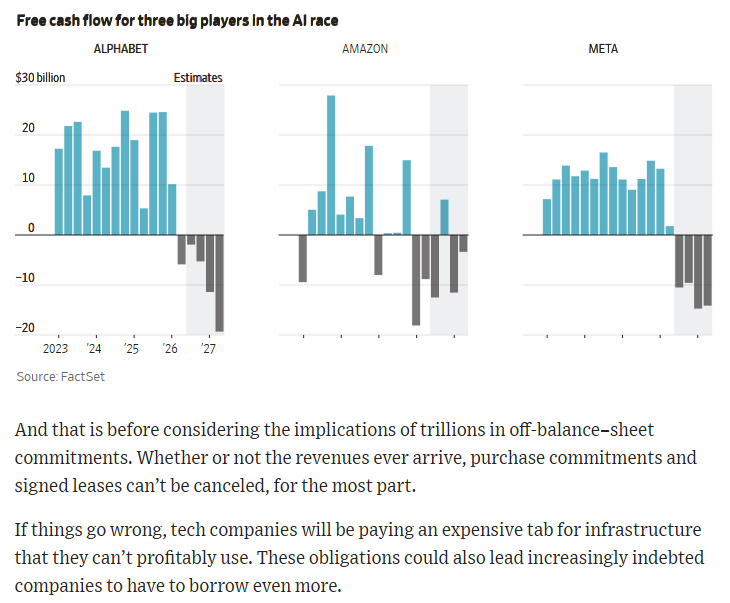
The WSJ published an important story a few days ago on why Big Tech’s AI spending is $3 trillion higher than it seems. There has been a lot of discussion on off-balance-sheet spending commitments. This story illustrates just how big it really is, and as I said above, everything has to go perfectly right for these AI companies. If they build it, the revenues better come.
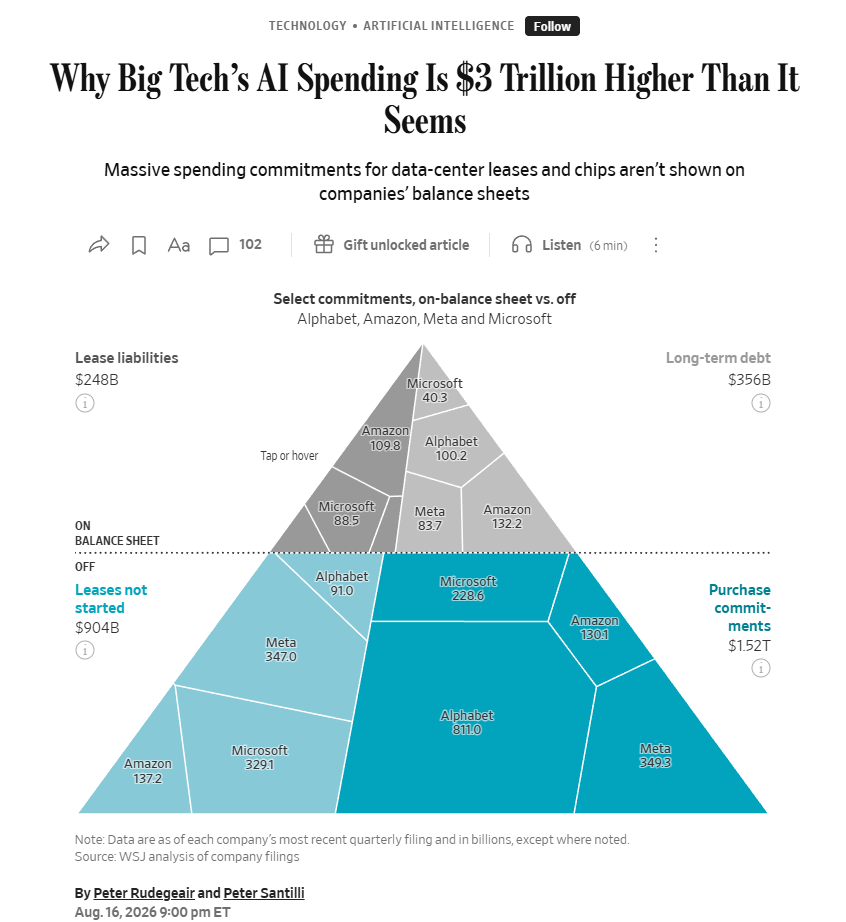
When I read this, I thought about how after the other off-balance-sheet collapses, they always identified the huge amounts after the blow-up, and here we know in advance what companies are doing with off-balance-sheet obligations.
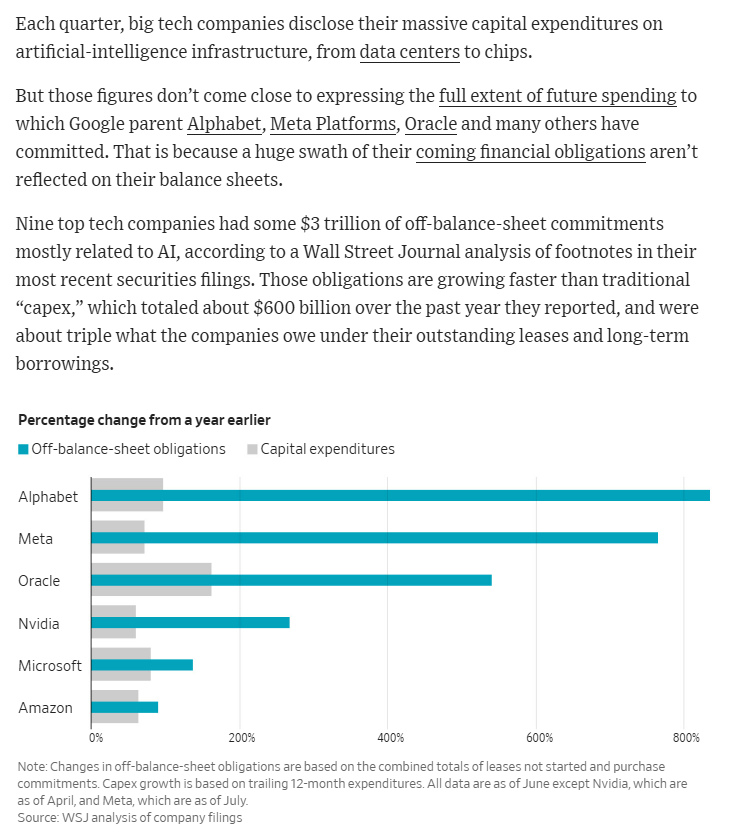
Commitments can be off-balance-sheet until a product or service is delivered. The least worst-case scenario is that some of these commitments get canceled or pushed out.
Capex has generally been funded with free cash flow, and capex levels have been much lower over the last 10+ years, which companies have used to buy back stock. I don’t see buybacks happening going forward, and that takes one of the strongest bull cases away. The next two paragraphs are a real concern if everything doesn’t go perfectly to plan.
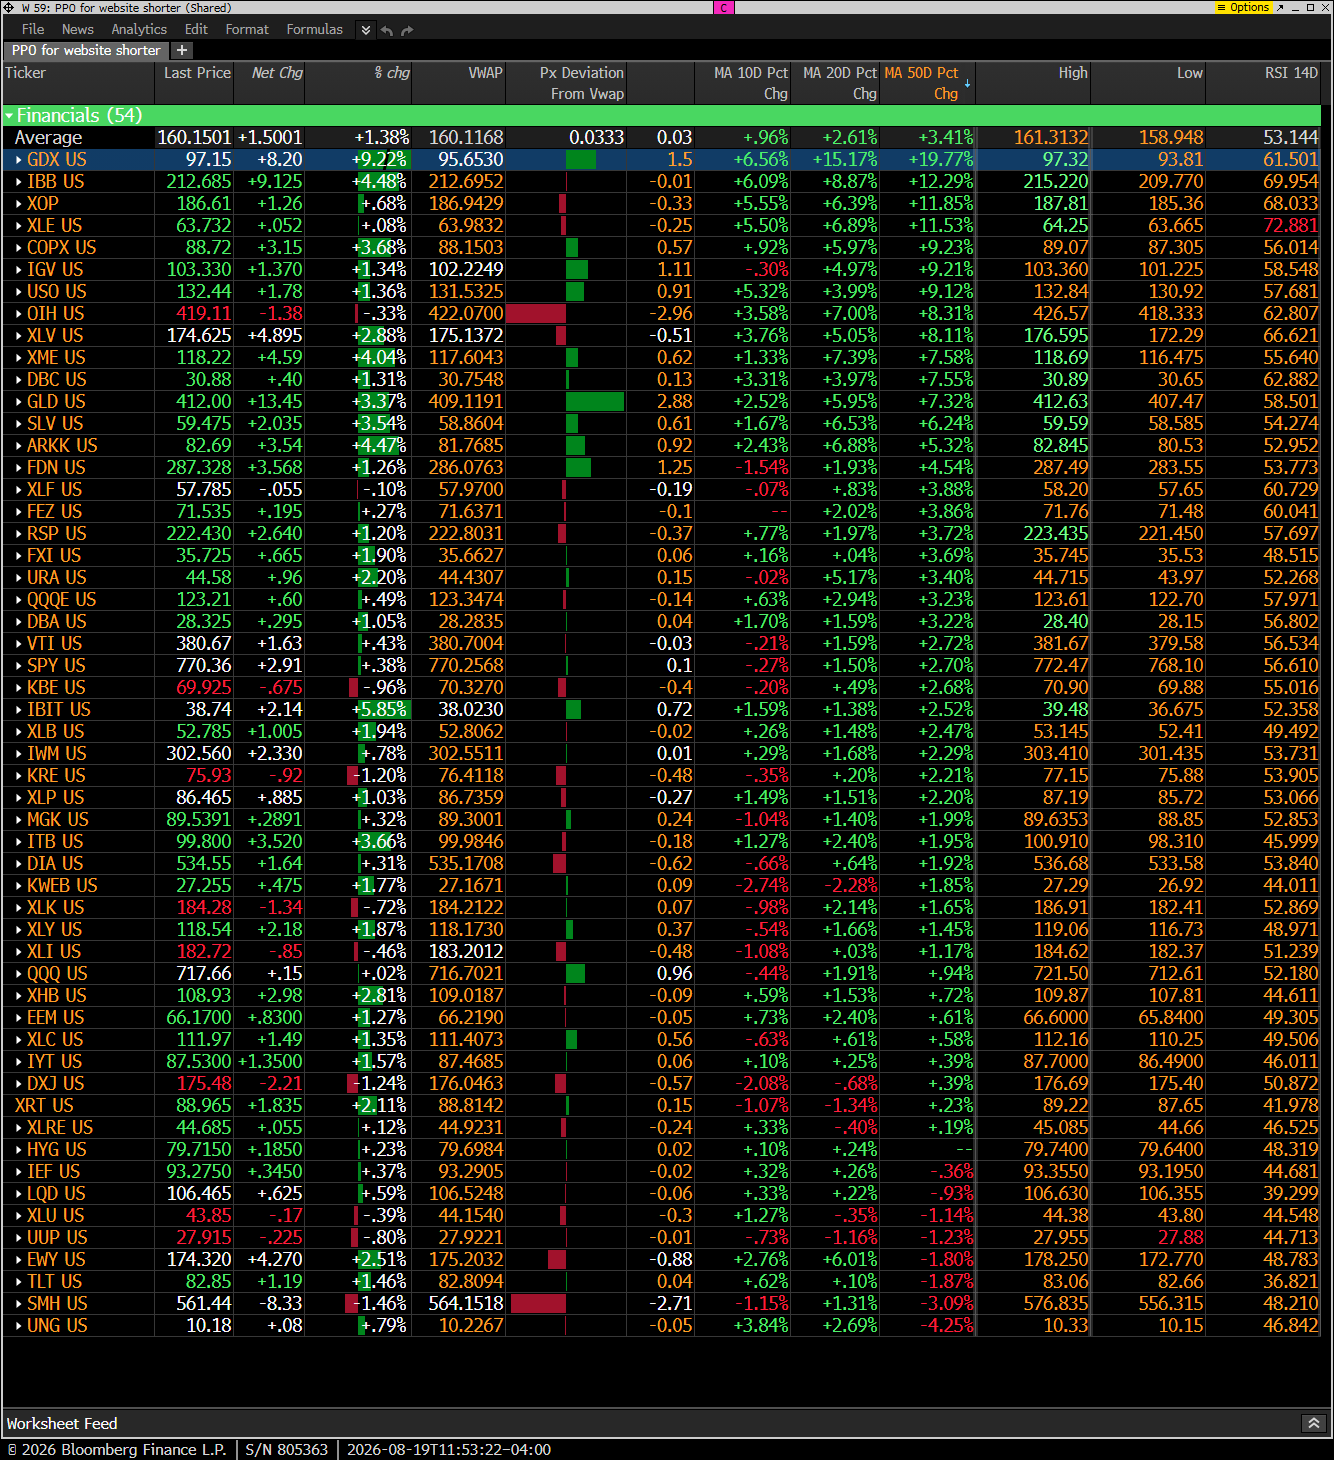
Hedge Fund Telemetry ETF Percentage Price Oscillator Monitor
The PPO monitor (percentage price oscillator) force ranks ETFs by percentage above/below the 50-day moving average. This monitor and others are offered to Hedge Fund Telemetry subscribers on Bloomberg. SMH is near the bottom of the monitor. GDX, up 9%, remains at the top, above the 50-day, by the greatest percentage.
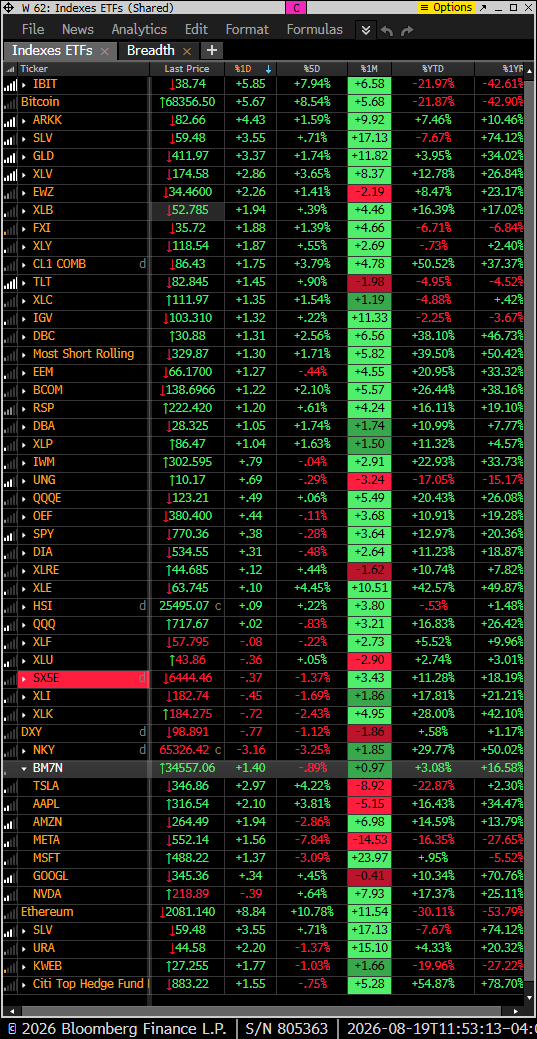
Index ETF and select factor performance
ETF with today’s performance with 5-day, 1-month, and 1-year rolling performance YTD. Bitcoin and metals very strong today
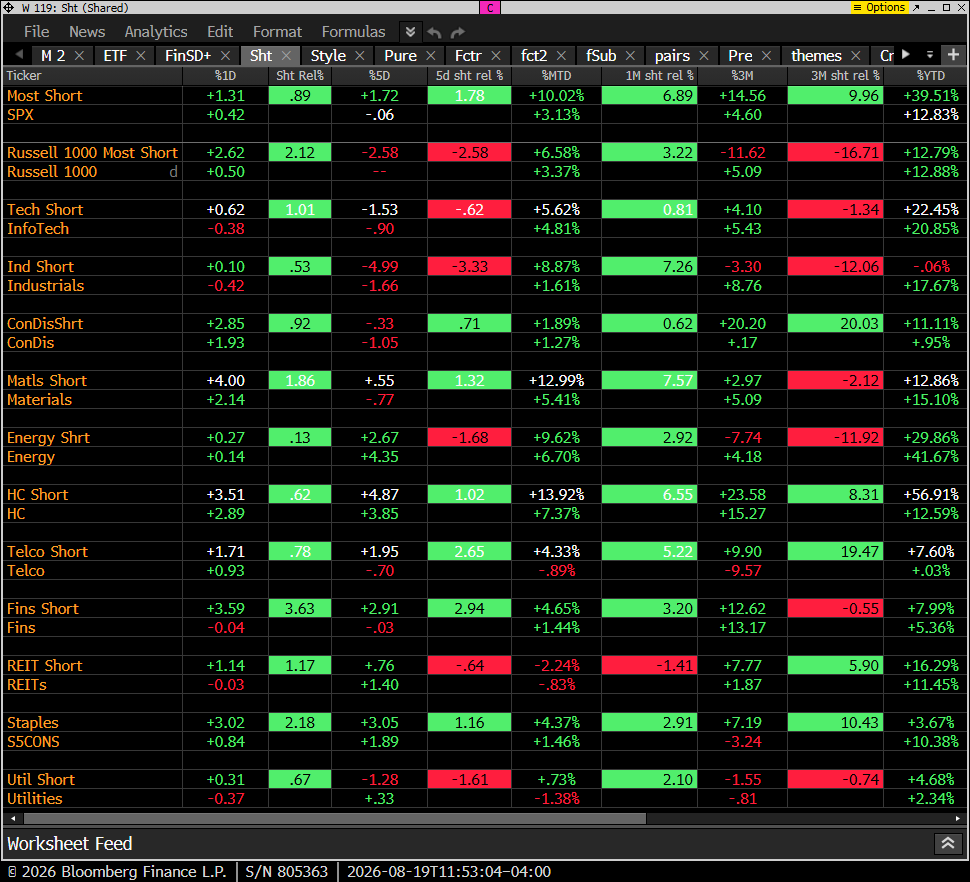
Goldman Sachs Most Shorted baskets vs. S&P Indexes
This monitor has the S&P indexes and the Goldman Sachs most shorted baskets.
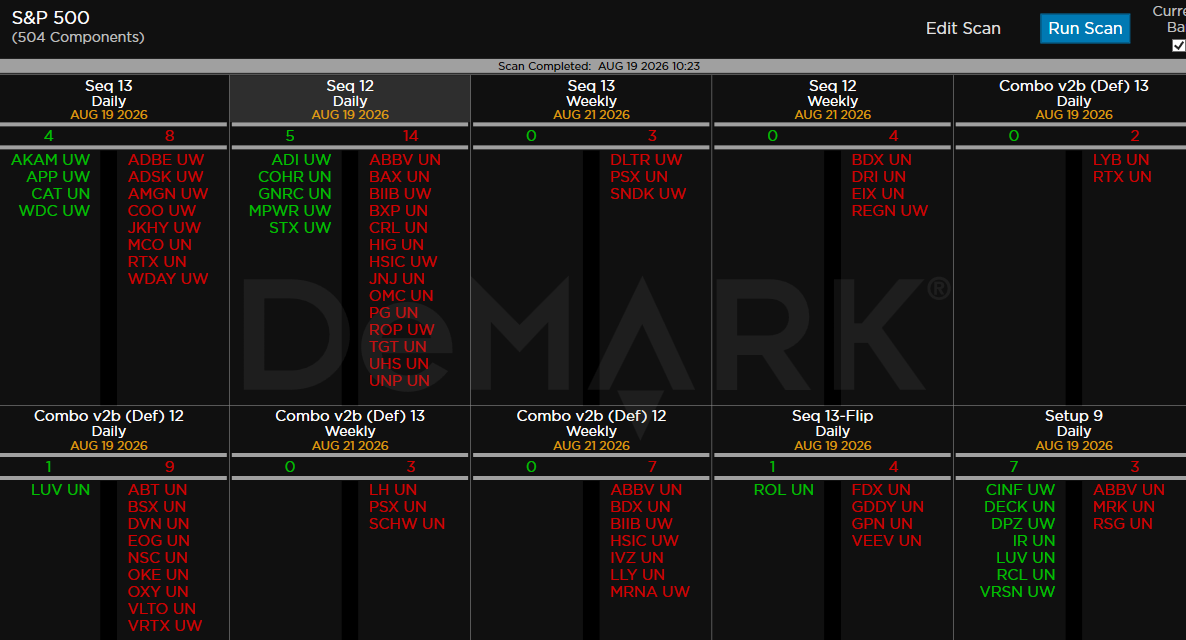
DeMark Observations
Within the S&P 500, the DeMark Sequential and Combo Countdown 13s and 12/13s on daily and weekly periods. Green = buy Setups/Countdowns, Red = sell Setups/Countdowns. Price flips are helpful to see reversals up (green) and down (red) for idea generation. The extra letters at the end of the symbols are just a Bloomberg thing. Worth noting: Seeing a decent number of new sell Countdown 13’s vs some interesting buy Countdown 13’s. The buy Countdown 13’s might have less upside as most are in downside wave 3 of 5 and bounces will be lower highs.
Major ETFs among a 160+ ETF universe.
If you have any questions or comments, please email us. Data sources: Bloomberg, DeMark Analytics, Goldman Sachs, Street Account, Vital Knowledge, Daily Sentiment Index, and Erlanger Research