
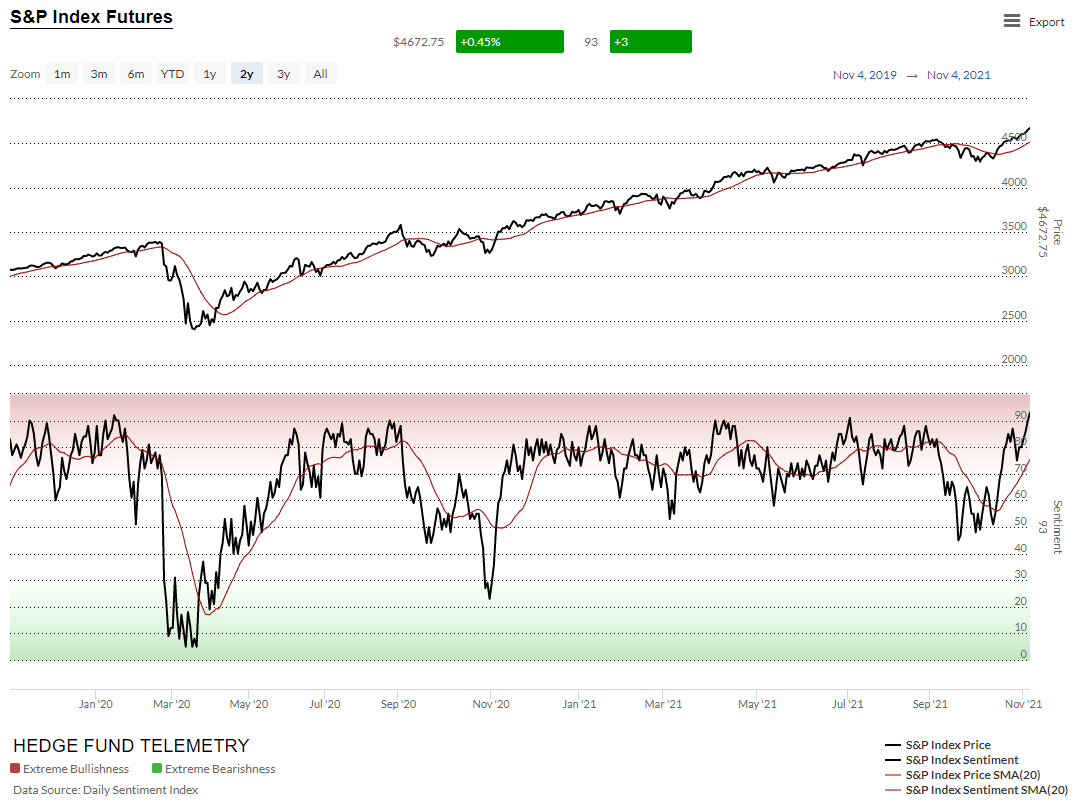
Yesterday the S&P and Nasdaq bullish sentiment hit 93% bulls with the Daily Sentiment Index data. This is rare to be over 90%. I’ve seen the readings higher ~96%. If I mention this on Twitter, besides the pushback I usually get a “so there’s some more to go.” Maybe. I have some historical charts of sentiment below.
Let’s review some things. The markets in the last few weeks have shot higher in a “blow-off top” fashion. RSI’s are very overbought on all the major indexes with some nearing 80. There are a lot of DeMark Combo 13’s which trigger signifying the end of a strong move or at least the momentum off the initial low. However, the same charts also have the Sequential indicator still in progress getting later in the Countdown towards 13. The Combo has to trigger at a high for the move and the Sequential doesn’t have to trigger at a high but it might or trigger somewhere sideways from here. And I should mention, we’re seeing both daily and weekly time frames with these signals developing. Every index is also in the final upside wave 5.
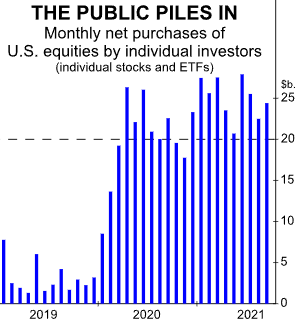
As a reminder of the personality of what occurs during wave 5: Wave five is the final leg in the direction of the dominant trend CHECK. The news is almost universally positive CHECK and everyone is bullish CHECK. Unfortunately, this is when many average investors finally buy in CHECK, right before the top. Volume is often lower in wave five than in wave three CHECK, and many momentum indicators start to show divergences (prices reach a new high but the indicators do not reach a new peak) NOT YET. At the end of a major bull market, bears may very well be ridiculed. CHECK. If you don’t believe go on Twitter and tell people you’re bearish. Investors have clearly bought into the markets as shown from this chart from Elliott Wave International.
As a note, all of the sentiment charts can be accessed on the website and one can adjust the time periods including setting exact dates. Here’s the current sentiment chart of the S&P. This 93% reading is the highest since January 2020. There have been other times where it hit 90% resulting in a short-lived stalling out and nominal pullback. The midpoint ~50% level held which was a make or break level.
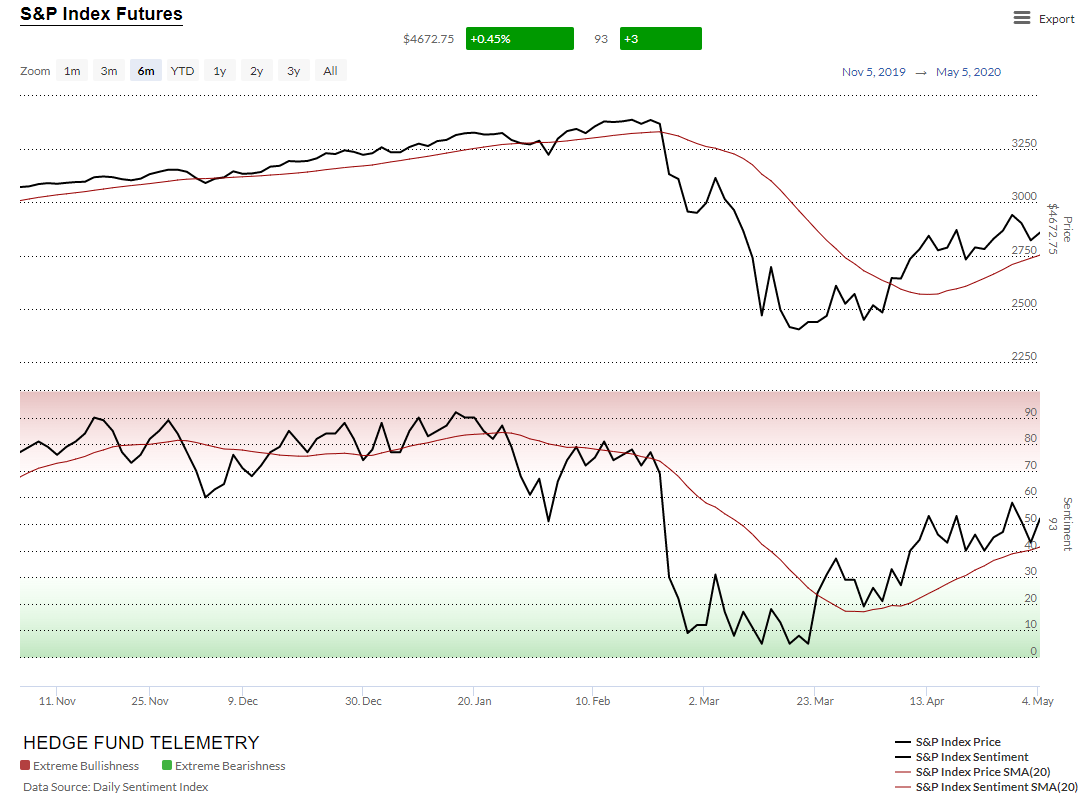
This is late 2019 into January 2020 with sentiment peaking in January and making a lower high divergence in February right before Covid took down the market. In December and January, there were also multiple DeMark exhaustion signals for a month.
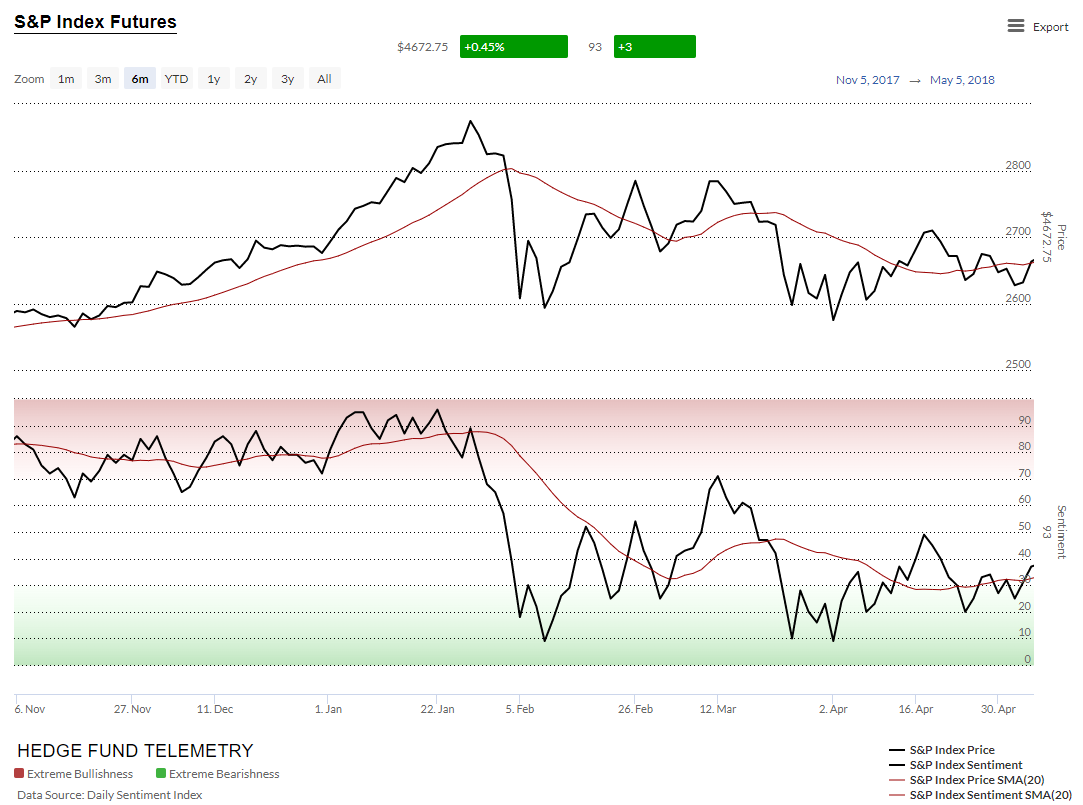
This is late 2017 into January 2018 when the market was also in blowoff top mode. Bitcoin had a huge run that peaked in December and people were excited about the Trump tax cuts. There wasn’t a true catalyst to start the move lower although a lot of volatility hedges blew up as a result of the quick move lower. In December and January, there were also multiple DeMark exhaustion signals for a month.
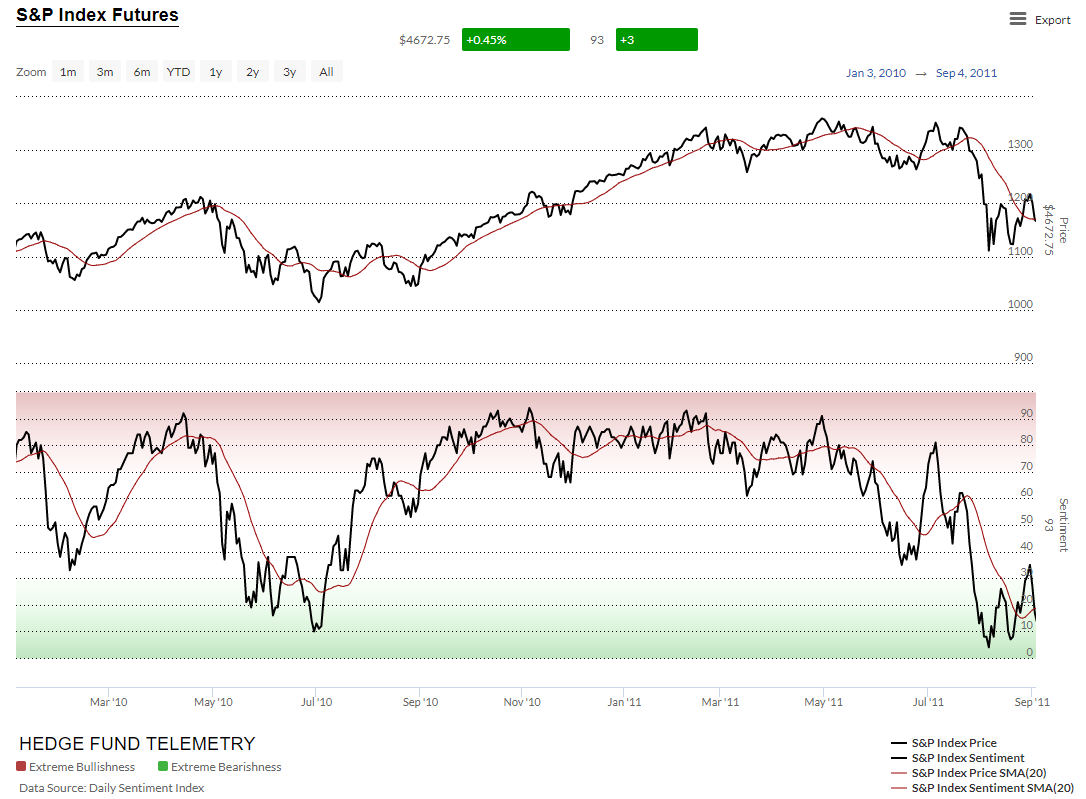
This is early 2010 through summer of 2011. This was a period after a big move higher after the great financial crisis and there were multiple times when the markets corrected more than 5% and sometimes more than 15% after reaching S&P bulls over 90%
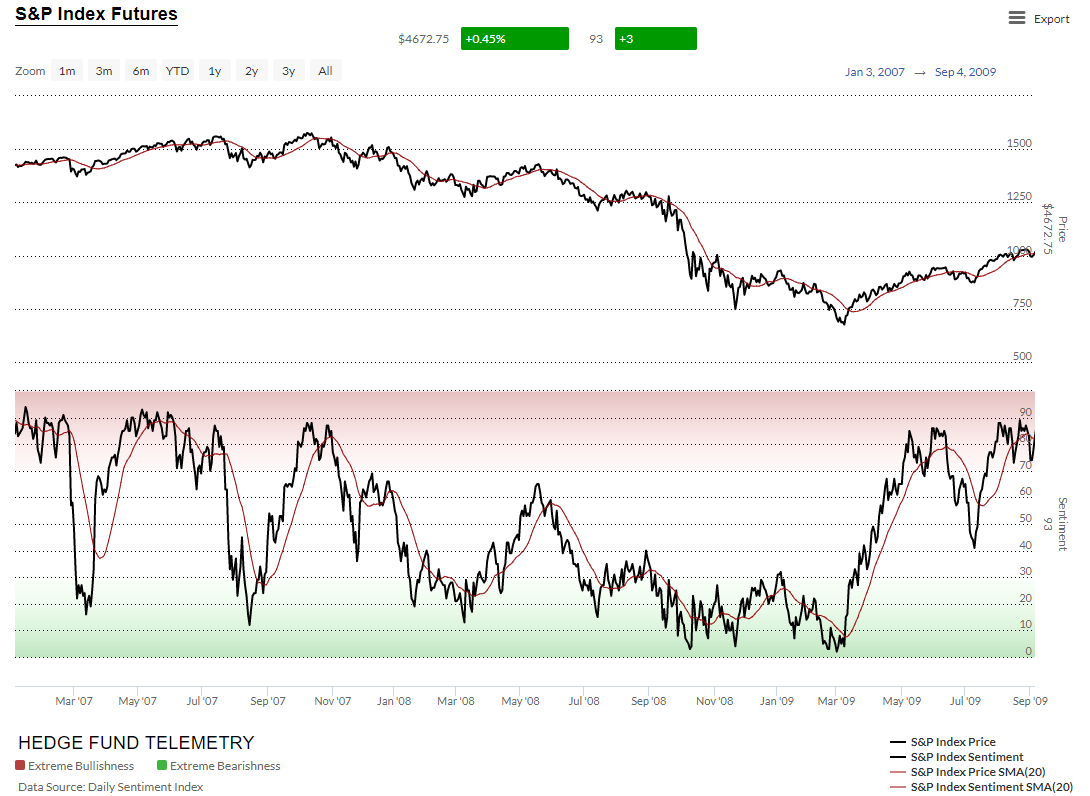
This is from 2007 through 2009. In 2007 sentiment made a few wire to wire extreme moves giving a little preview of what was to come. When the market did go down sentiment made lower highs and stay low until reaching 4% bulls in March 2009.
No new trade ideas today. Several shorts are starting to stall or decline: BBY, TGT, HD, ARKK, NFLX, JBHT, AFRM. And now today’s VWAP levels broke to the downside on SPY and QQQ (and other ETF’s and stocks)