Today’s CPI was hot showing inflation increasing month over month and at a 7.5% year over year basis. A lot of people have been believing the number would actually come in lower and inflation has peaked. There’s been a lot of people saying Fed rate hikes, higher rates, equity markets pullback was priced in. I wrote about it this week. I don’t blame them because one of the hallmarks of the last few years has been shallow and short-lived market pullbacks. Go on CNBC each day and put the string “I like buying ____ as this is a strong opportunity.” Tomorrow it’s a new stock with no accountability.
The markets have been very forgiving dismissing some serious risks to the markets such as the end of QE, Fed funds rate hikes, higher rates, spreads widening, curves inverting, and the highest inflation in 40 years. The last part inflation is the hardest to put the genie back into the bottle. The Fed has a mandate from President Biden to get this runaway inflation under control (ahead of the midterms was Biden winking at Powell when he got renominated). I was on Bloomberg chatting with my friend Julian Brigden asking him about the CPI. For some background, he’s always been very tight with some people who are a phone call away from Fed people. He’s British so read this in a sharp British accent.
Really tough mate…base effects should be kicking in Tom. But irrespective of that the core is still a HUGE problem. Equities smoking crack if they think a drop from 7.5 to 6% makes ANY difference to Fed. Outside a massive slowdown in growth, which wouldn’t be good for stocks, they are at the beginning of a massive multi-year tightening and balance sheet run-off. Therefore tactical considerations aside this is now a market to sell rallies not buy dips. Fed has to tighten financial conditions by at least 2.5%. That HAS to include lower stocks.
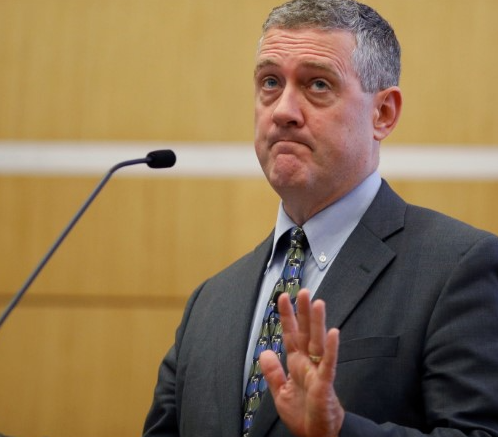
St. Louis Fed Governor Jim Bullard around lunchtime today spoke with someone at Bloomberg and the markets didn’t take these comments well when they hit the tape.
FED’S BULLARD FAVORS 100 BPS INTEREST-RATE INCREASES BY JULY 1
*BULLARD DEFERS TO POWELL ON POTENTIAL FOR 50-BPS MARCH INCREASE
*BULLARD FAVORS FIRST HALF-POINT U.S. RATE INCREASE SINCE 2000
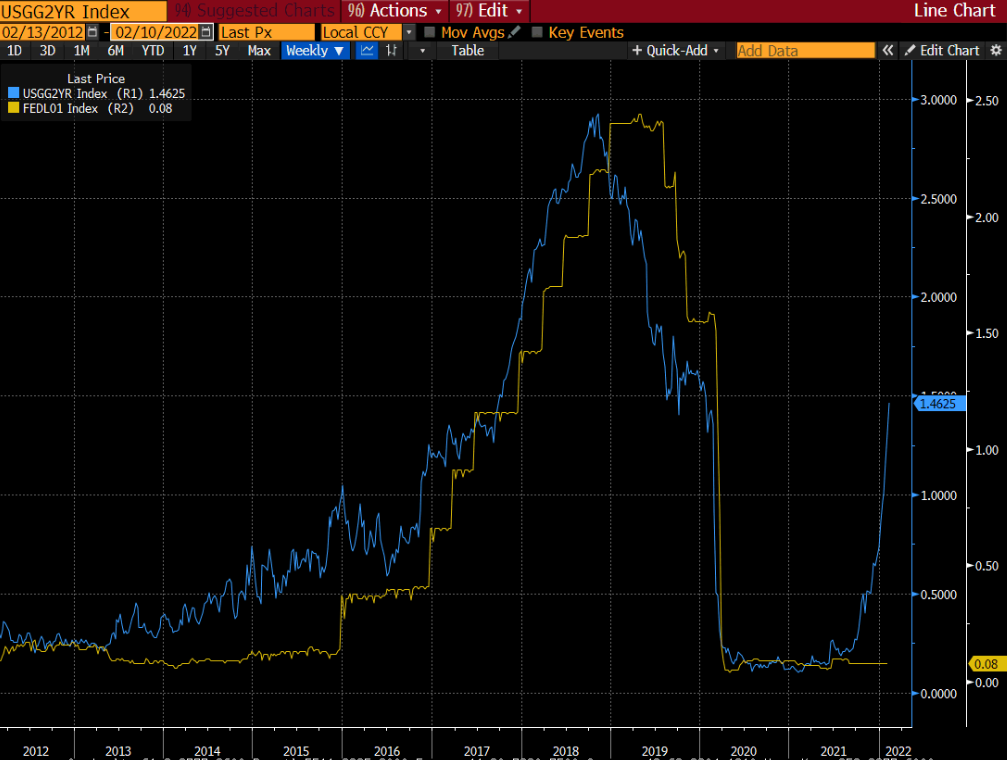
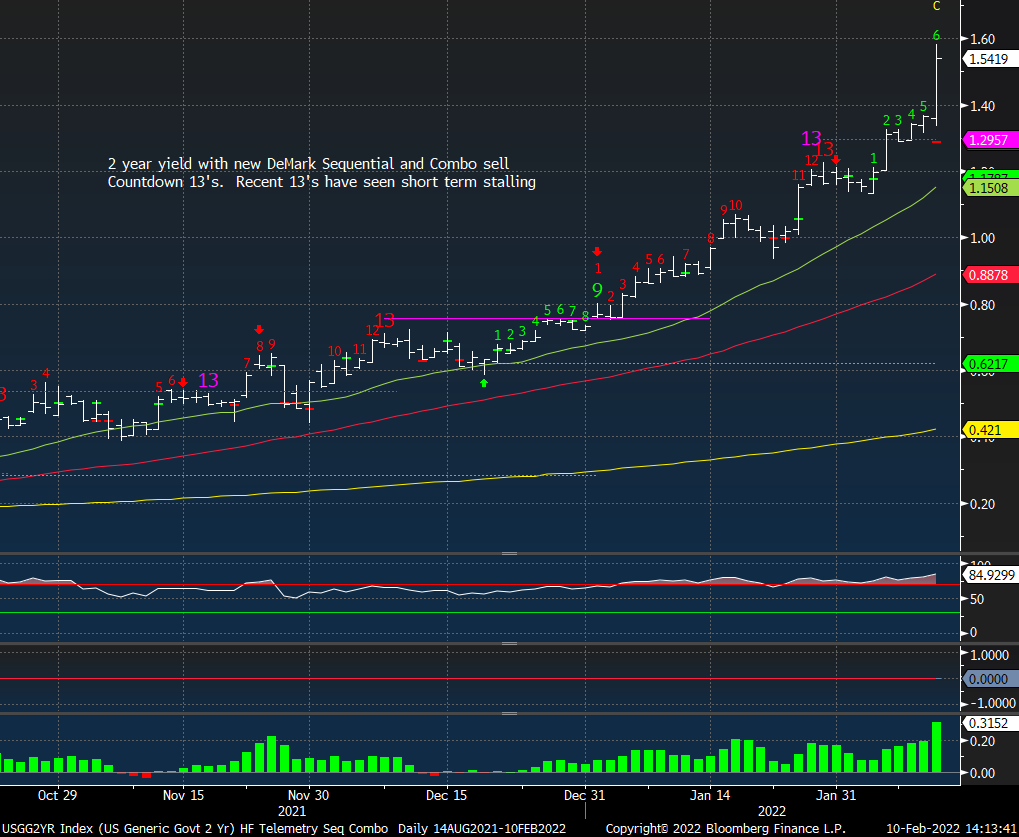
I’ve been saying a 50 bps hike in March after two hot CPI reports will become consensus and now the odds for a March 50 bps hike is at 75% after Bullard’s comments. The Fed has a tough job ahead and as we know they created a market bubble combined with spiking inflation to a 40 year high. They are behind the curve and they know it. Inflation was not transitory, at least in the time frame they believed. Now they are panicking. I could see something like an intra meeting halt to QE or even a hike. Slim odds. Here’s how far behind the curve the Fed is vs the 2 year yield.
The market is fragile like a china shop and it’s time for a reality check. Be very careful out there as the Fed put is a lot lower.
I’m on the Real Vision Daily Briefing at 4 pm ET today and you watch live on YouTube. Let’s see if Tony Greer will ping me on Bloomberg during the show to get back for me doing it to him the other day when he was live.
TRADE IDEAS
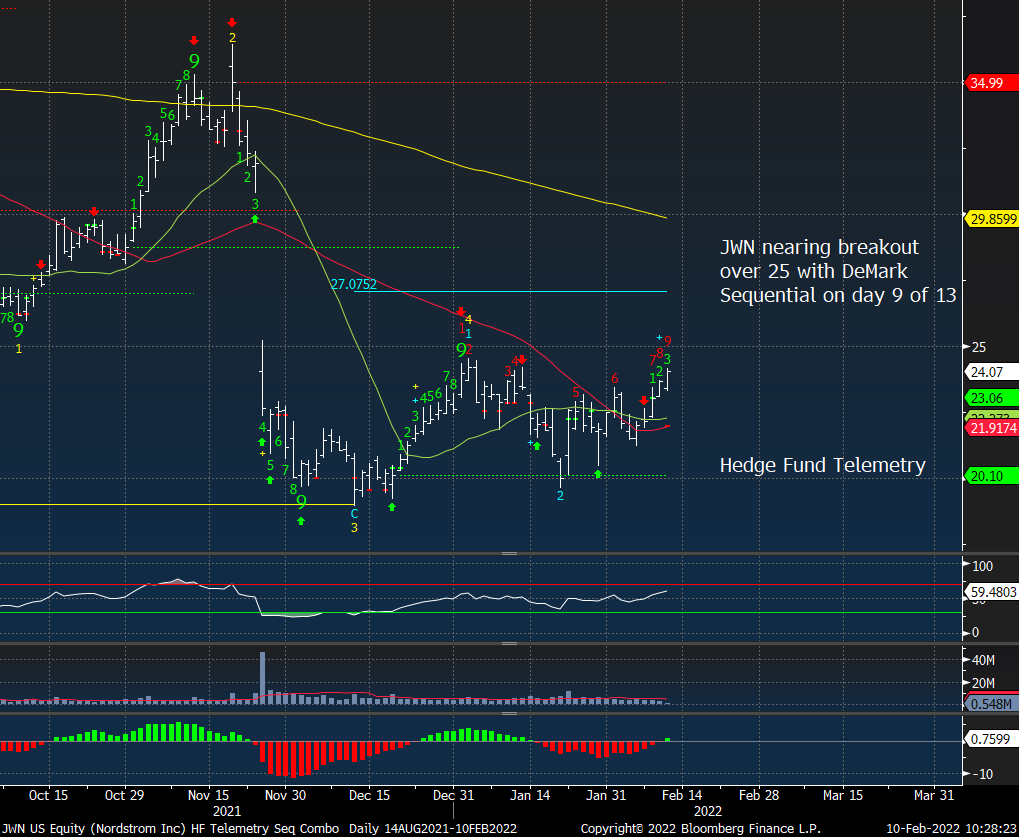
There have been some positive developments with the Cannabis legislation with the SAFE banking act getting more support with increased urgency to pass it… soon. It’s not if but when. I’m sticking with all of my longs in the sector as I see it and have talked about it being a 2022 theme. I have been long TBT the inverse 20+ bond ETF. It’s up 8.7% and I’m taking profits today. I see a lot of upside exhaustion signals on daily charts with some bonds and with sentiment getting depressed I wouldn’t be surprised with rates dropping and that might also be a risk-off shift due to equities falling. I added TGT and ORCL with starter-sized 2% positions. I was going to add JWN today with a similar 2% long position but I’m holding off. Metals have been showing some improvement as is Uranium. I have some charts and comments below. I’m sticking with my short positions and put spreads. You can short SPY, QQQ, and IWM if you are not yet. Raise stops on your longs.
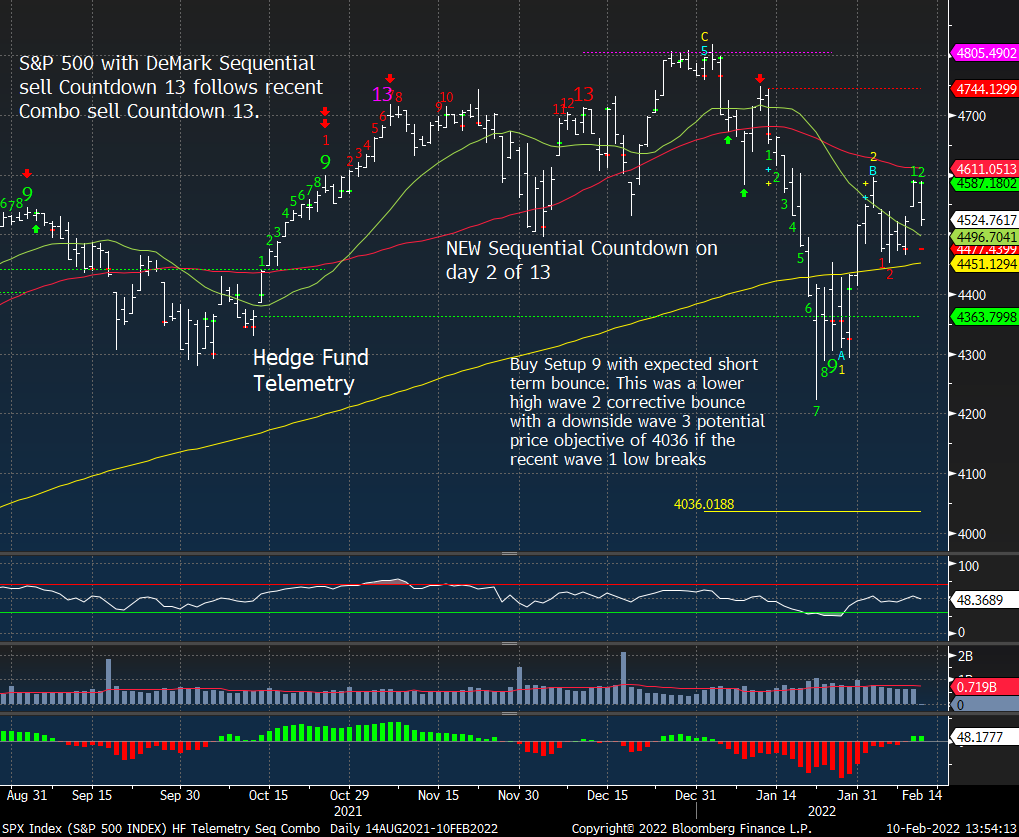
This could be it for the corrective wave 2 bounce and lower lows are possible. Let’s not get ahead of ourselves and see how tomorrow trades.
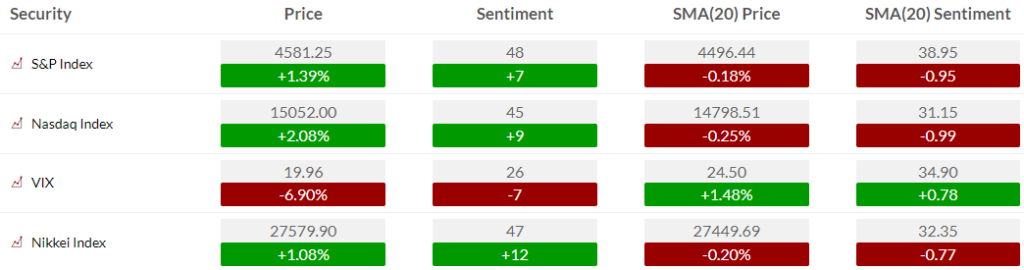
US MARKET SENTIMENT
Here is a primer on how we use Daily Sentiment Index charts. S&P bullish sentiment and Nasdaq bullish sentiment has lifted right to the 50% majority line and we should expect a decent drop today
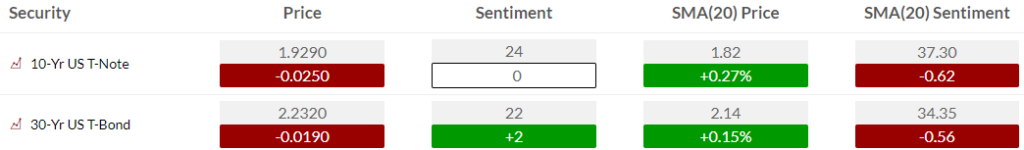
Bond bullish sentiment is low and will get an even lower reading later today
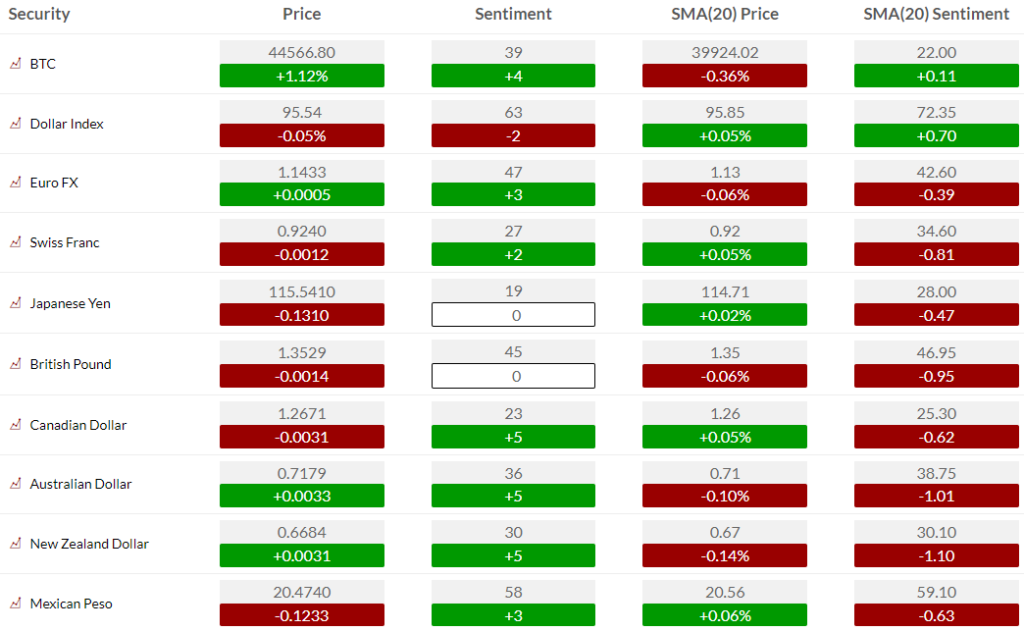
Currency bullish sentiment
Commodity bullish sentiment has several markets over the extreme zone >80%
US MARKETS
Here is a primer on the basics of the DeMark Setup and Sequential indicators.
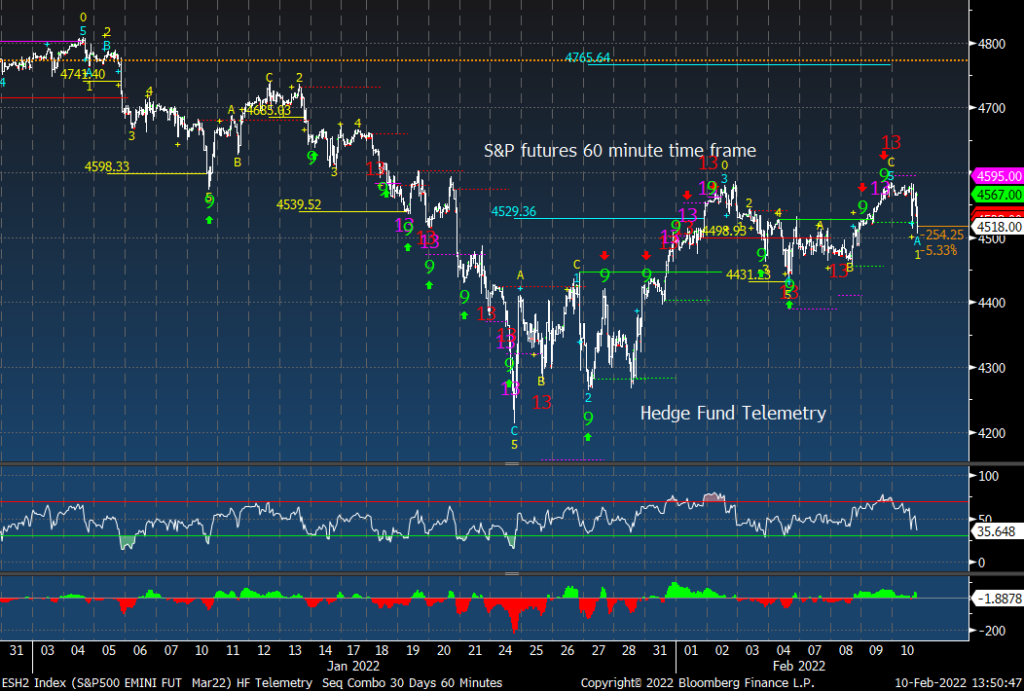
S&P futures 60 minute as discussed on First Call. Exhaustion sell Countdown 13’s in play
S&P 500 daily fading hard today after inexplicably bouncing after the CPI
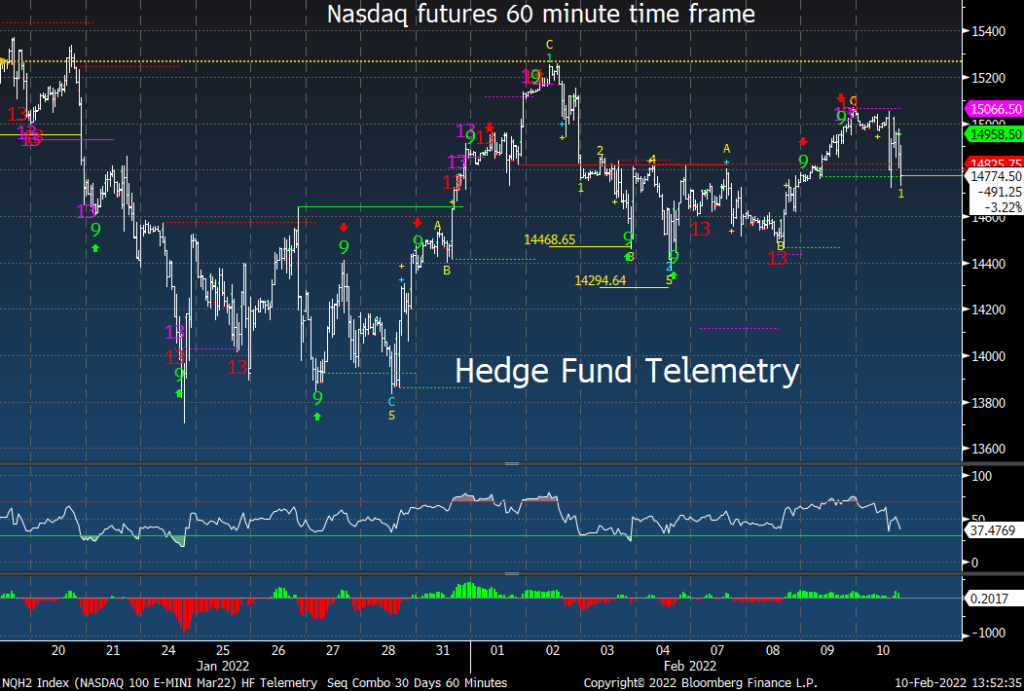
The Nasdaq 100 futures 60 minute as discussed on First Call. Exhaustion sell Countdown 13’s in play
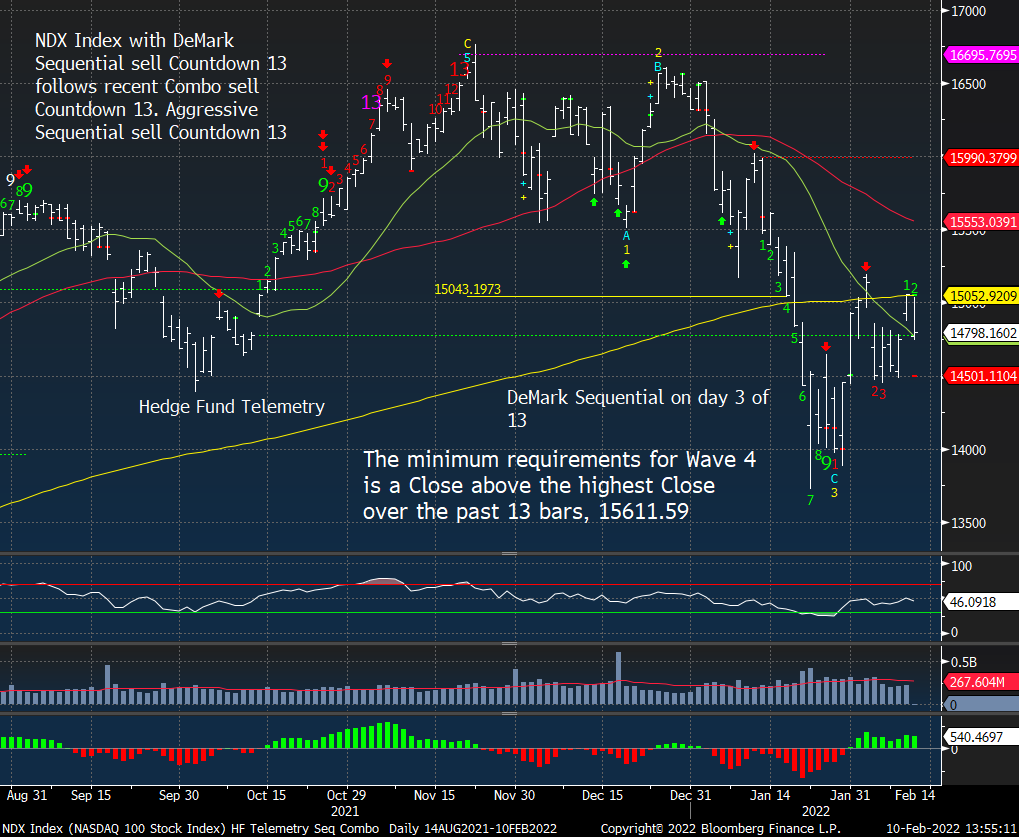
NDX index fading hard today
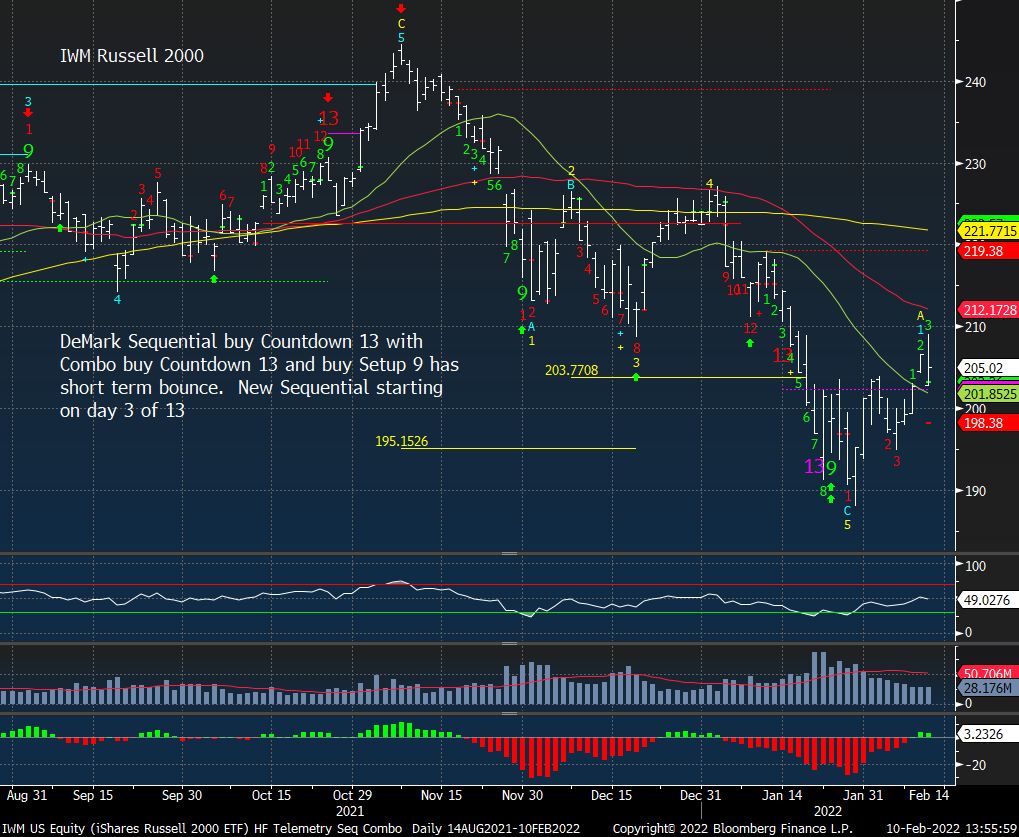
Russell 2000 IWM daily faded off the highs. Staying short.
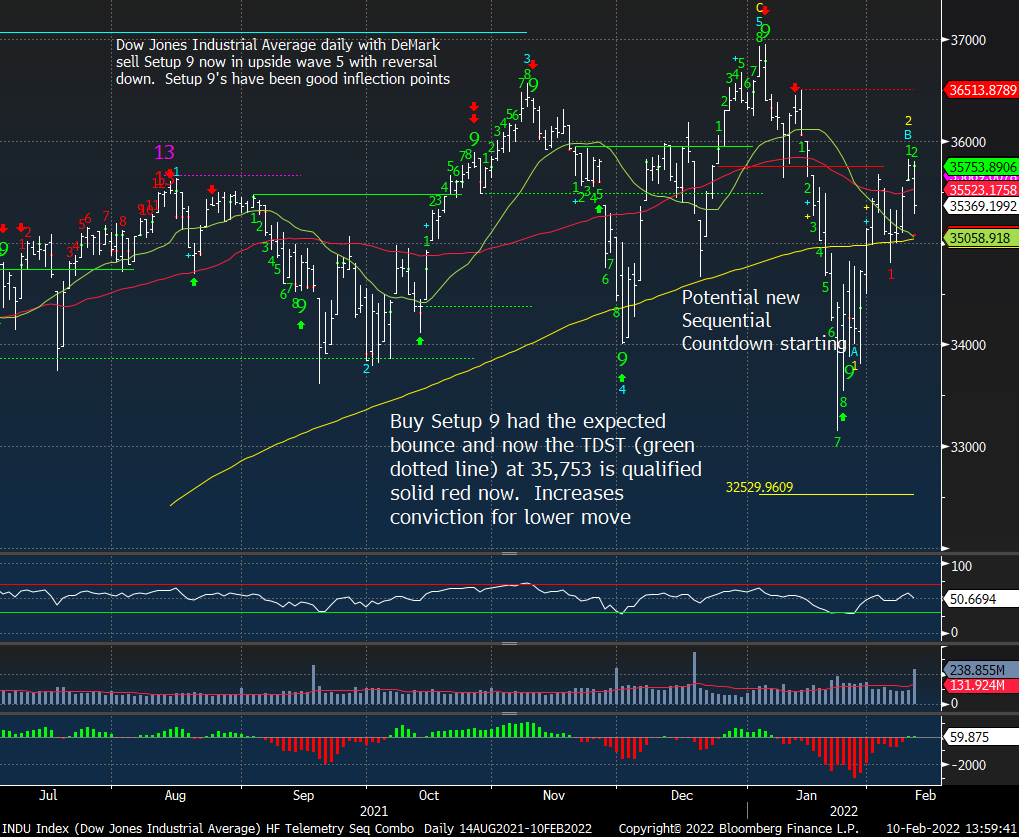
Dow Jones
commodities in no particular order
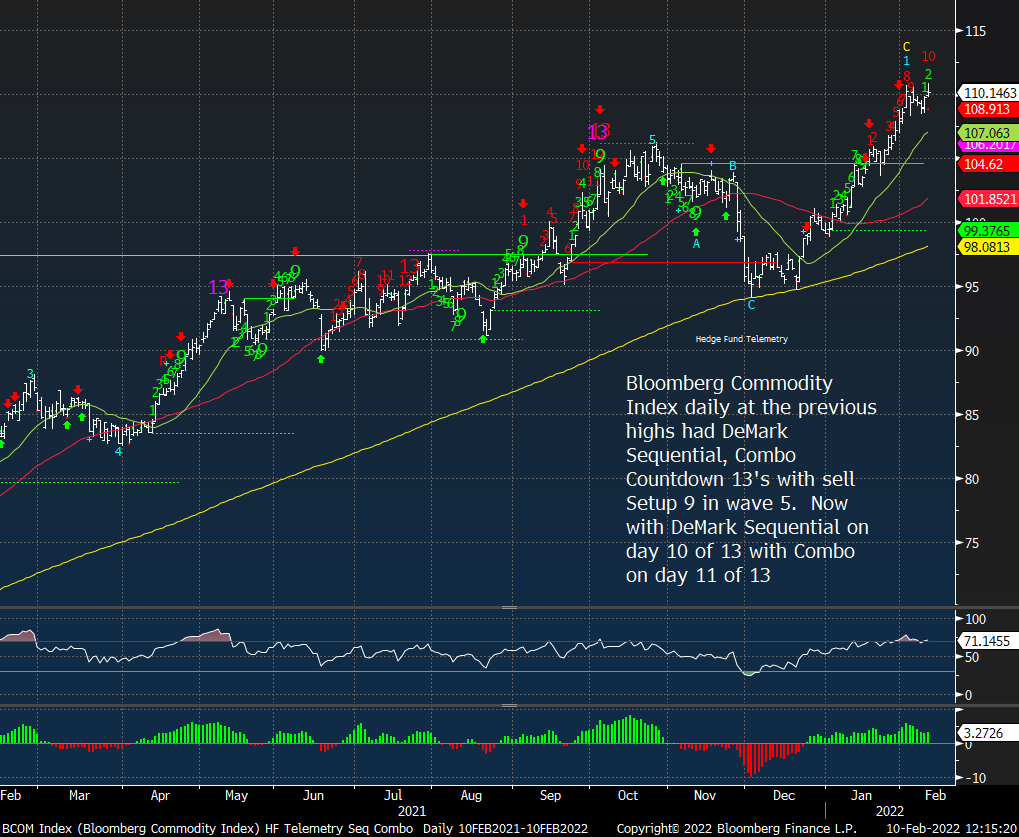
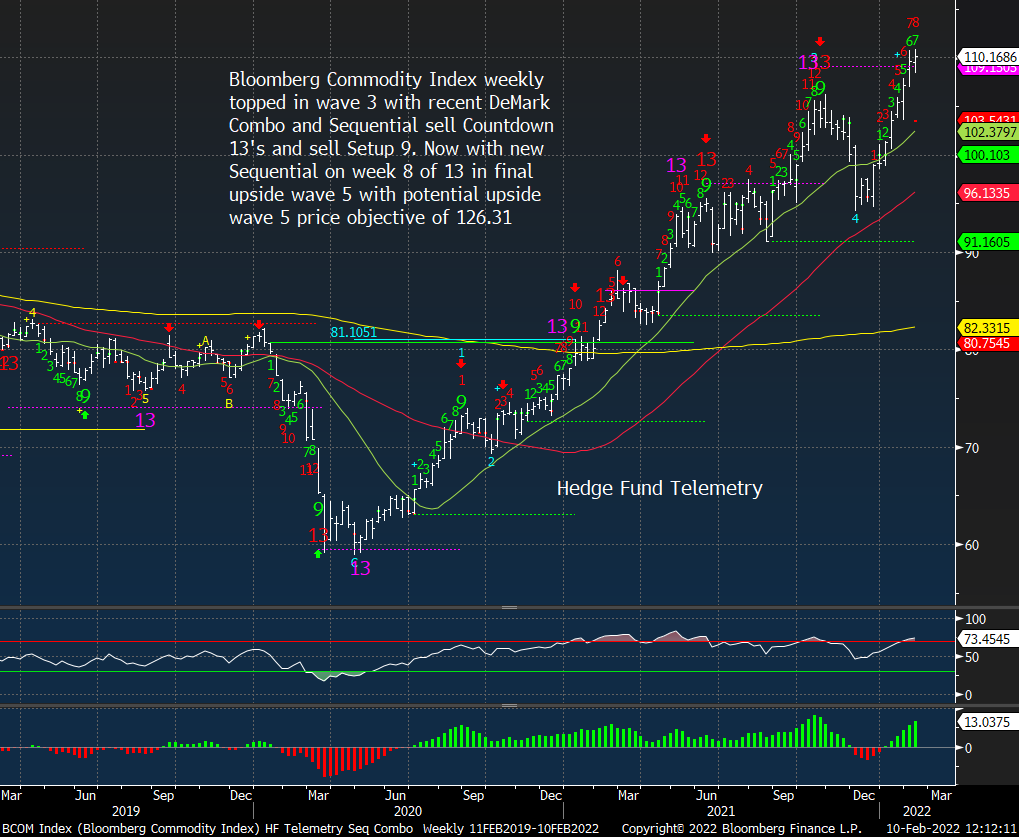
The Bloomberg Commodity Index daily and weekly both have some further upside needed for upside exhaustion. Daily isn’t far but weekly is only on week 8 of 13. I see a peak based on the weekly Countdown sometime exhausting in Q2.
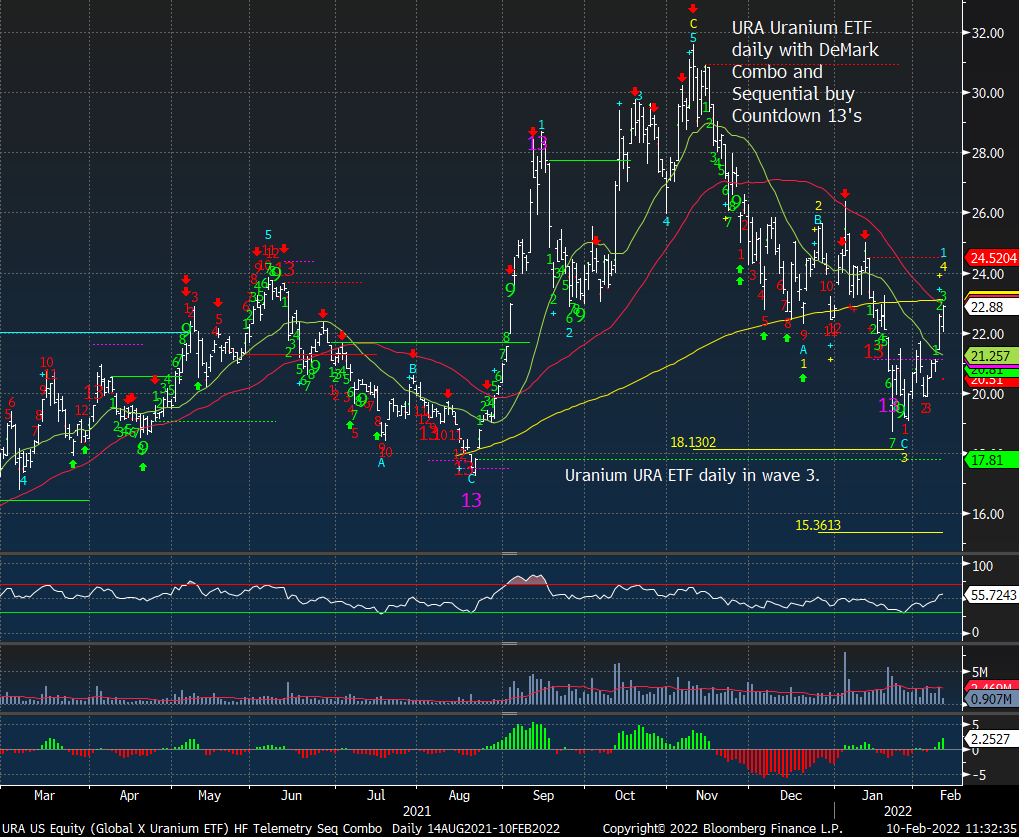
URA improving and needs more mojo to continue
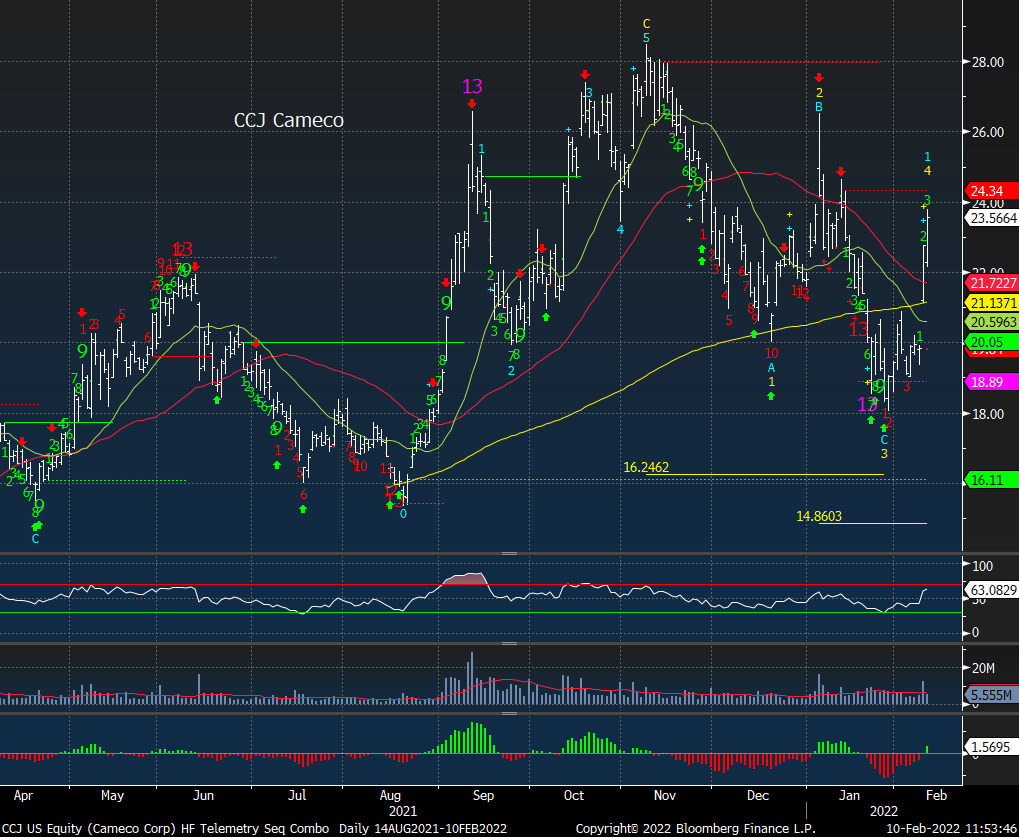
Cameco comments from a smart client who is deeply focused on the Uranium sector. Cameco, the world’s second-largest producer (after Kazatomprom) reported. In their conference call, they stated they had entered into long-term contracts to the tune of 70m lbs in the last 12 months, of which 40m lbs alone was in January. They are also planning to bring McArthur River back on-stream to fulfill these contracts, having previously said they would do so only when the contracted uranium price justified it. McArthur River is the world’s best mine, and Cameco closed it down a few years ago until the price they could get for the uranium justified exploiting the world’s best resource. That day has now arrived and was taken by the market as a very bullish sign that a new long-term contracting cycle has started, the catalyst in previous cycles for an explosive bull market in the mining equities. Cameco finished the day up more than 14%, with other names in the sector up big too
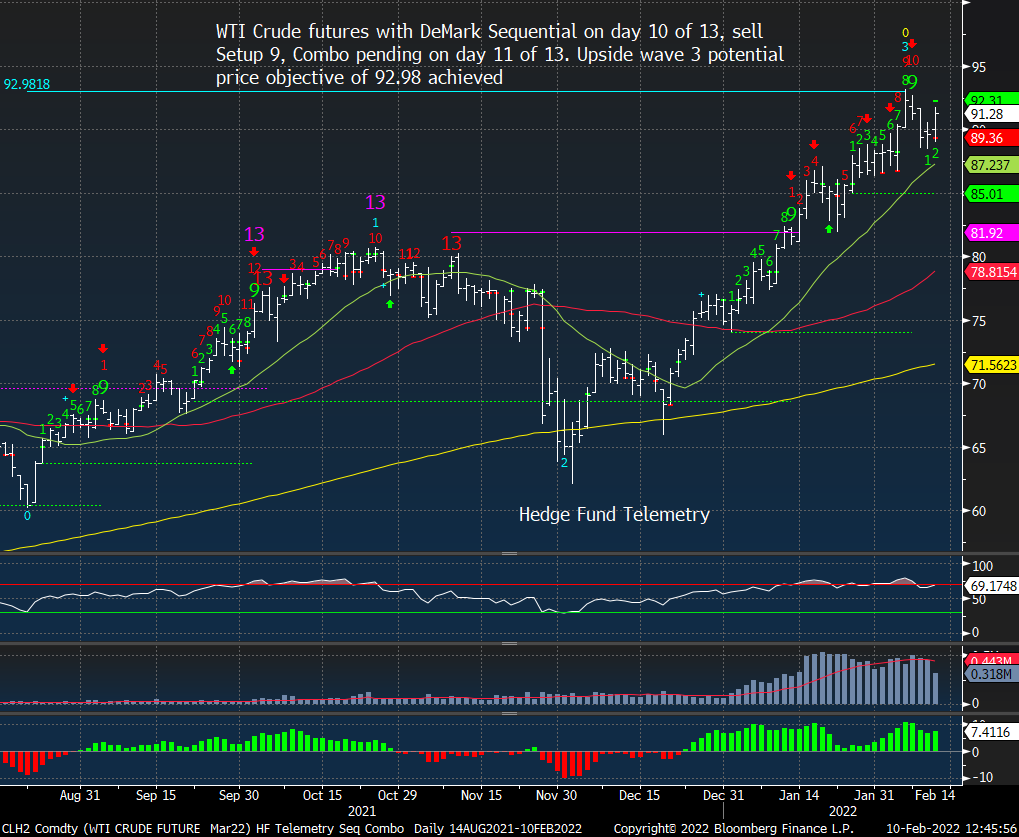
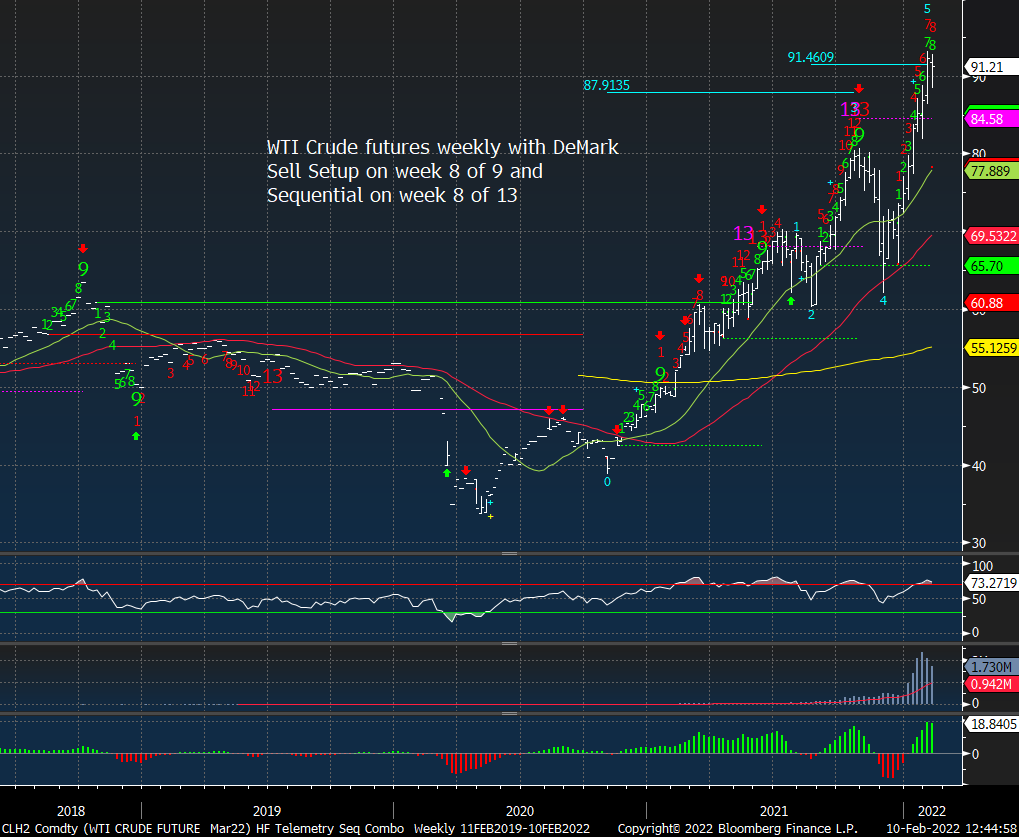
WTI Crude daily still has a pending Sequential Countdown that is near however the weekly has more intermediate term upside potential
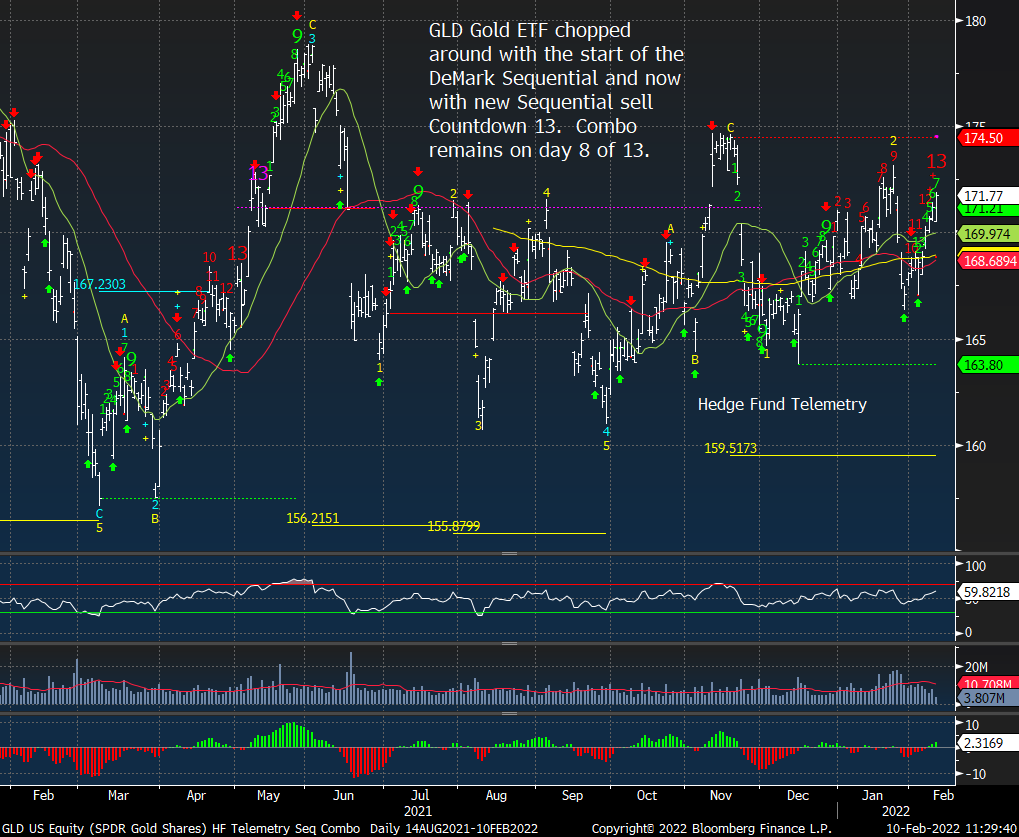
GLD does have a Sequential sell Countdown 13. I am however sticking with my long.
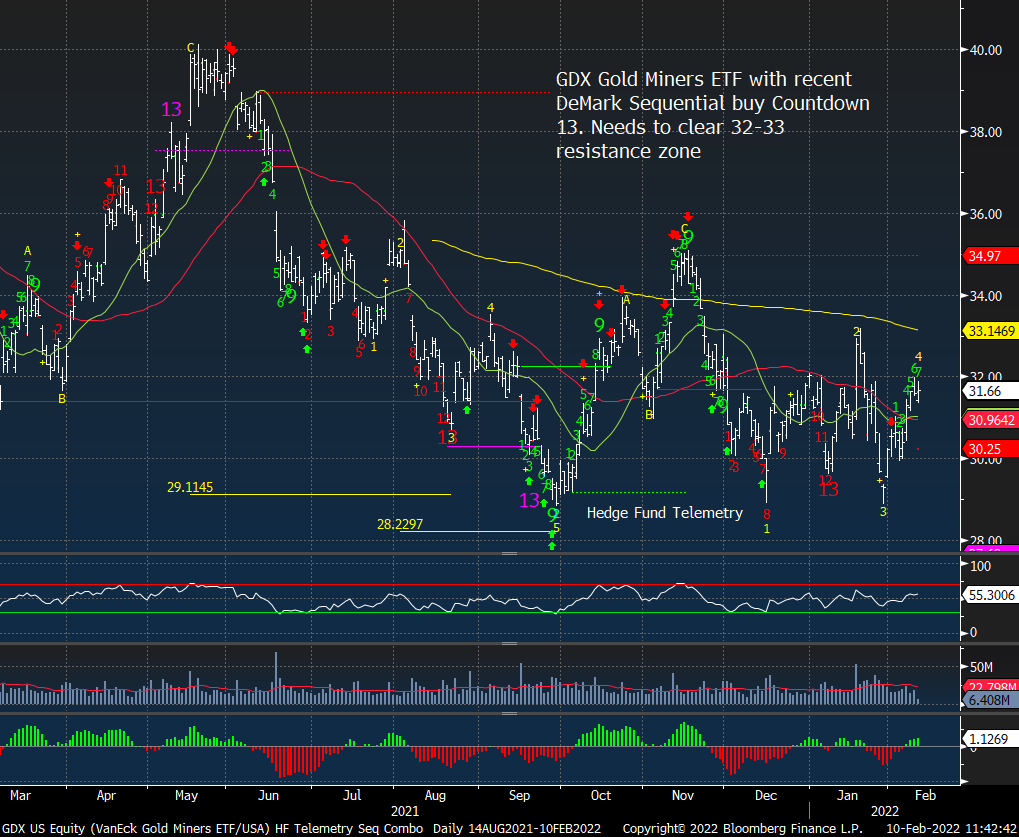
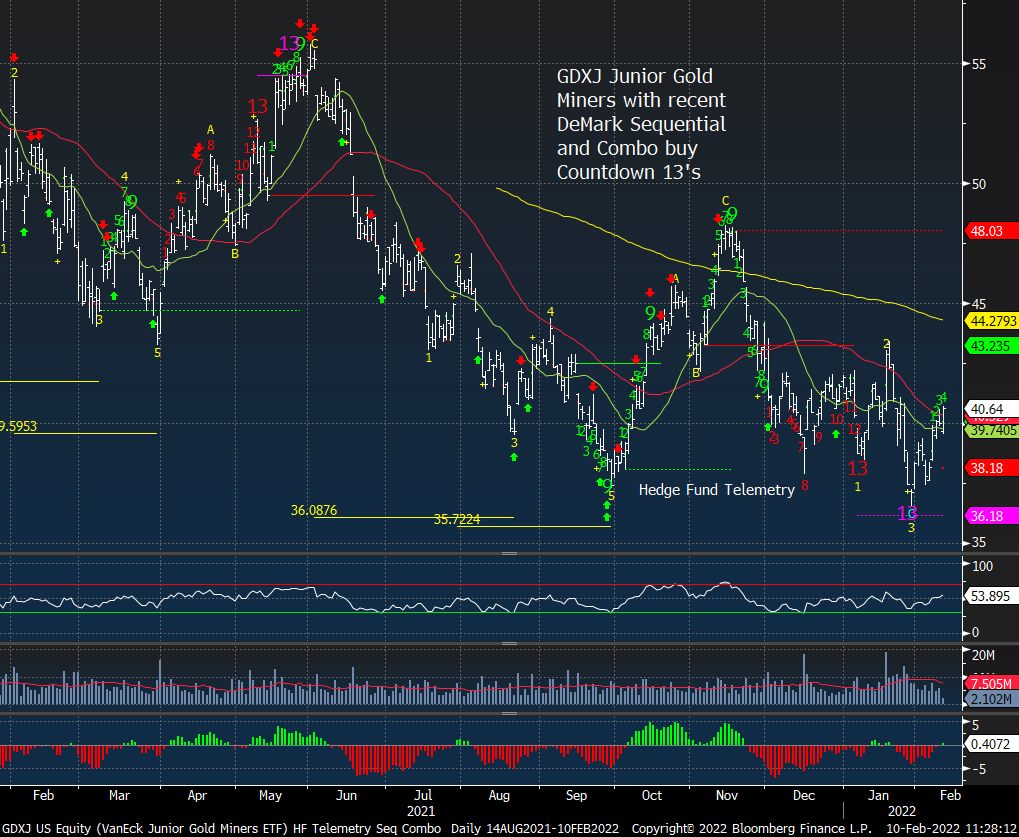
Gold miners need to make one higher high. Frustrating
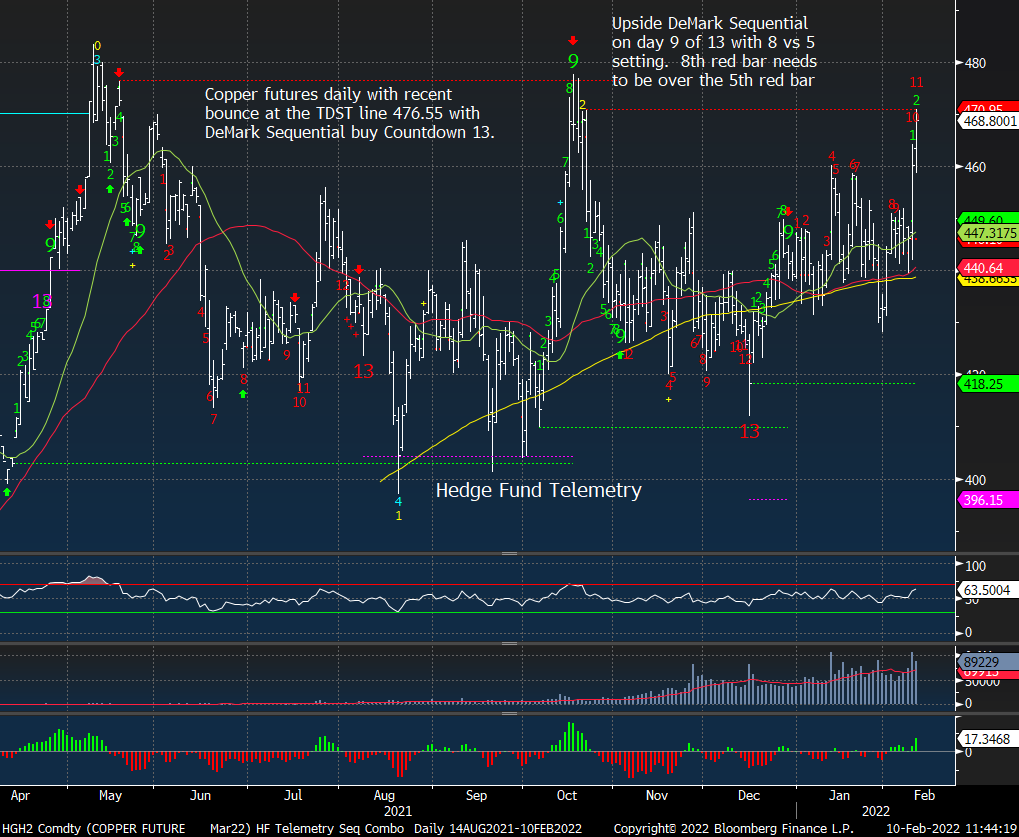
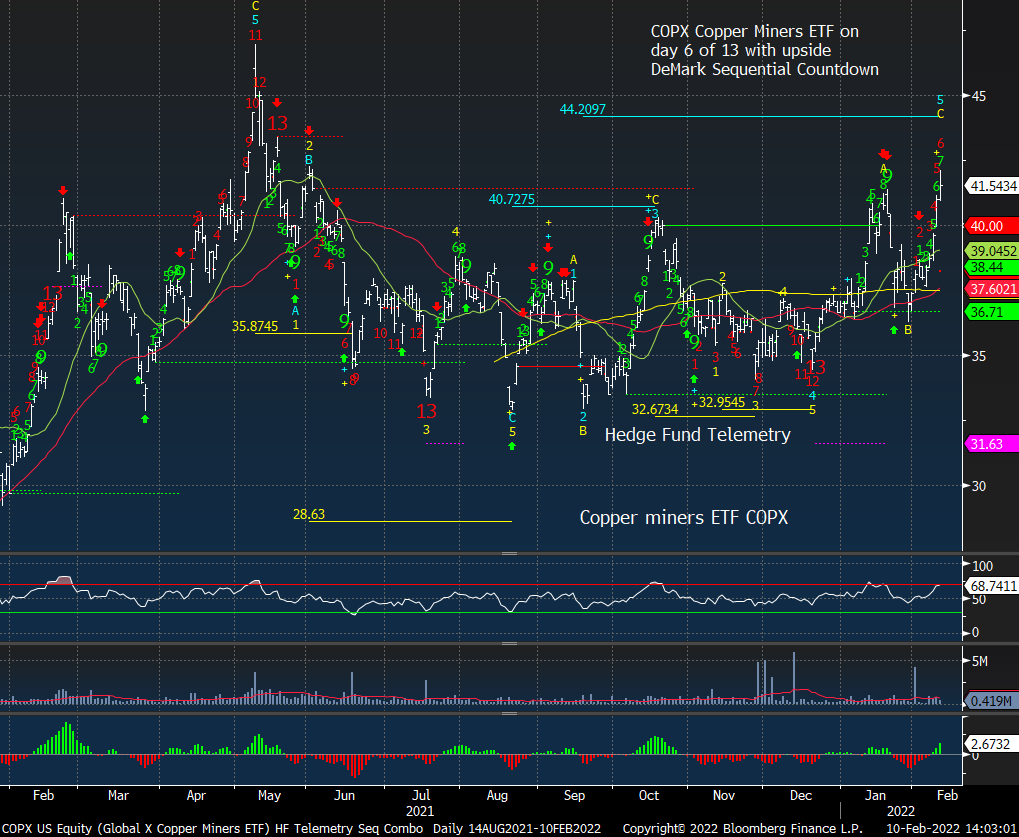
Copper and the miners are performing well and I still believe we will see higher prices
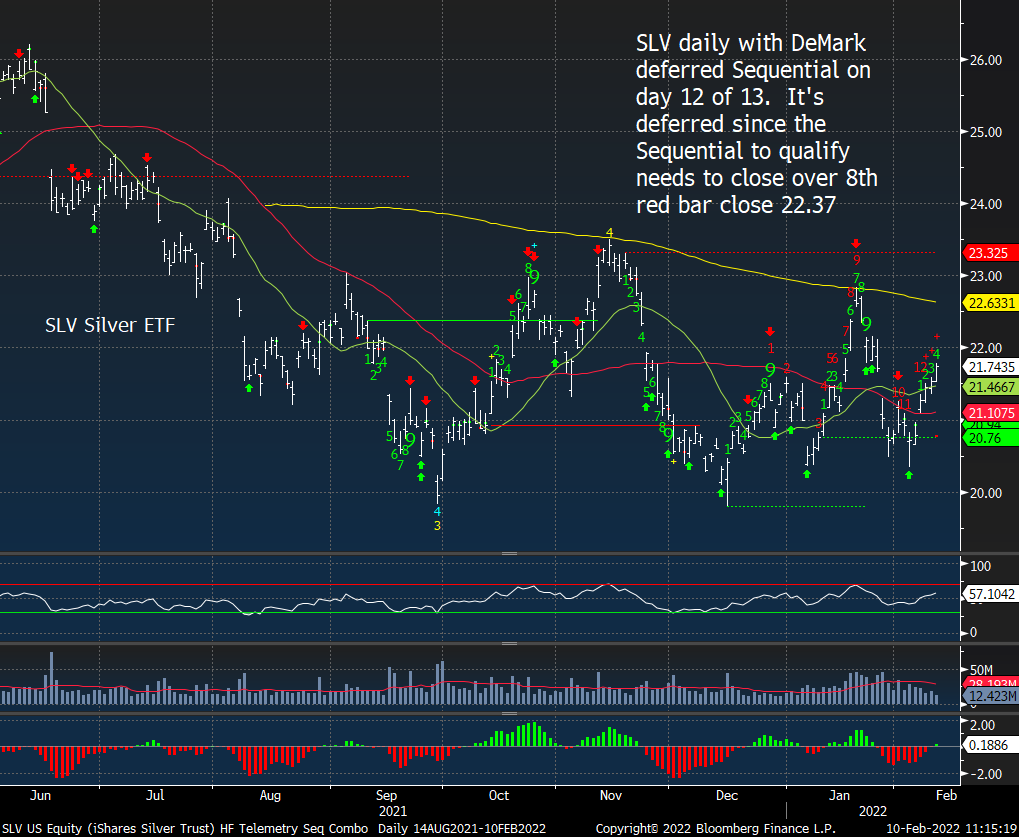
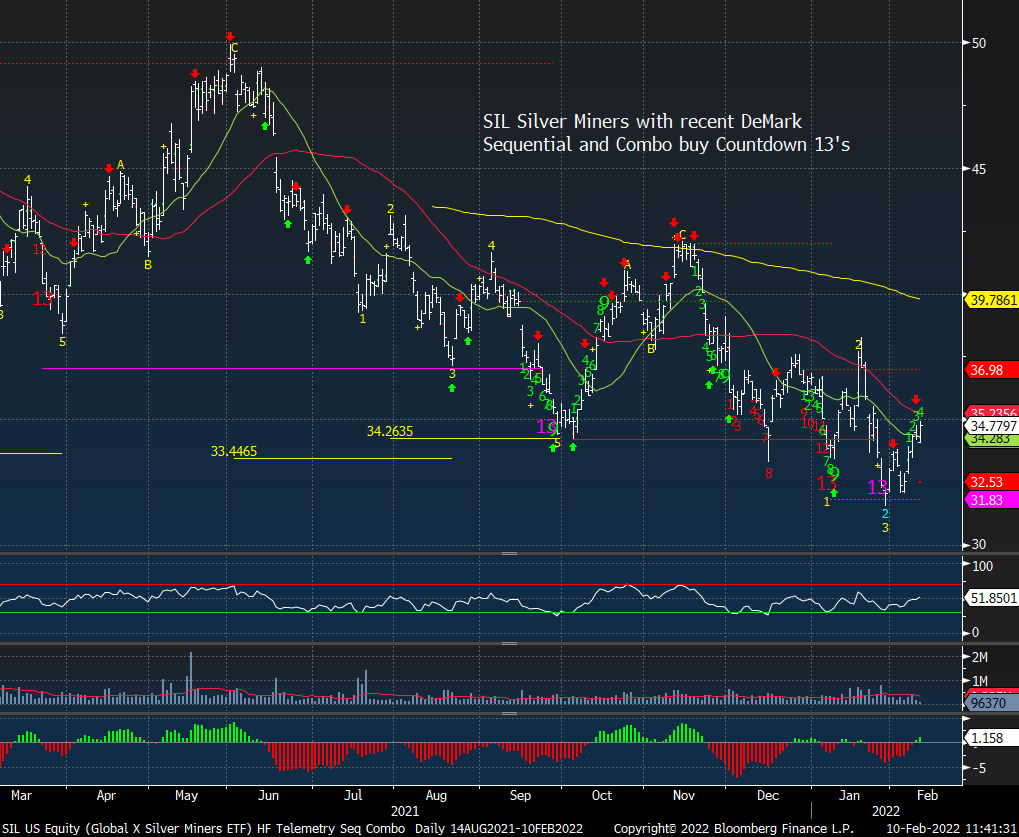
Silver and the miners need to break out and make just one higher high. Frustrating
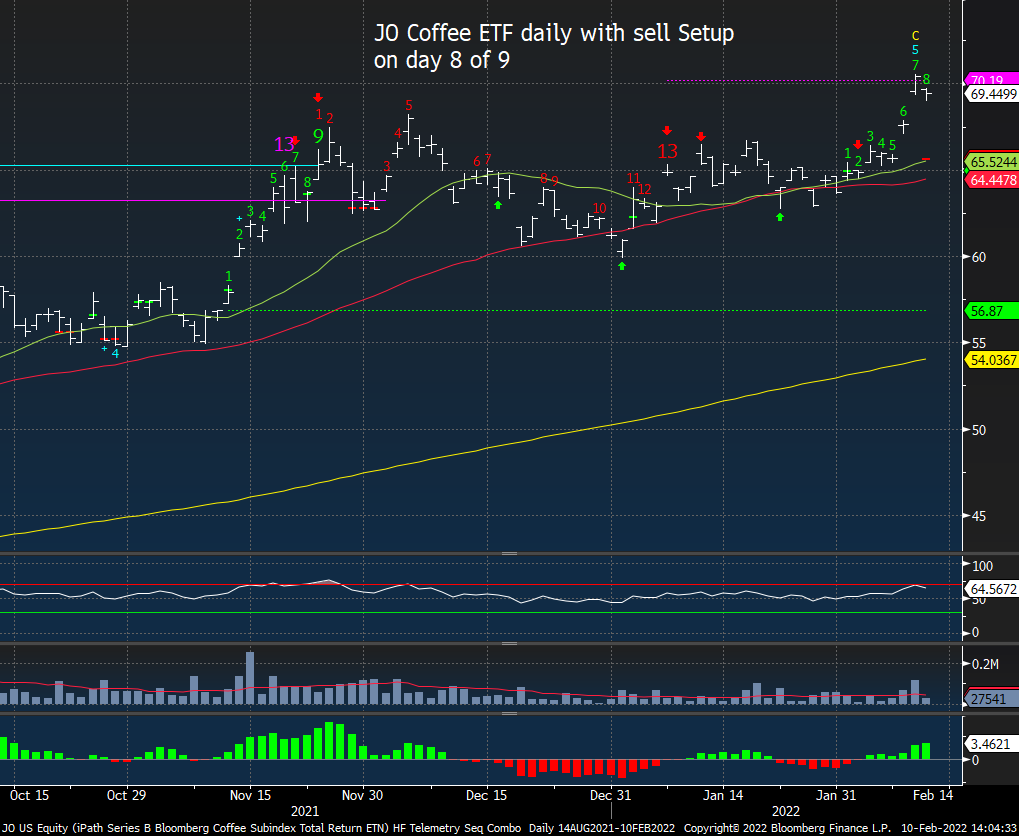
I like Coffee short here.
BOND UPDATE
US 2 year is up 17bps today and it was even higher earlier. This is massive. The 2 year has just laughed at the DeMark signals.
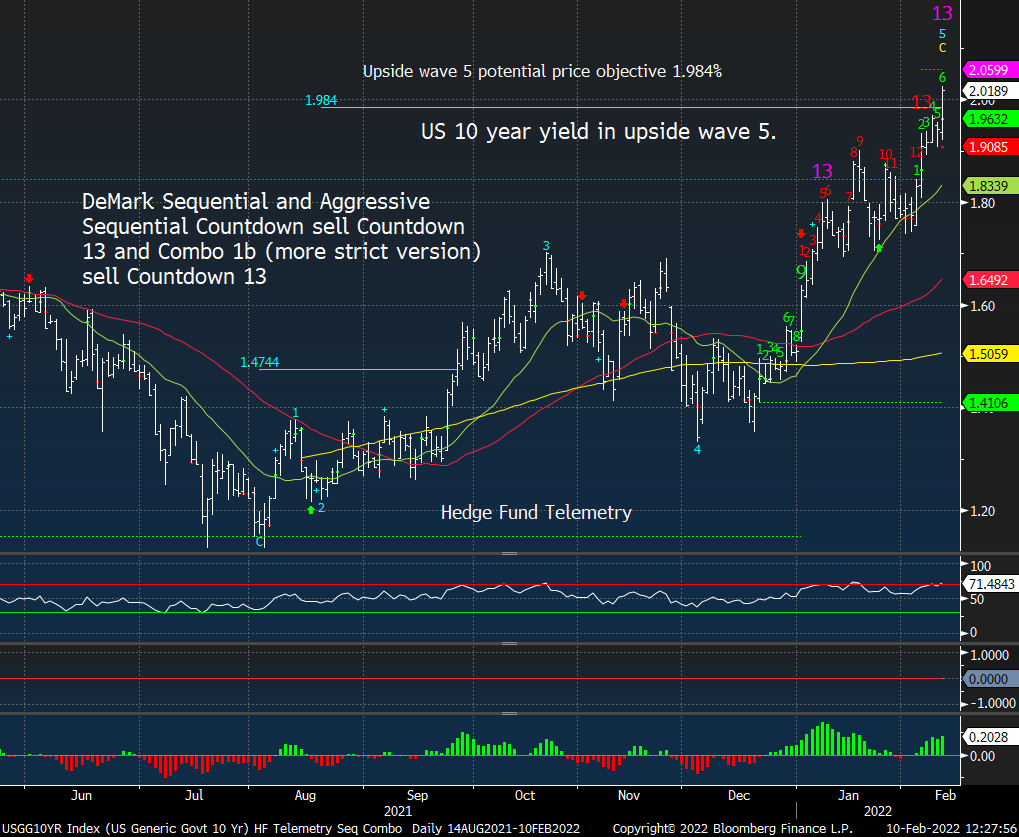
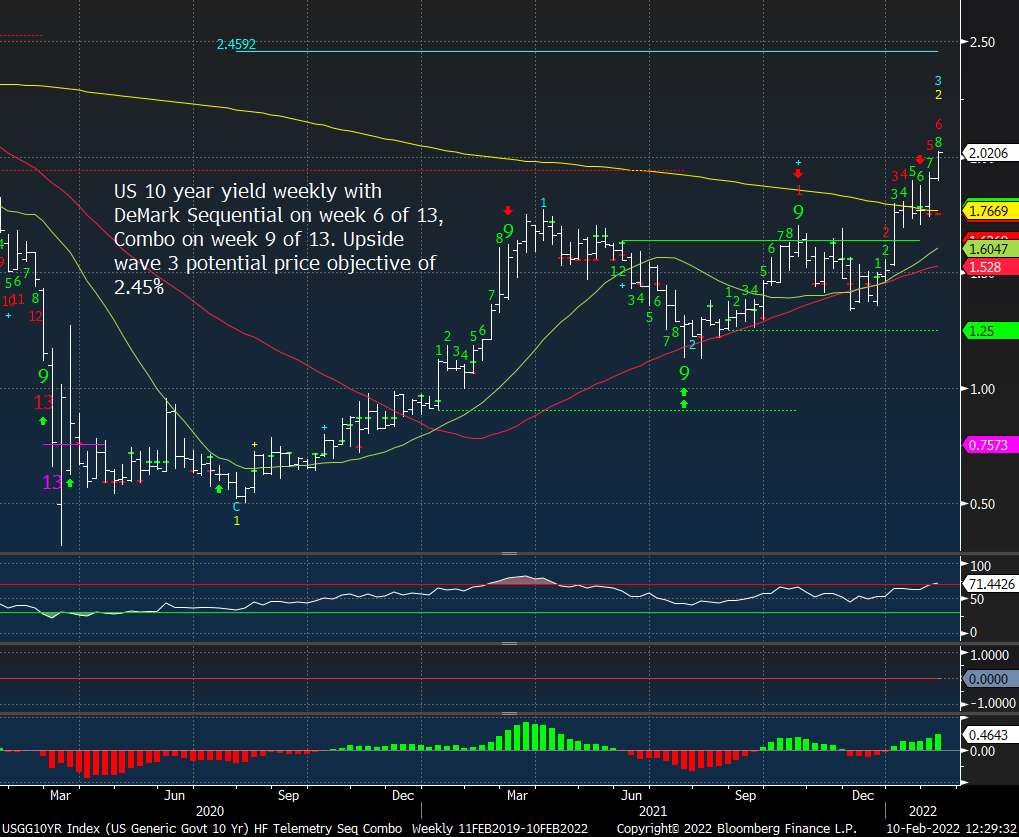
US 10 year daily has some sell Countdown 13’s now over 2%. This gives me pause thinking rates can drop in the short term. The weekly below still has potential higher on a more intermediate term
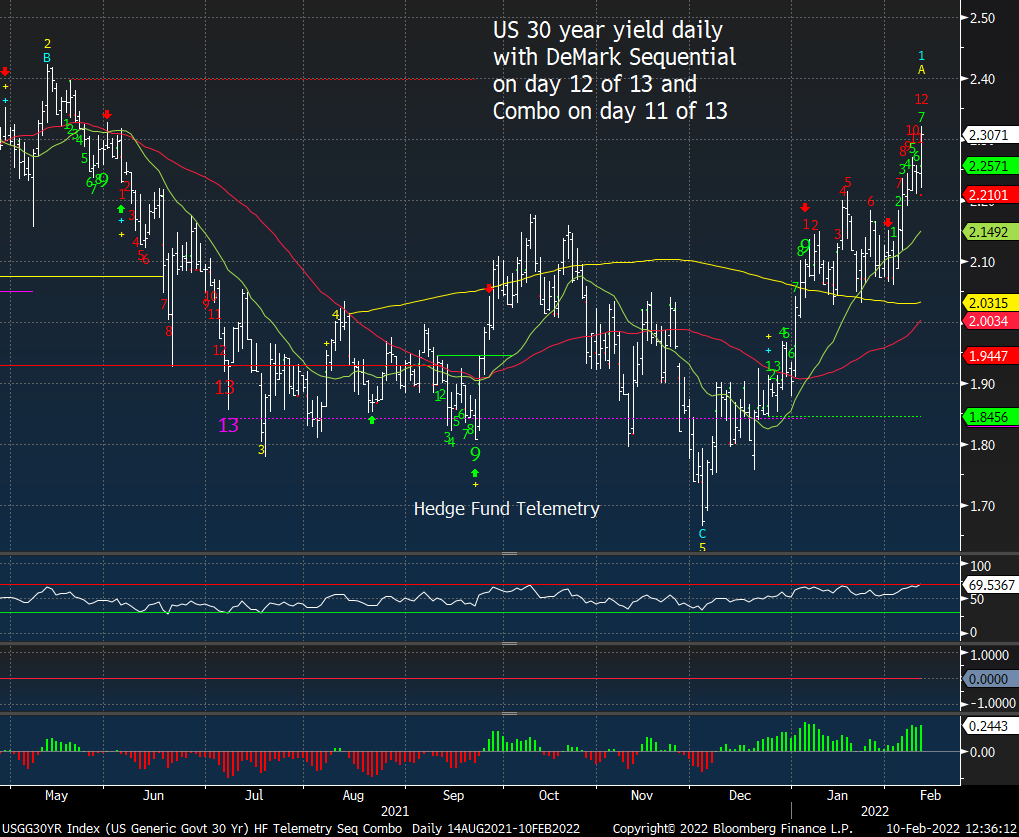
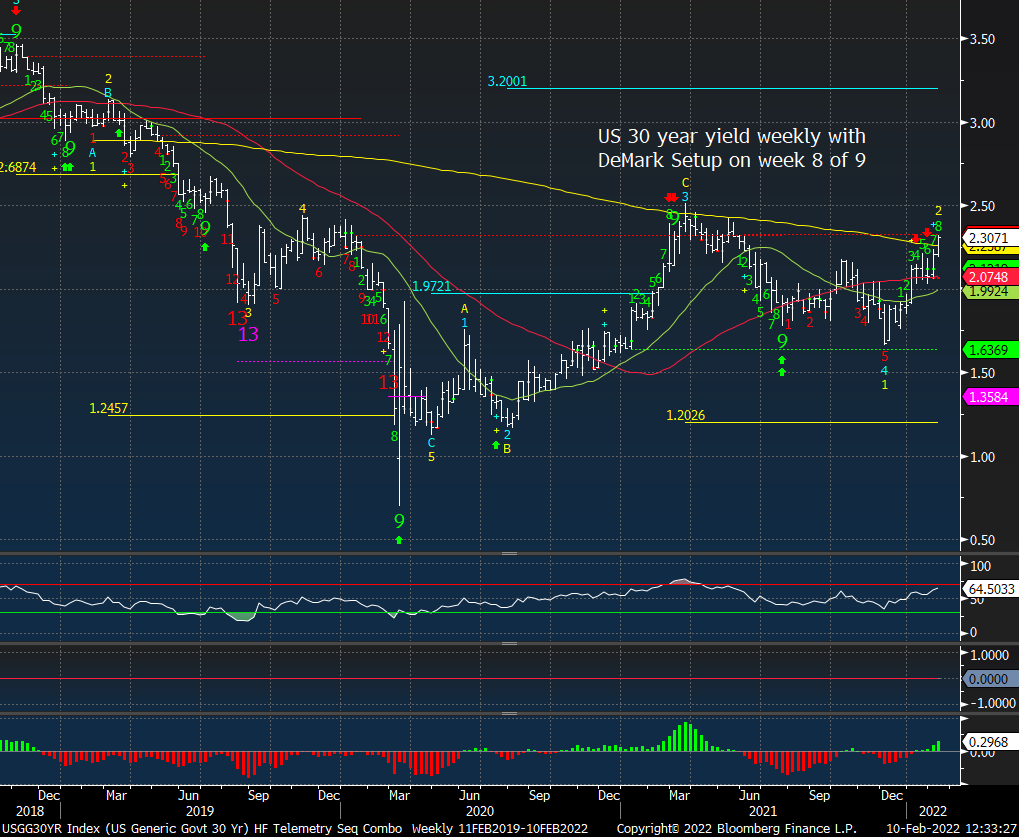
US 30 year yield is getting closer on daily while the weekly could still see higher before exhaustion
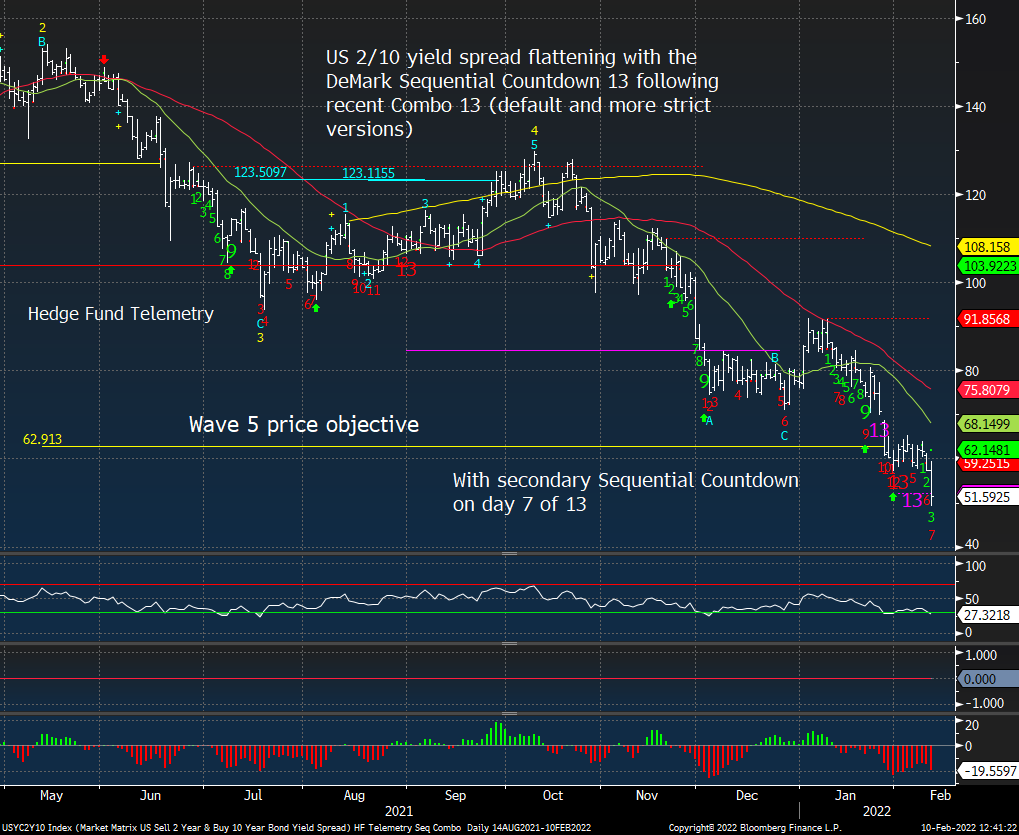
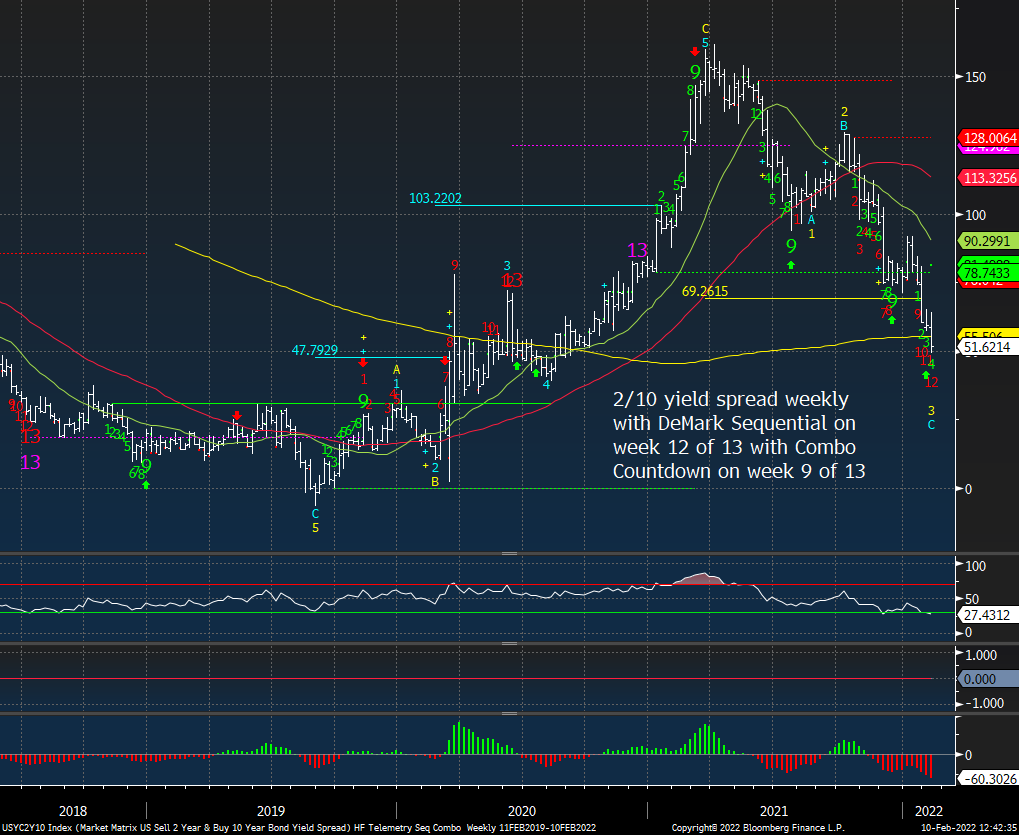
2/10 yield spread daily and weekly
FACTORS, GOLDMAN SACHS SHORT BASKETS AND PPO MONITOR UPDATE
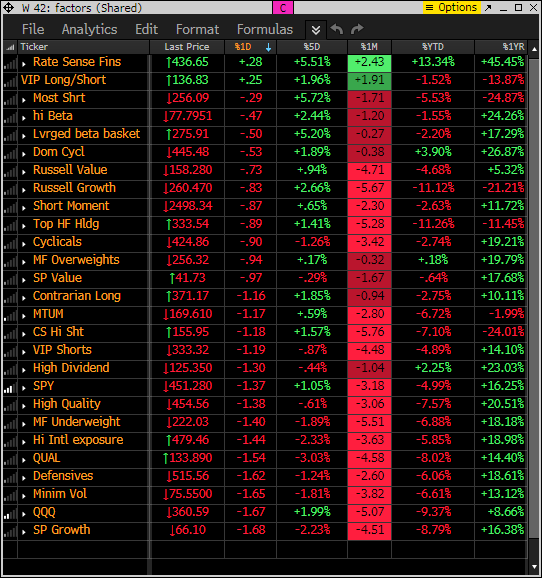
Factor monitor now has a reset YTD performance column. Factor monitor now has a reset YTD performance column. Nearly everything is down YTD. Still seeing some of the most short factors towards the higher end of the monitor. QQQ and growth getting hit hard
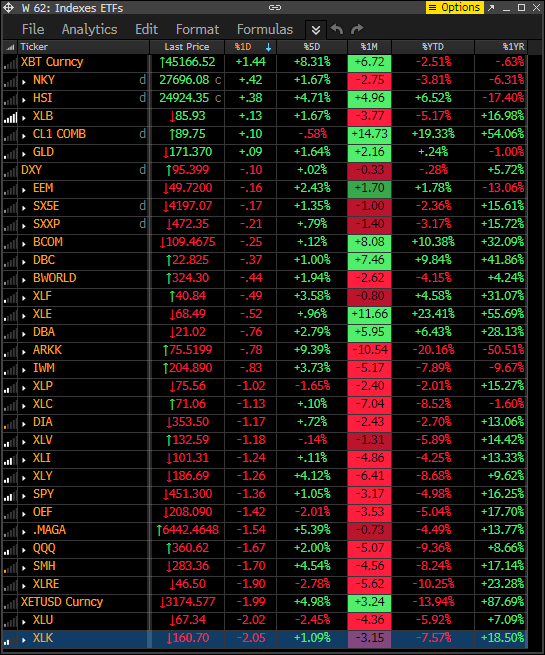
This is similar to the above monitor with various ETFs other indexes as I wanted to show the same 5 day, 1 month rolling as well the YTD and 1 year. Heavy losses with tech, consumer
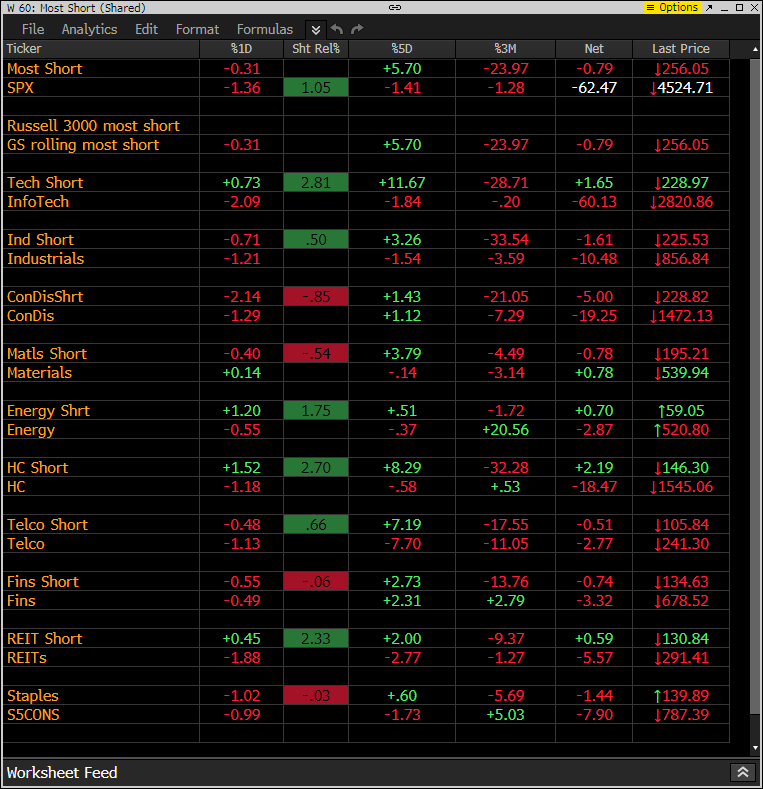
This is the monitor that has the S&P indexes and the Goldman Sachs most shorted baskets. Today the shorts are not down as much as some indexes but overall this is mixed
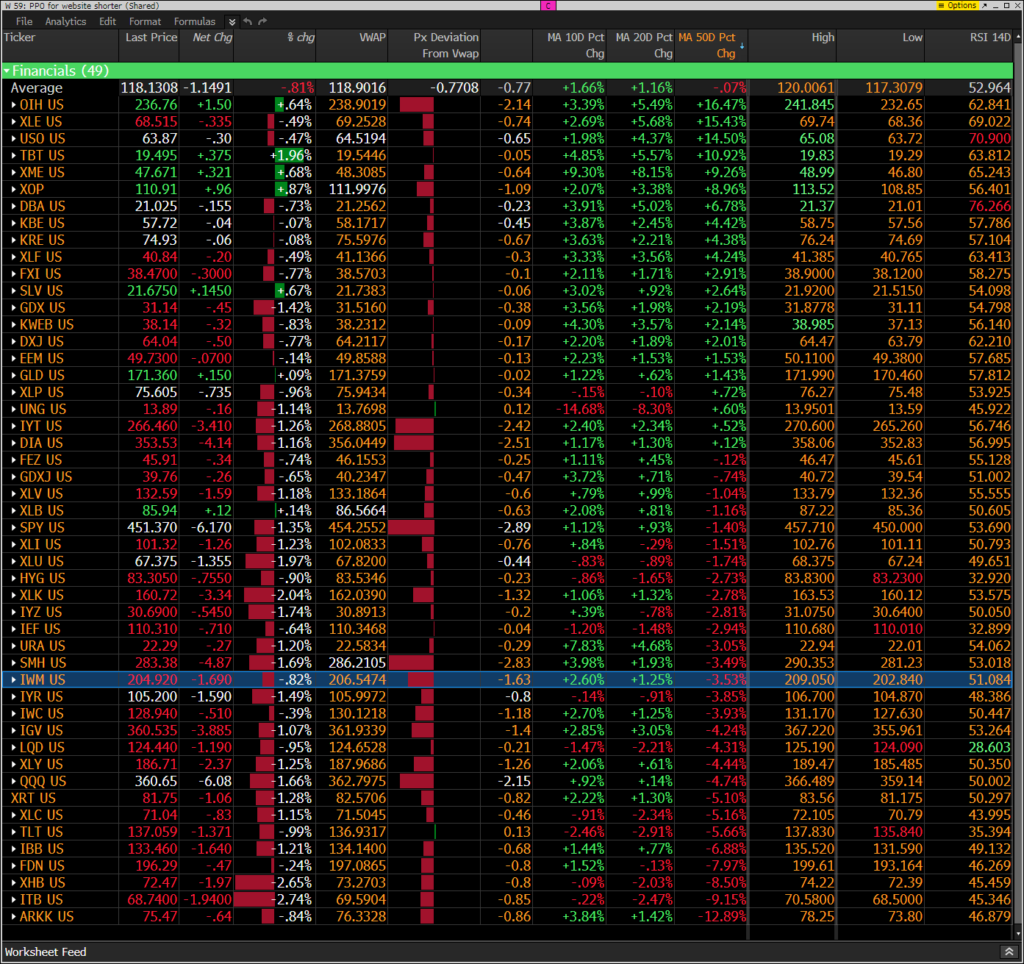
The PPO monitor (percentage price oscillator) force ranks ETF’s by percentage above/below the 50 day moving average. For information on this monitor please refer to this primer. This monitor is offered to Hedge Fund Telemetry subscribers who are on Bloomberg. Heavy selling on the lower half of the monitor with bounce hopes faded. And below VWAP levels which is not positive
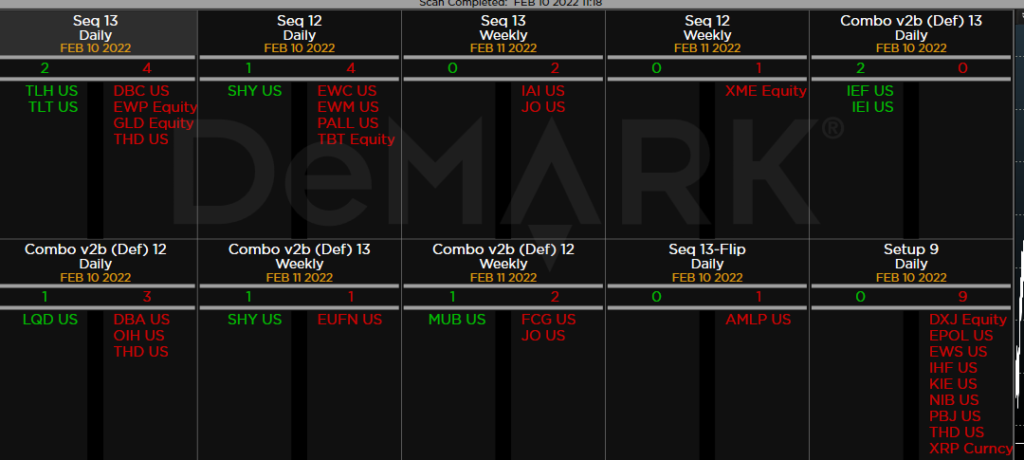
DEMARK OBSERVATIONS
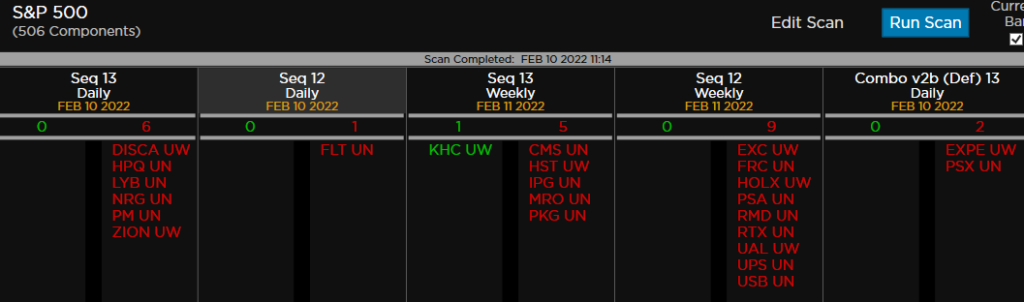
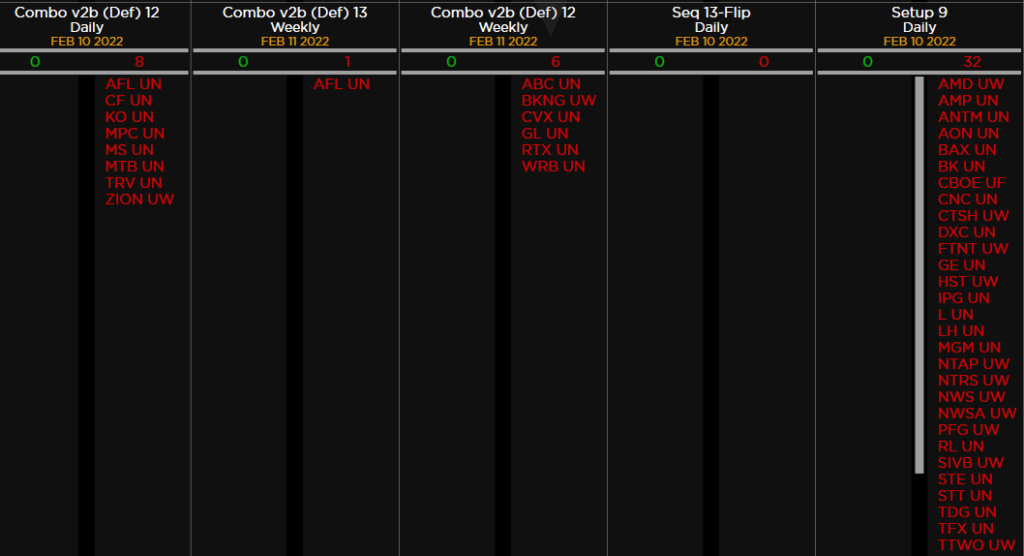
Within the S&P the DeMark Sequential and Combo Countdown 13’s and 12/13’s on daily and weekly time periods. For information on how to use the DeMark Observations please refer to this primer. Worth noting: Seeing a lot of Sell Countdown 13’s again with 32 sell Setup 9’s. Remember all the buy Setup 9’s that signaled the bounce?
I’ve been watching JWN as a new long idea and I’m going to hold off today with the market fading
ETFs among a 160+ ETF universe.