
Quick Market Views
PLEASE NOTE: I WILL NOT BE POSTING THE USUAL NOTES ON THURSDAY AND FRIDAY AS I AM TRAVELING. IT IS MY YOUNGEST DAUGHTER’S GRADUATION FROM COLLEGE.
I WILL IF NEEDED TRY AND POST SOME BRIEF NOTES
I’m on Real Vision Daily Briefing live at the close 4pm ET. Watch it on YouTube
Stocks: Hedge fund manager David Tepper told CNBC he covered his tech short and went long which caused a pop premarket. I have a lot of indicators, sentiment, and internals that are at or near levels where I want to get long. The DeMark Sequential on the downside is still in progress on the major indexes while I’m looking at a lot more signals starting to develop. I’m tentative at this point. Below I have a list I like for bounces which I nearly added small but held off with the VWAP breaks. If you didn’t take profits on half of the SPY and QQQ put spreads by half yesterday I think it’s smart risk management.
Bonds: Bid once again and it could be a turn but I’ve seen a few false starts. A weaker CPI would likely see bonds bid but that’s in theory and this market has broken all the rules.
Commodities: Actually a relatively quiet day with few markets +/- 1%
Currencies: US Dollar is up again (what’s new?) with Bitcoin bouncing after yesterday’s blood bath.
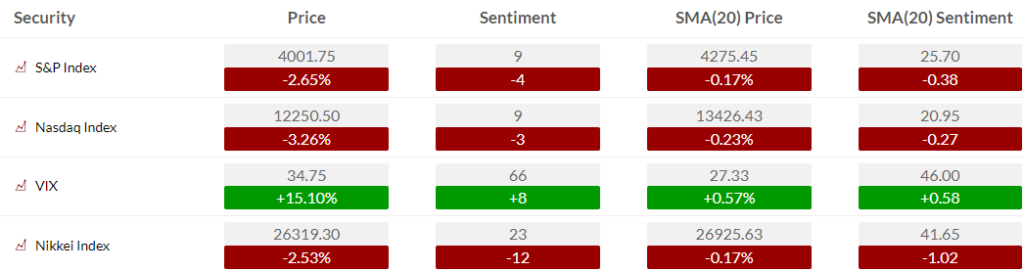
US Market Indexes and Sentiment
Here is a primer on how we use Daily Sentiment Index charts. Lower on this note is bond, currency, and commodity sentiment.
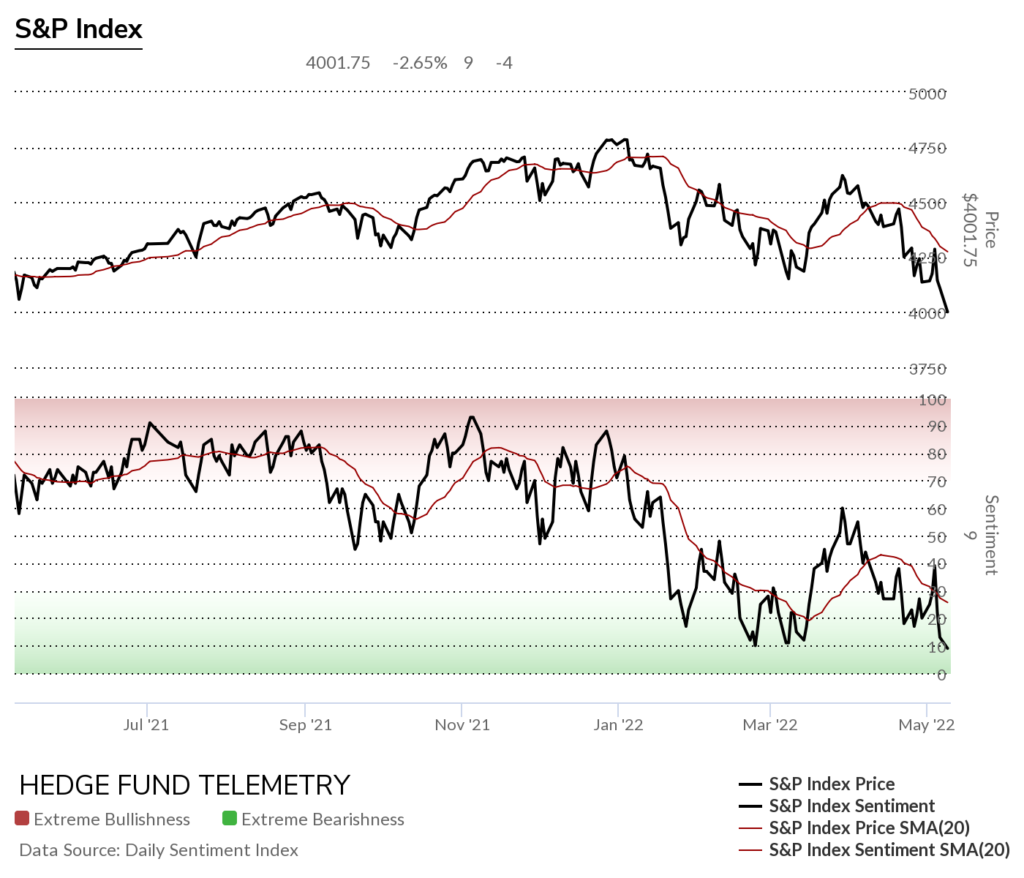
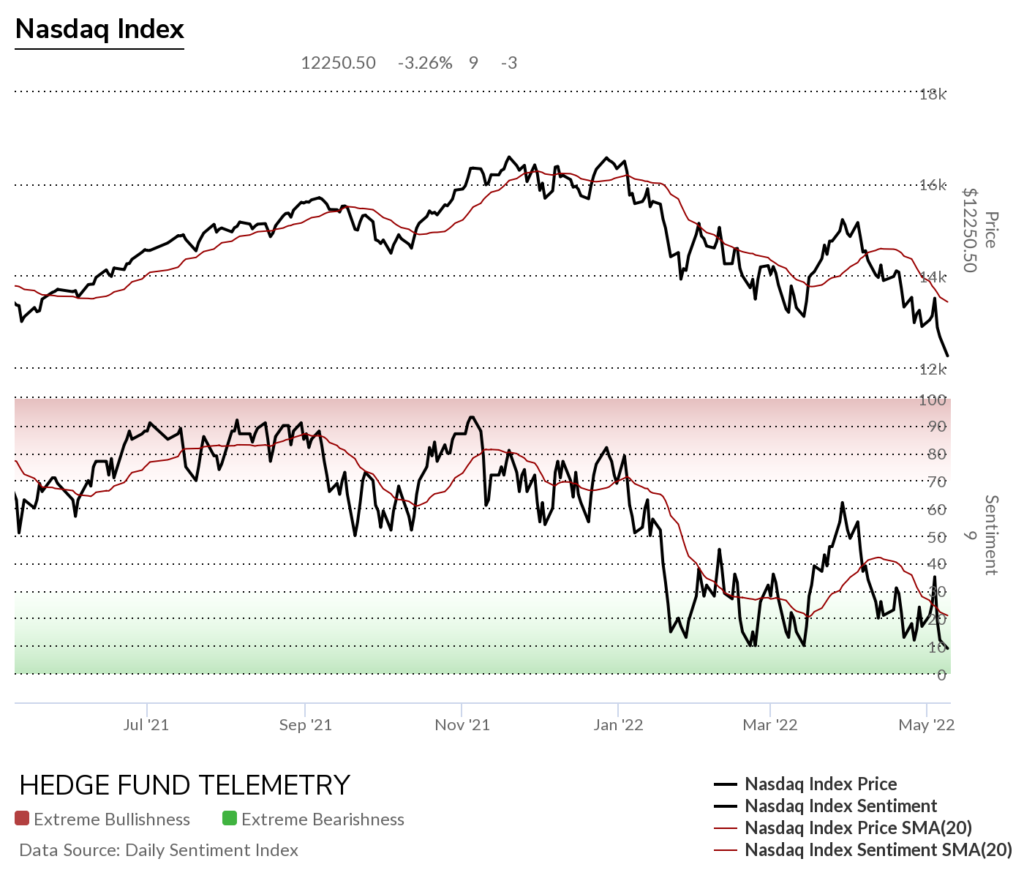
S&P bullish sentiment and Nasdaq bullish sentiment are at 9% and is below the February sentiment low. Sentiment is a condition and not a trigger as I have stated often. It can and might spend more time oversold or overbought.
S&P bullish sentiment at 9% is low and could bounce from this low level
Nasdaq Bullish Sentiment as you see has been choppy in the oversold zone all year.
Here is a primer on the basics of the DeMark Setup and Sequential indicators.
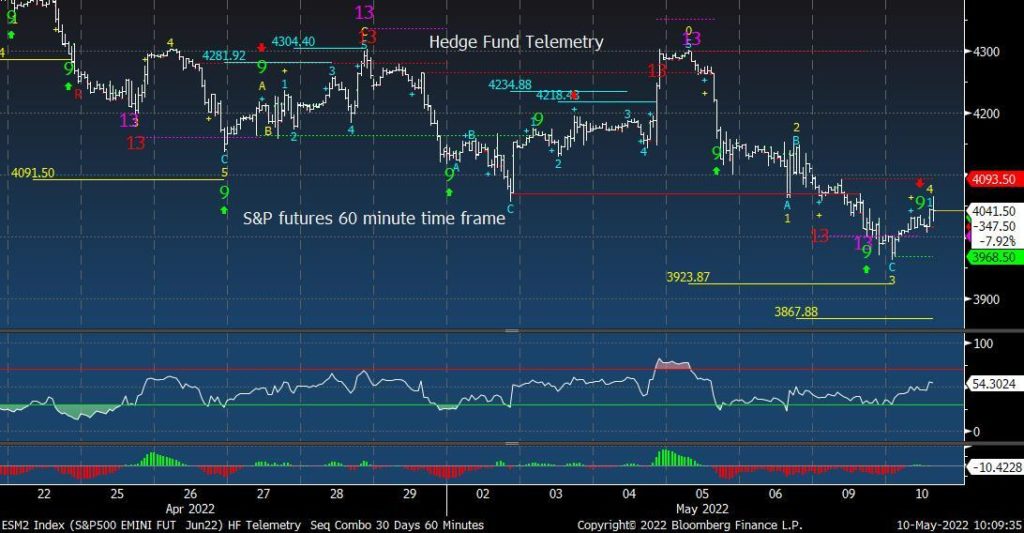
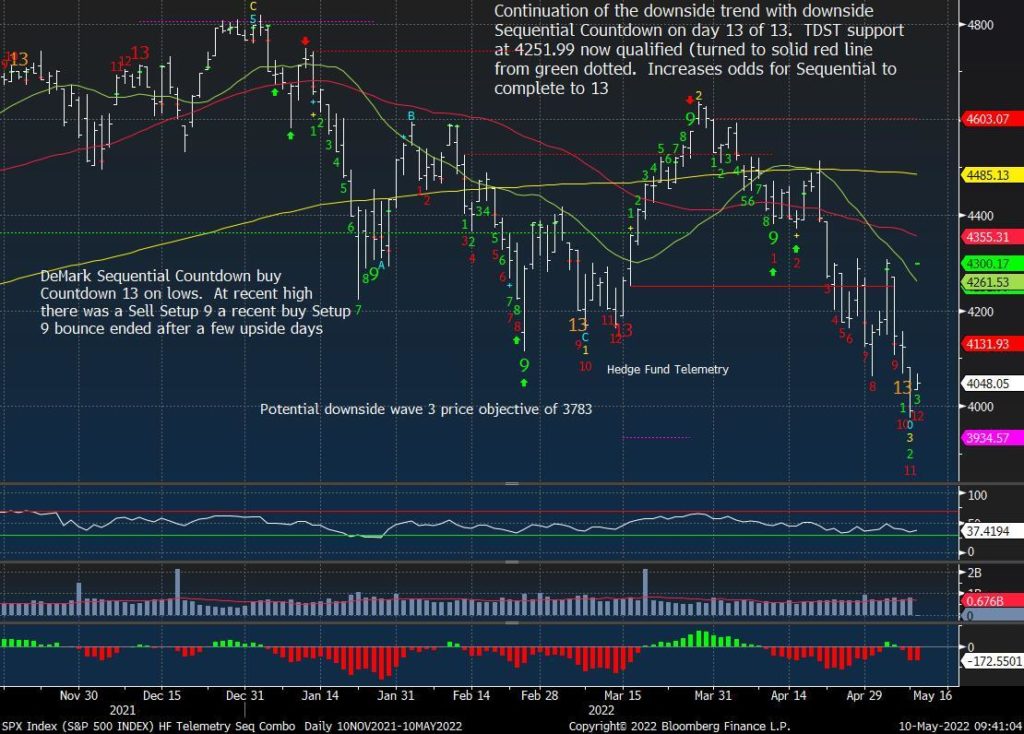
S&P futures 60-minute time frame still as shown earlier this could be a lower high corrective wave 4 bounce with a potential downside wave 5 price objective of 3867 if yesterday’s lows break
S&P 500 Index daily is now on day 12 of 13 with the Sequential. To complete a Countdown bar 13 much be less than or equal to the close of the 8th bar and the normal pattern of the 13th bar must be less than or equal to the low of two earlier bars.
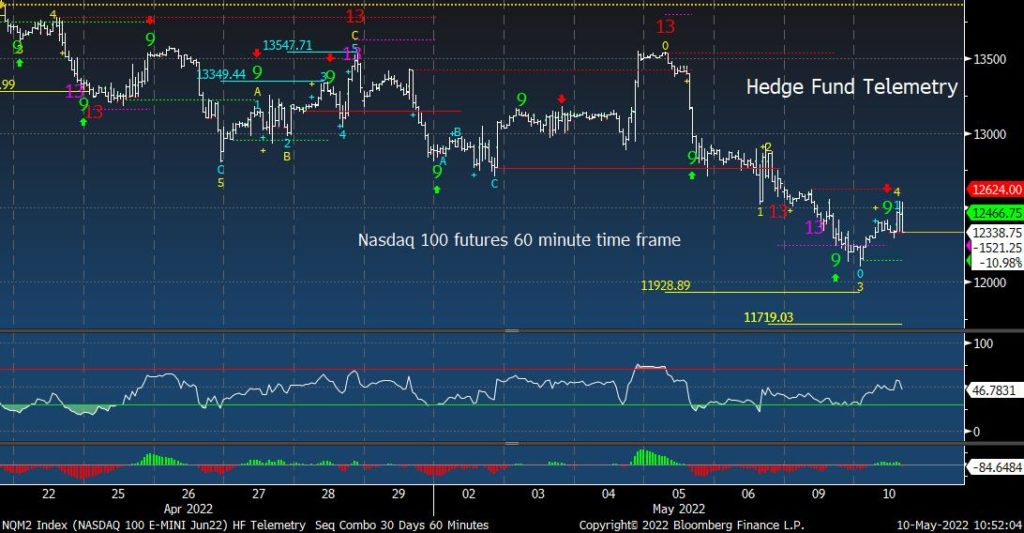
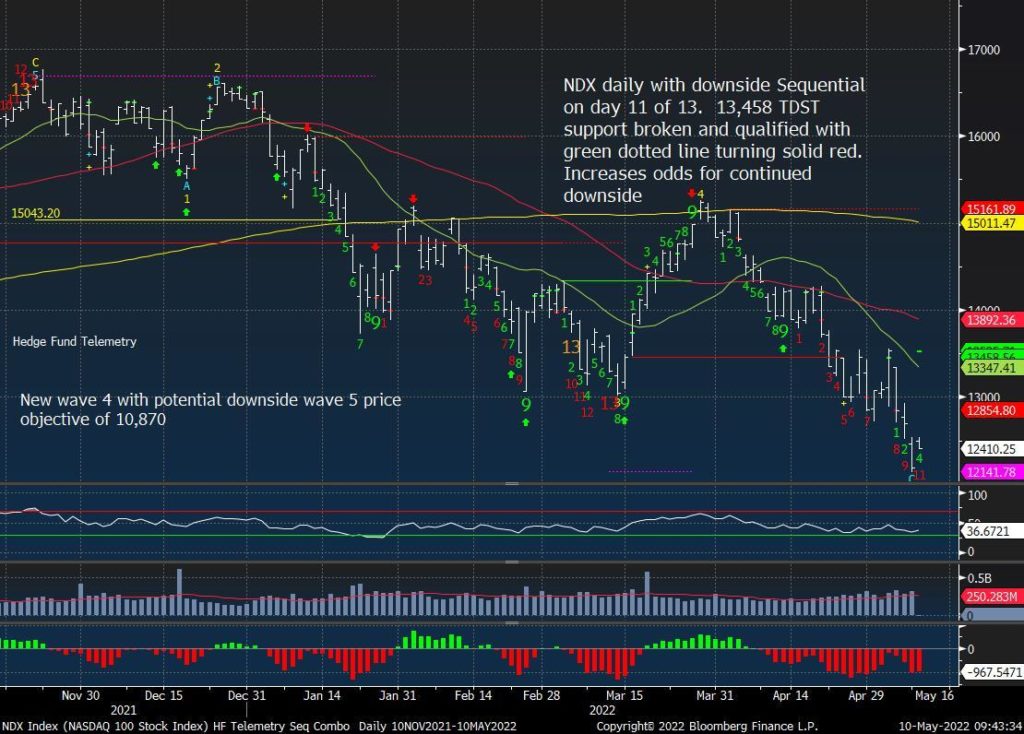
Nasdaq 100 futures 60-minute time frame also in corrective wave 4 of 5 with a potential downside wave 5 price objective of 11,719 if yesterday’s lows break
Nasdaq 100 Index daily is on day 11 of 13 with the Sequential
Trade ideas – getting closer
I nearly bought today with small 1% weights but held back as the VWAP data was not holding the following: AAPL, AMZN, NVDA, SBUX, SHOP, ADBE. And would add to airlines longs and DIS and FWONK longs.
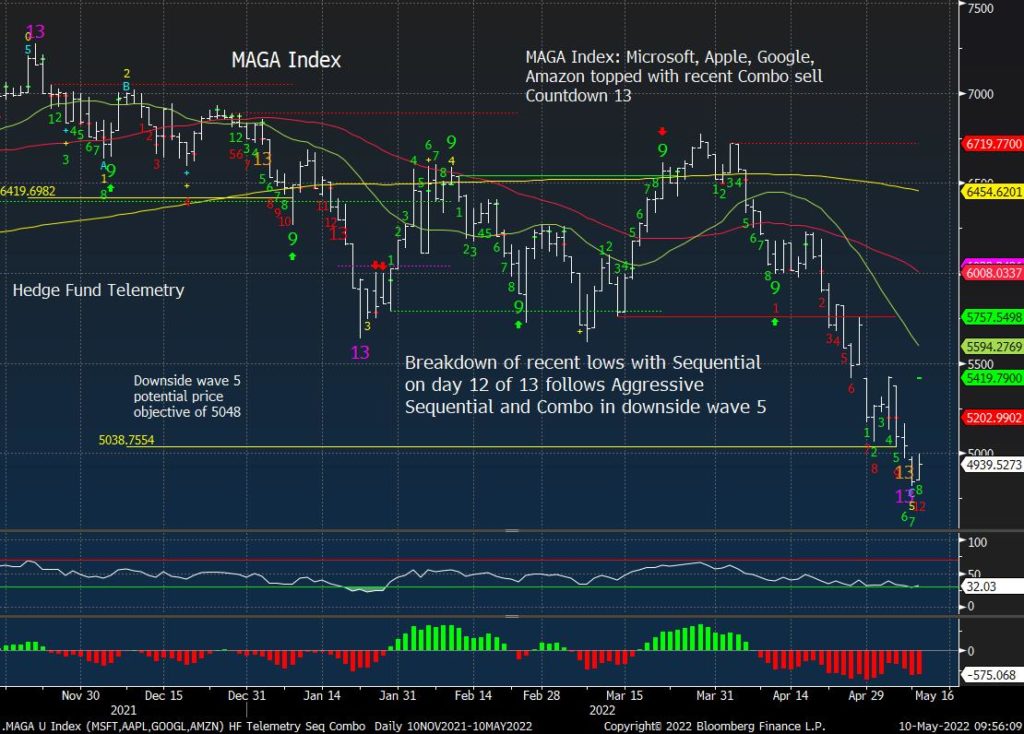
Here’s the MAGA custom index on day 12 of 13 with the Sequential.
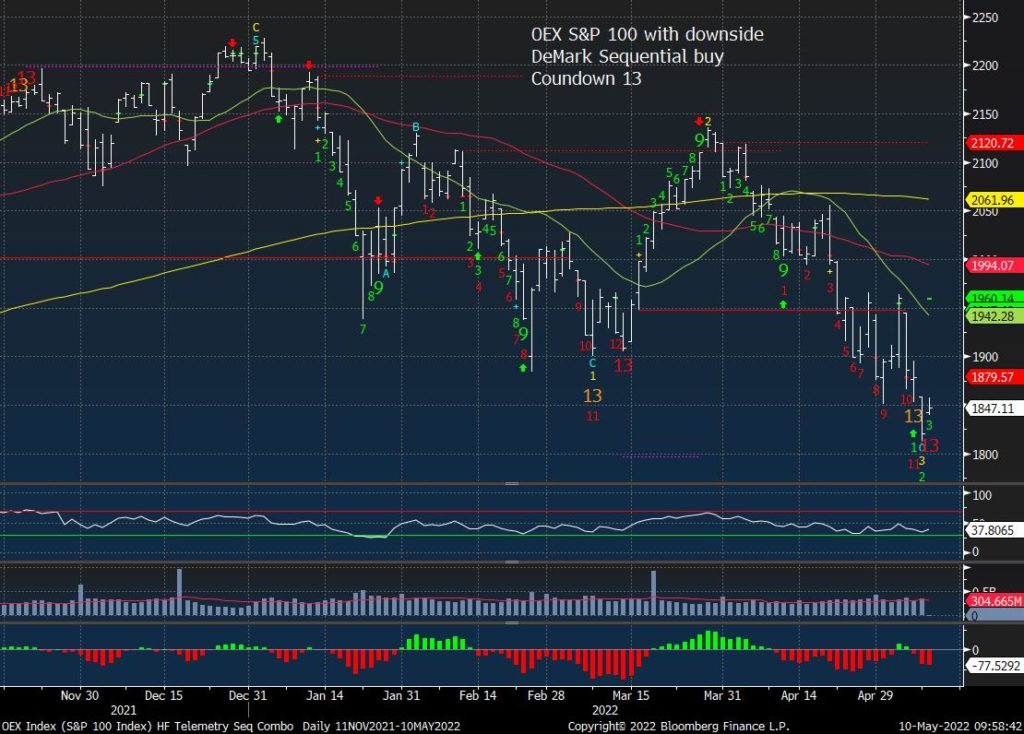
S&P 100 also with a new Sequential buy Countdown 13 a few days ahead of the S&P 500
Focus charts – internals
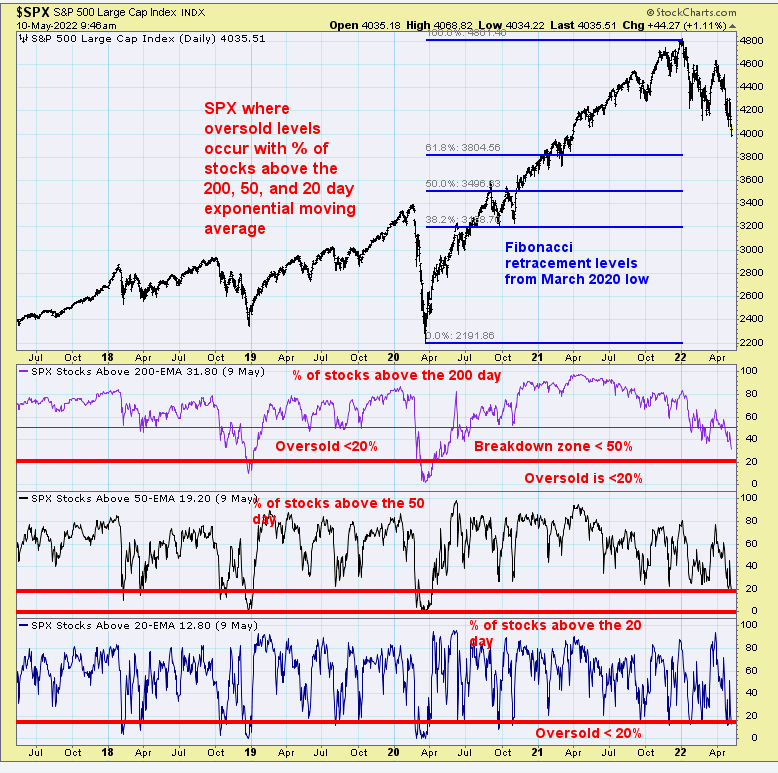
SPX percentage of stocks above the 20 and 50 day are really pretty simple indicators to see levels where bottoms occur. Both are at oversold levels however they can and might go even lower.
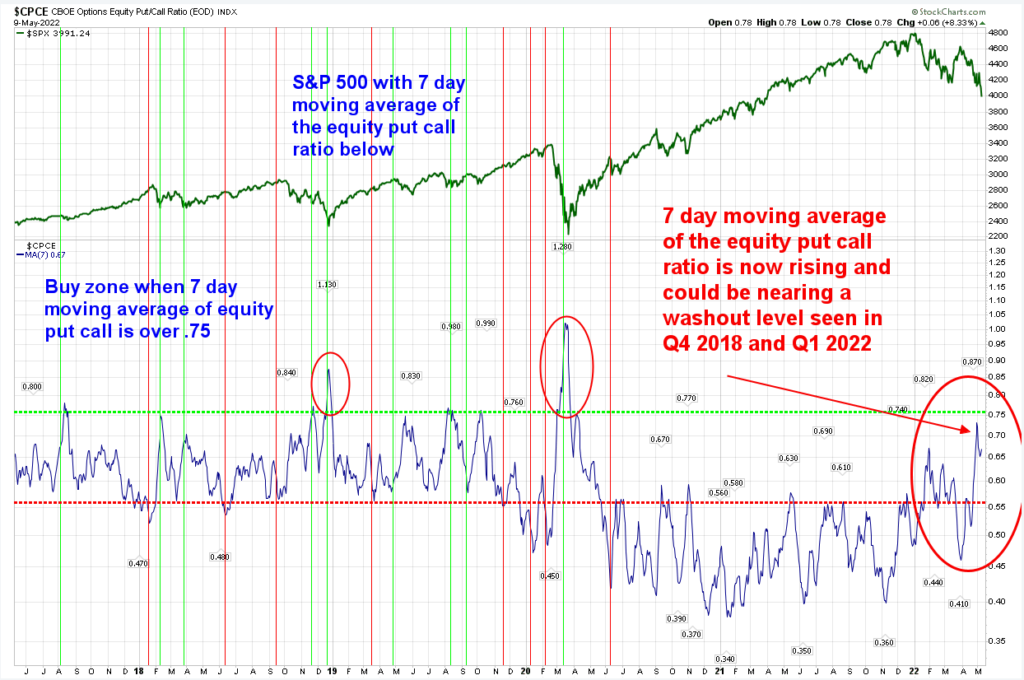
S&P 7 Day Moving Average of the Equity Put Call Ratio has spiked yet not at the Q4 2018 or Q1 2020 levels. Too many people still want to buy calls in my view. Look at this option flow I just got from a trader: TQQQ (triple levered QQQ) – over 80k calls on the tape (most expiring this Fri)
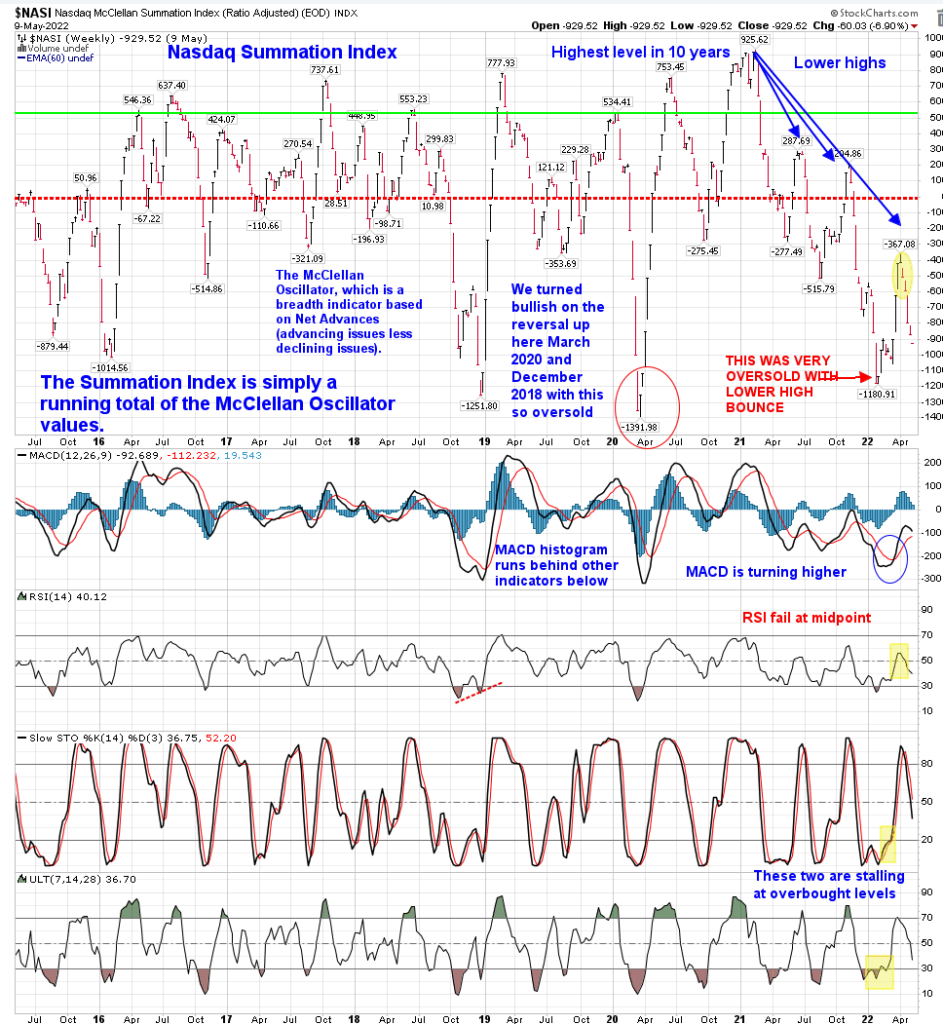
Nasdaq Summation Index weekly continues to tick lower this week. The momentum indicators are not oversold
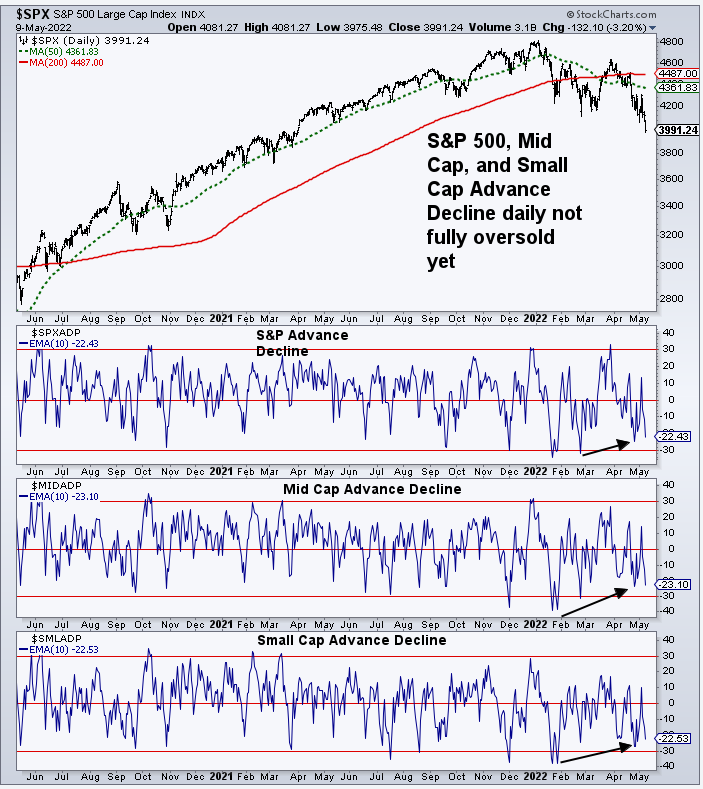
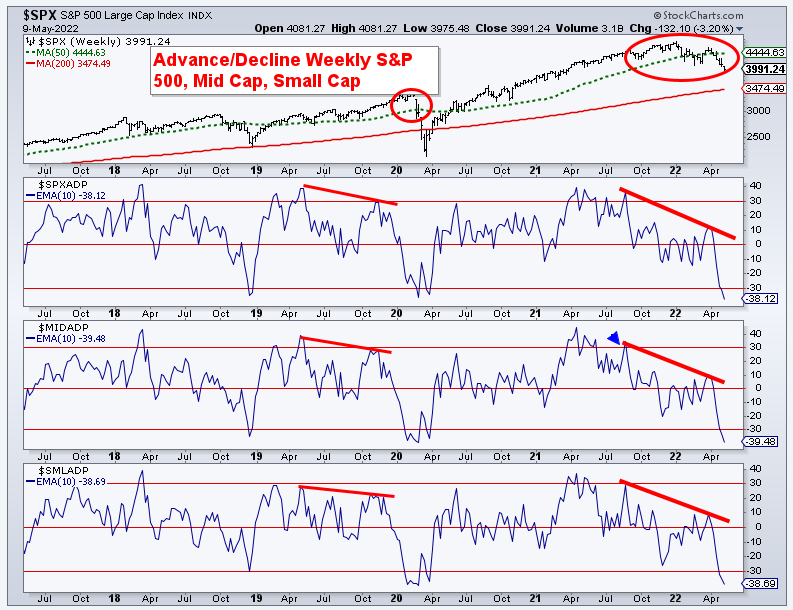
S&P 500 Mid and Small Cap advance-decline daily is not quite oversold enough
However the weekly levels are oversold
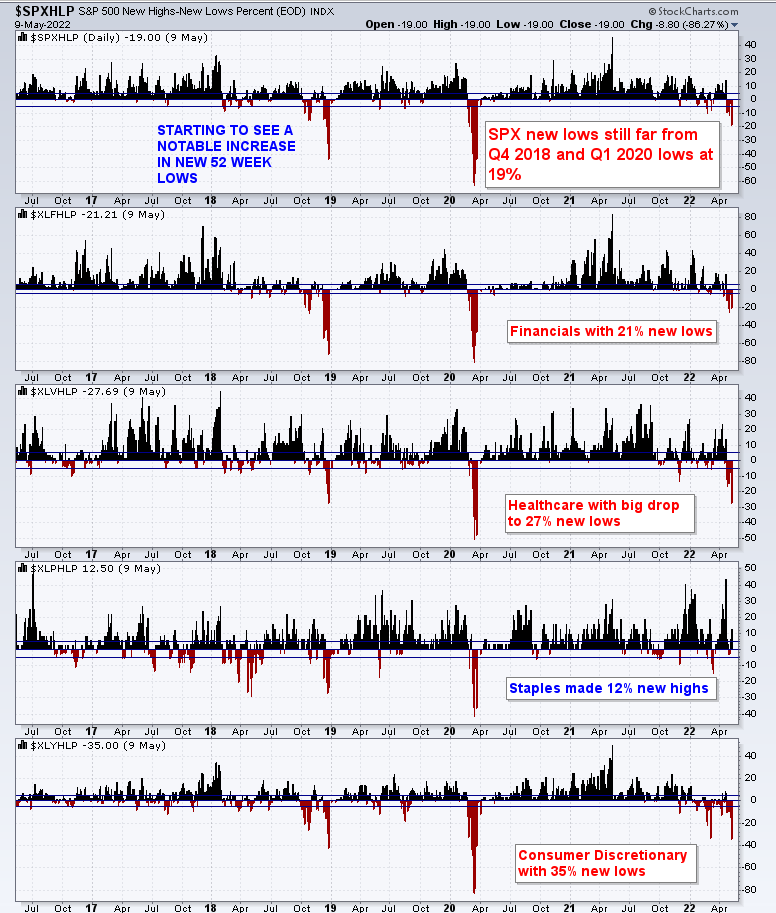
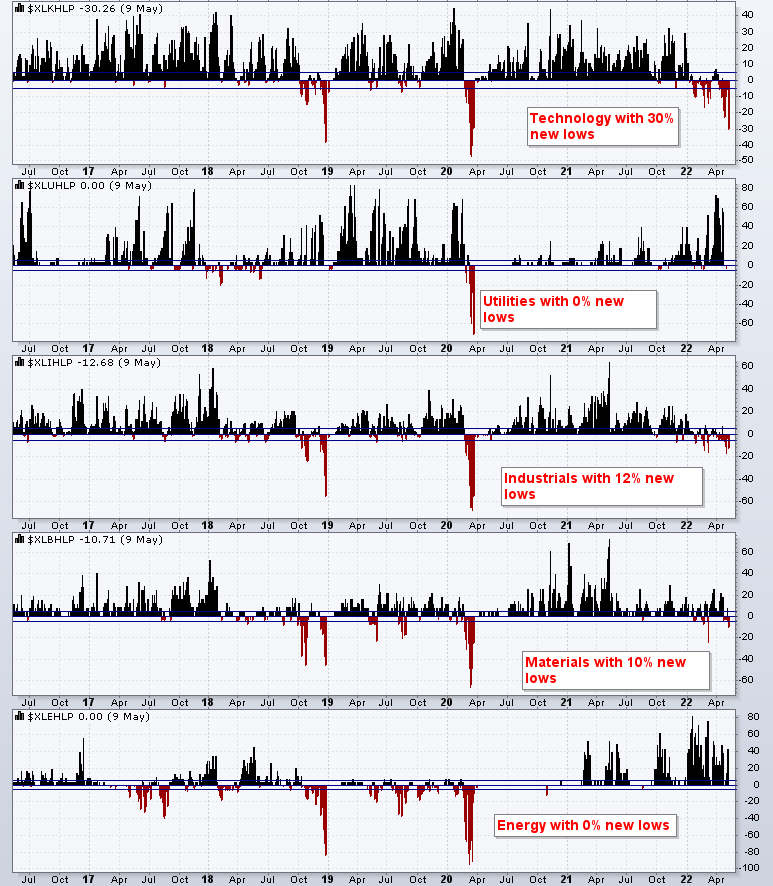
SPX New Lows has started to increase from the last time I showed this chart. Still not at Q4 2018 or Q1 2020 levels. New lows could spike really quickly
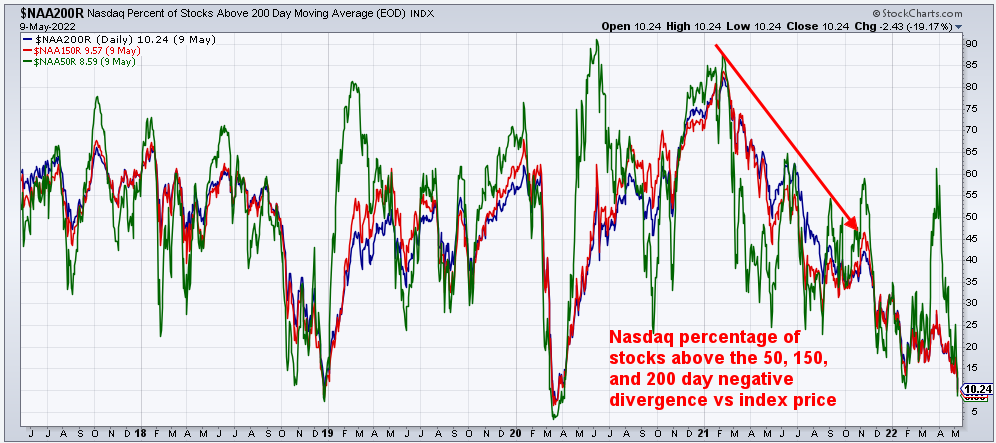
Nasdaq Percent of Stocks above 200 day moving average has been and continues to be very oversold
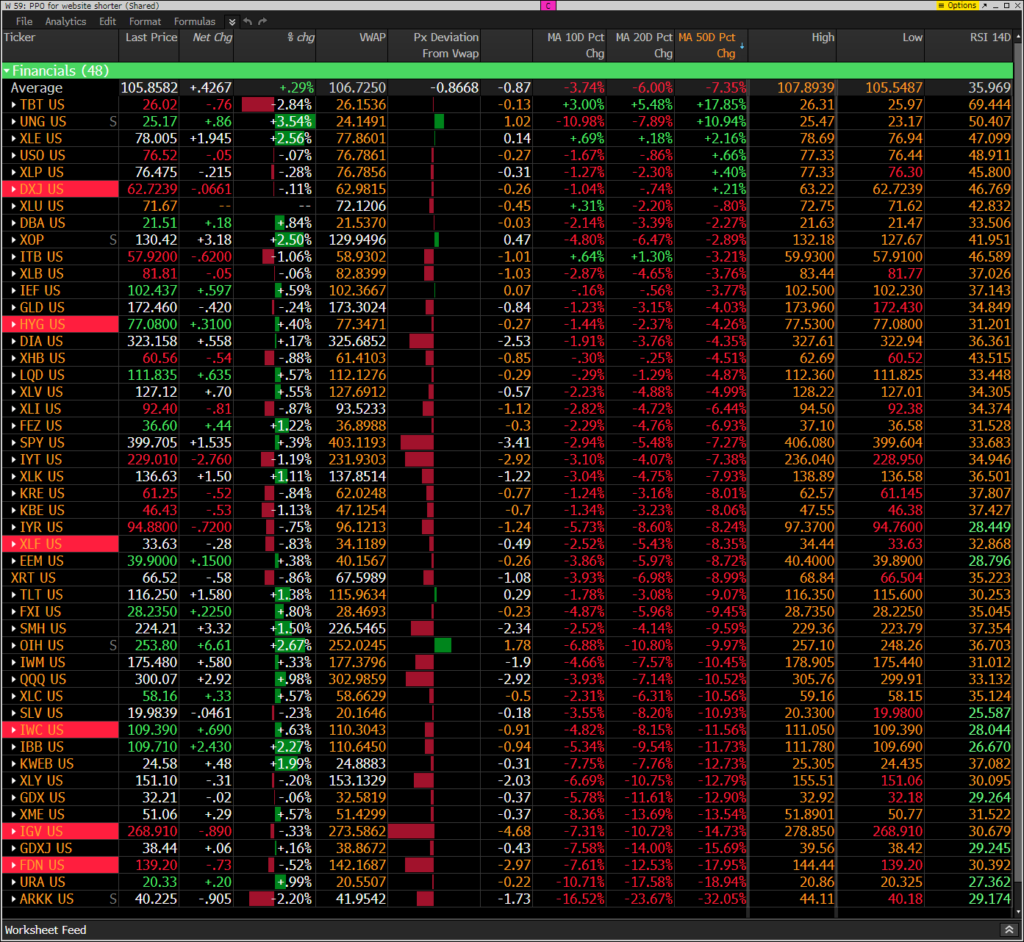
Hedge Fund Telemetry ETF Percentage Price Oscillator Monitor
The PPO monitor (percentage price oscillator) force ranks ETFs by percentage above/below the 50-day moving average. For information on this monitor please refer to this primer. This monitor is offered to Hedge Fund Telemetry subscribers who are on Bloomberg. I post often on Twitter this monitor in the mornings shortly after the open and I noticed most things up however most were below today’s VWAP – a sign of underlying selling while everyone was watching the “green up day”
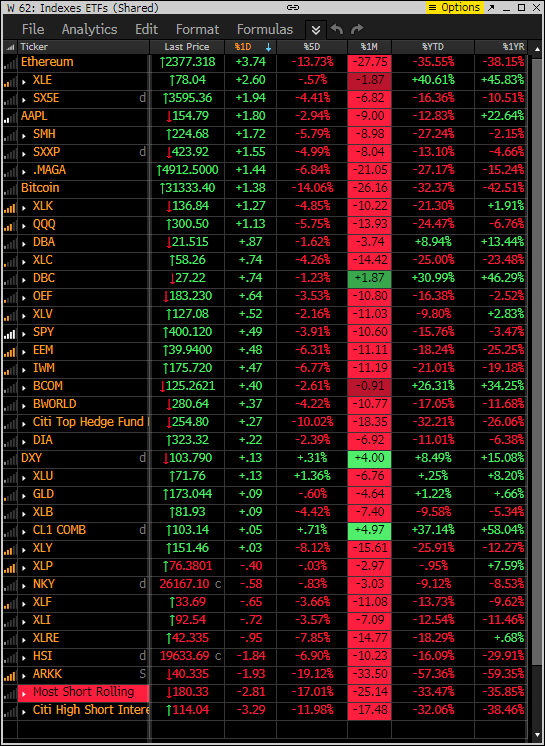
Index ETF and select factor performance
This ranks today’s performance and has 5-day, 1-month, and 1-year rolling performance as well YTD. Seeing risk on assets leading today.
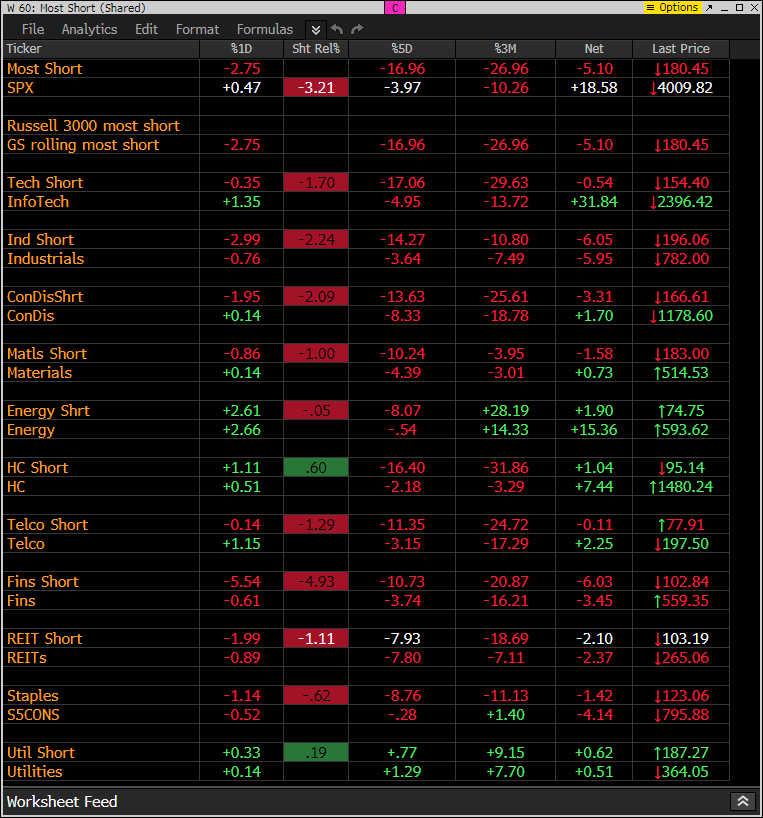
Goldman Sachs Most Shorted baskets vs S&P Indexes
This is the monitor that has the S&P indexes and the Goldman Sachs most shorted baskets. Today the short baskets are down ex energy and health care. Look at the last 5 day and 3 month performance between most short and SPX.
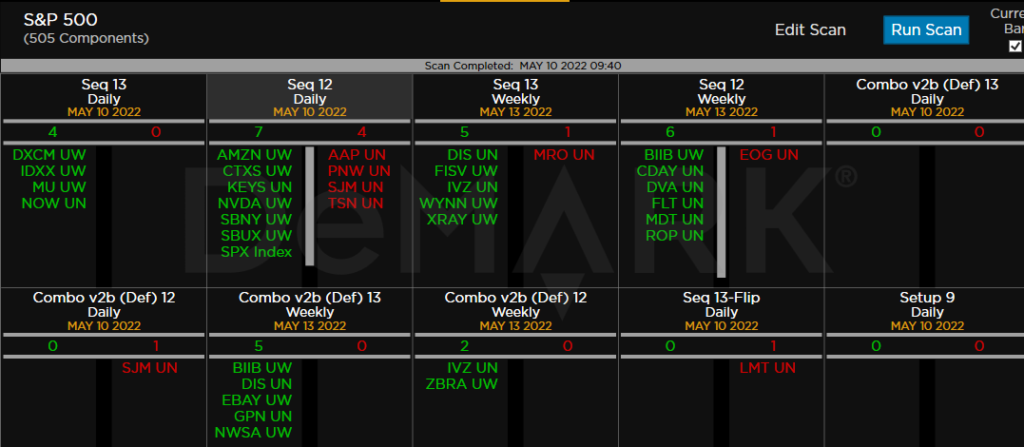
DeMark Observations
Within the S&P the DeMark Sequential and Combo Countdown 13’s and 12/13’s on daily and weekly time periods. For information on how to use the DeMark Observations please refer to this primer. The extra letters at the end of the symbols are just a Bloomberg thing. Worth noting: Lot’s of buy Countdown 13’s developing. Make a list of some of these ideas.
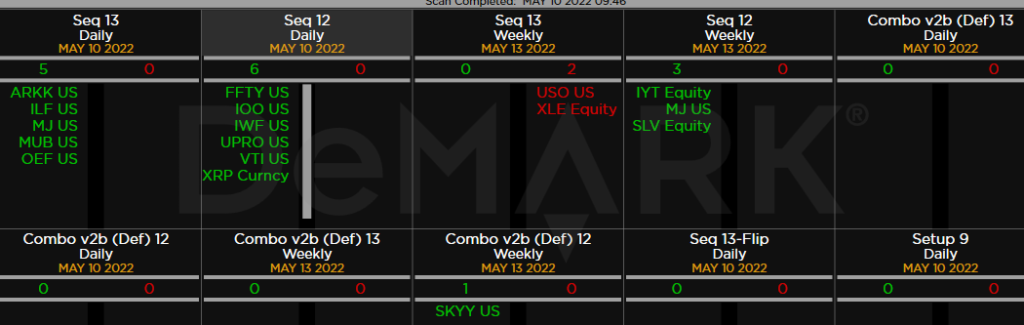
Major ETFs among a 160+ ETF universe.
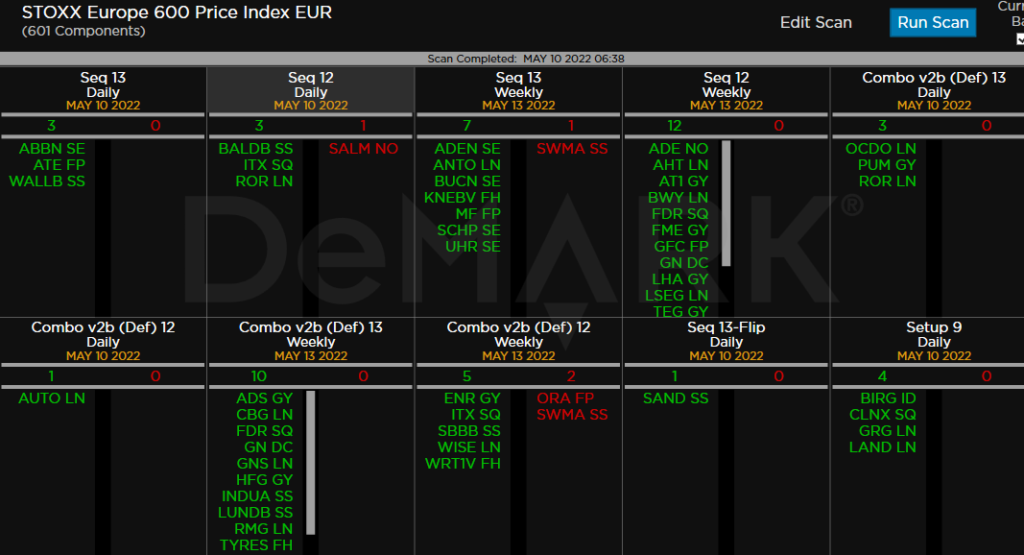
Euro Stoxx 600
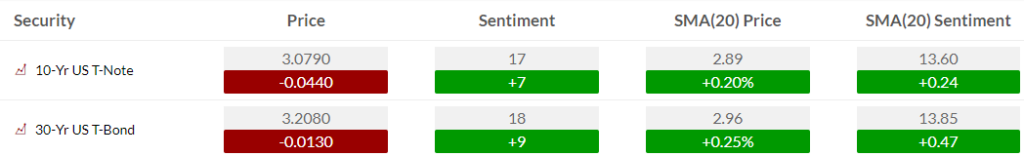
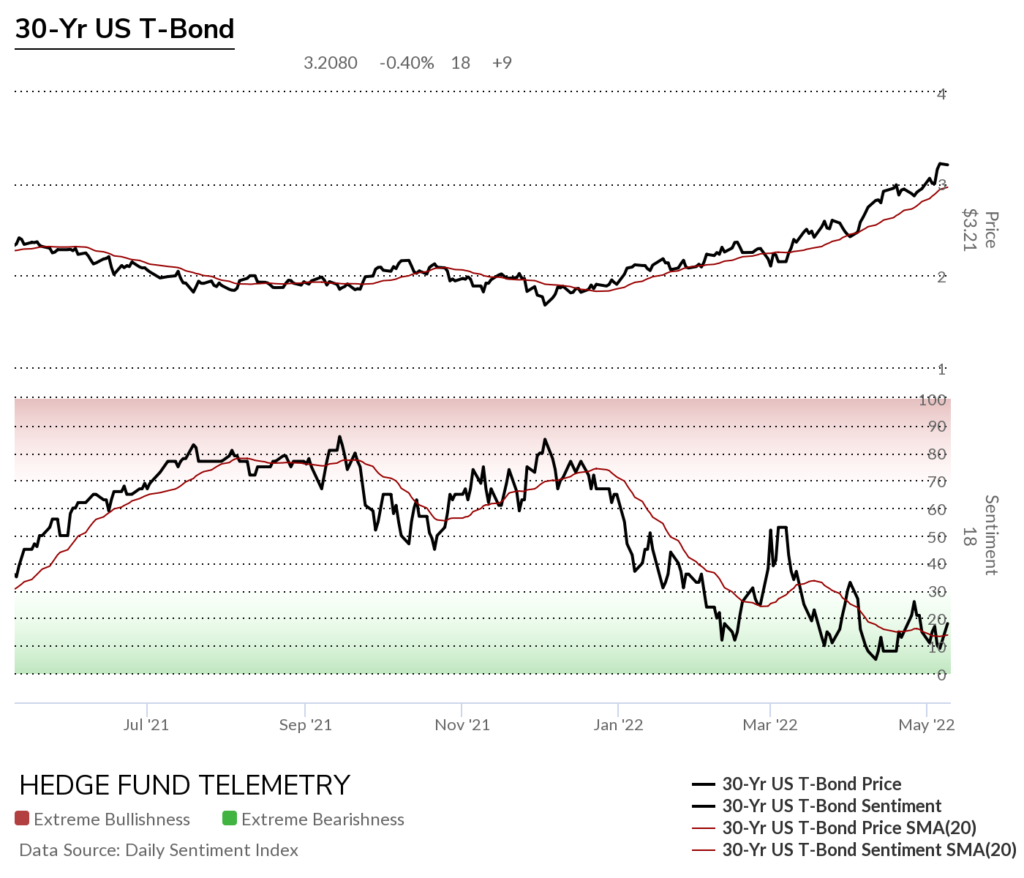
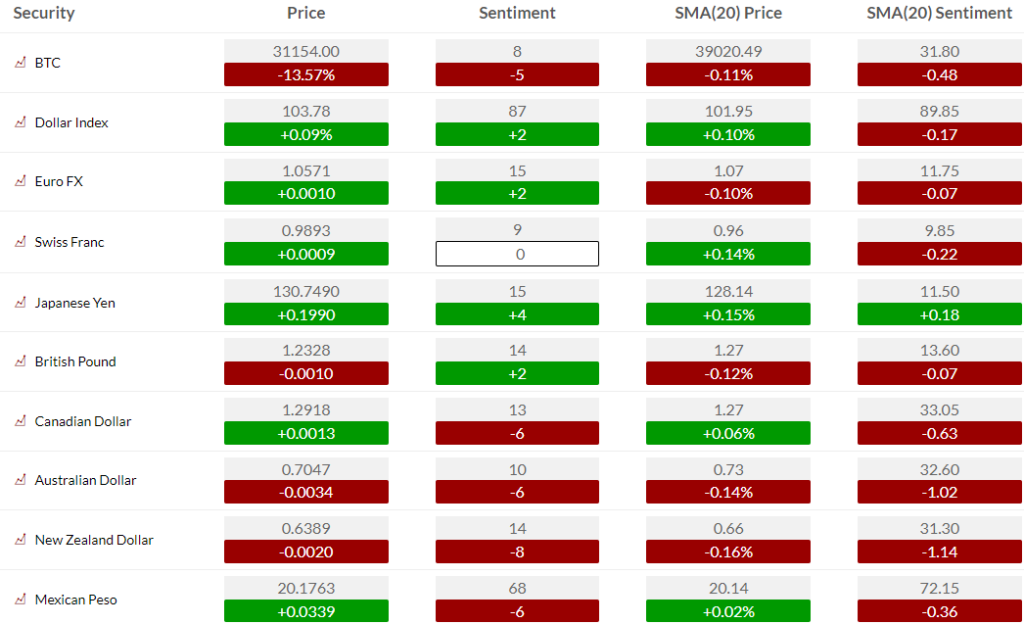
Bond, Currency, and Commodity Bullish Sentiment
Bond bullish sentiment bounced big time but still needs to prove a trend change as you see on the chart below
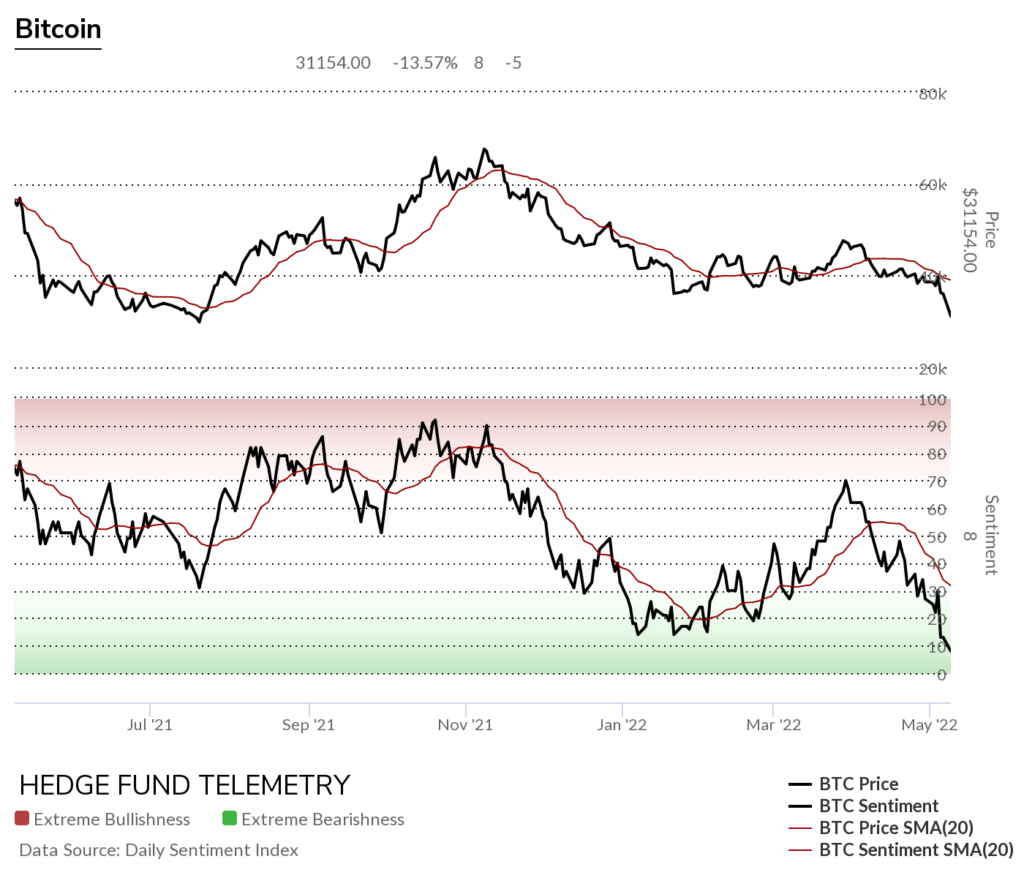
Currency bullish sentiment shows Bitcoin bullish sentiment at the lowest level since I started posting it 2 years ago
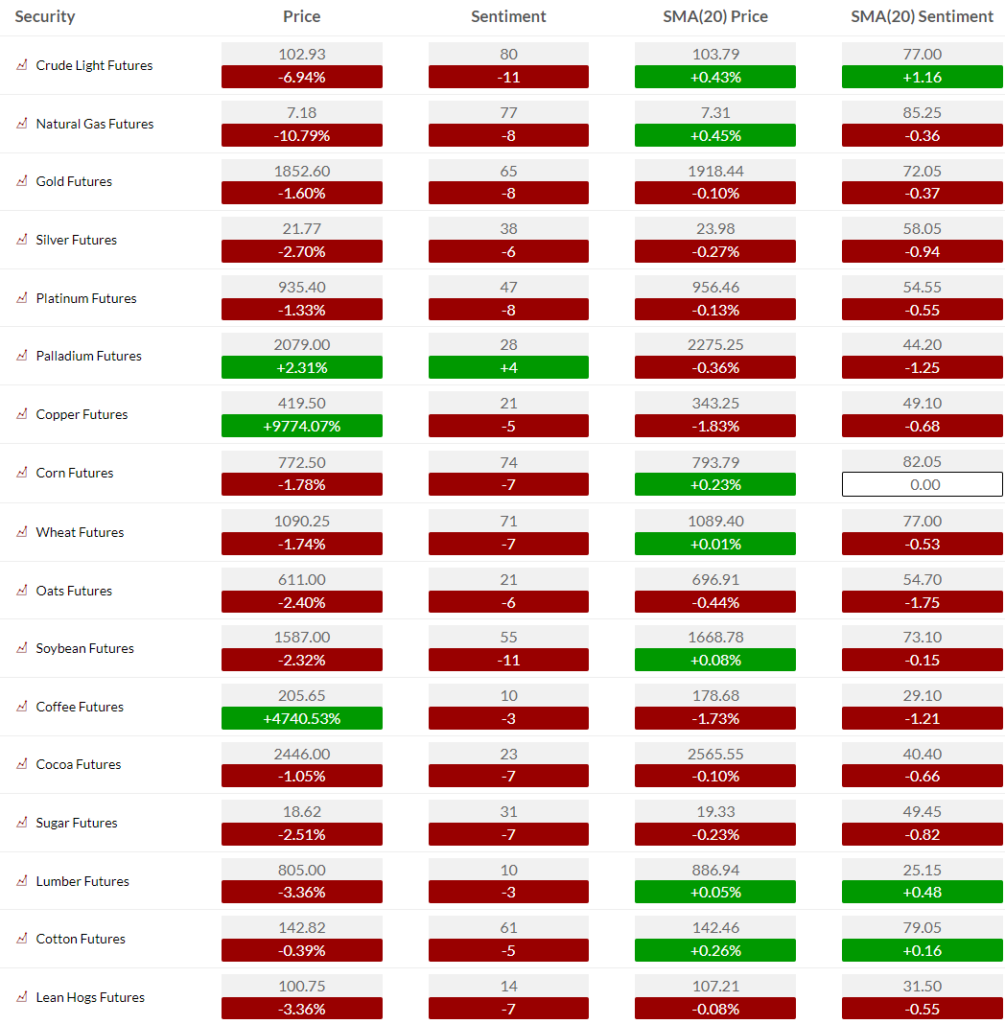
Commodity bullish sentiment
If you have any questions or comments please email us. Data sources: Bloomberg, DeMark Analytics, Goldman Sachs, Street Account, Vital Knowledge, Daily Sentiment Index, and Erlanger Research