
Quick Market Views
Stocks: As mentioned yesterday, I believed there would be a pullback when using the 60-minute tactical charts. I took gains with a few long ideas, including SPY, QQQ, and IWM, and will be looking for new entry spots. I want to be patient because there are a lot of unknowns and potentially negative catalysts in the next few days. Earnings warnings still loom tomorrow’s jobs data should spark a move either up or down. If the NFP is under consensus at 268k then the market could rally. I am concerned that the number could be inline or higher based on the recent strong claims numbers. A lot of risk remains around Elon Musk and Tesla. See below.
Bonds: Rates are higher today with the majority of the strength with the 10 year up 13bps.
Commodities: Energy remains bid with the OPEC 2 million barrel cut and a large draw reported with inventories. I had some levels on WTI crude posted on First Call to watch on the upside.
Currencies: The US dollar is up again thanks to the risk off overall market sentiment. Crypto is under pressure with Bitcoin in a tight range.
Desk comments: GS Desk Activity:
A little over 1hr into the trading sessions and we are seeing LOs and HFs skewed better for sale 1.06x & 1.03x respectively. On the pad we are seeing elevated short activity from HFs with short sales making up roughly 55% of their sell activity.
Yesterday’s biggest winners are today’s biggest losers with our most short basket (GSCBMSAL) down 512bps & non profitable tech down down 467 bps. ETF % of tape = 38% of tape (vs 33% YTD avg).
In terms of factors we are seeing sellers of growth & buyers of value while momentum remains flat. Across the board we are most active across TMT & Consumer names skewed better for sale , volumes down 18% vs yday
Trade Ideas Sheet: I am going to take off C (Citi) long +0.2%. I didn’t like a comment from a sell-side report today and can revisit it. I am going to add JWN Nordstrom back as a long idea with a 2% long position. I will post the chart later.
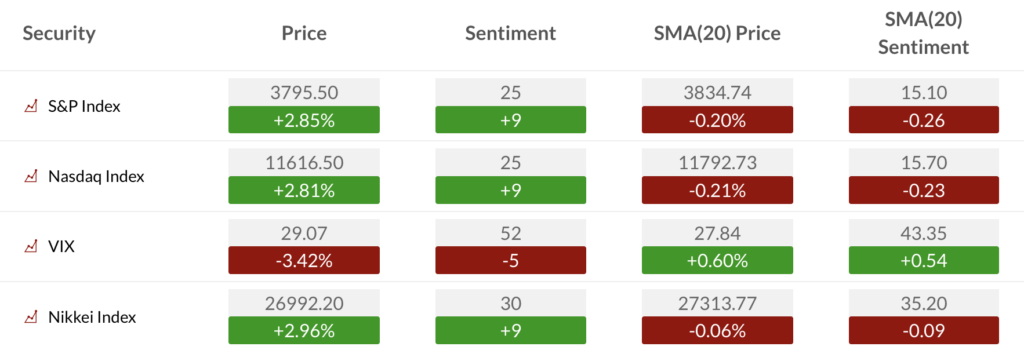
US Market Indexes and Sentiment
Here is a primer on how we use Daily Sentiment Index charts. Lower on this note is bond, currency, and commodity sentiment.
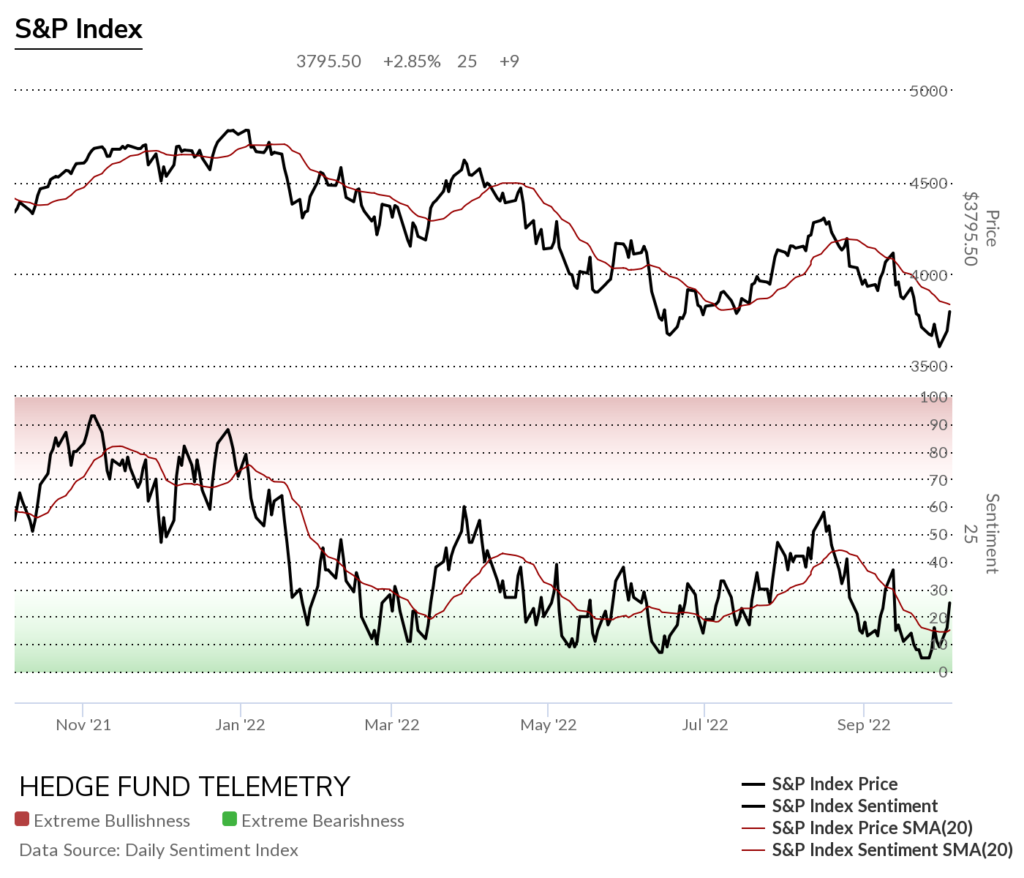
S&P bullish sentiment and Nasdaq bullish sentiment bounced significantly yesterday and is over the 20-day moving average of bullish sentiment. Expect a pullback today with today’s weakness but watch the 15 level as support
S&P bullish sentiment with a decent move off the 5% recent low. This 5% low was the lowest level since March 2020
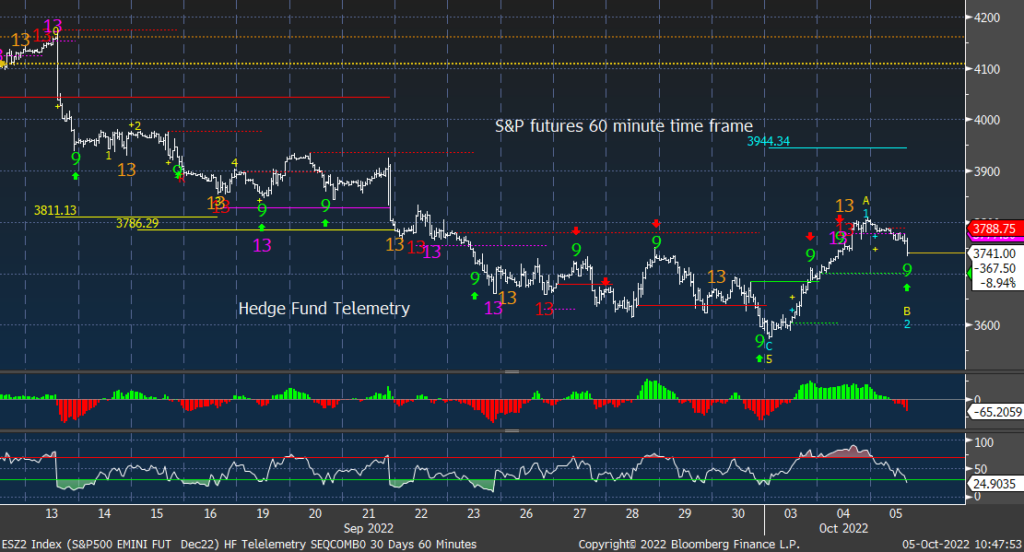
Here is a primer on the DeMark Setup and Sequential indicators.
S&P futures 60-minute time frame backed off with the Sequential and Combo sell Countdown 13’s yesterday. Now with a new buy Setup 9. It’s going to need to hold here
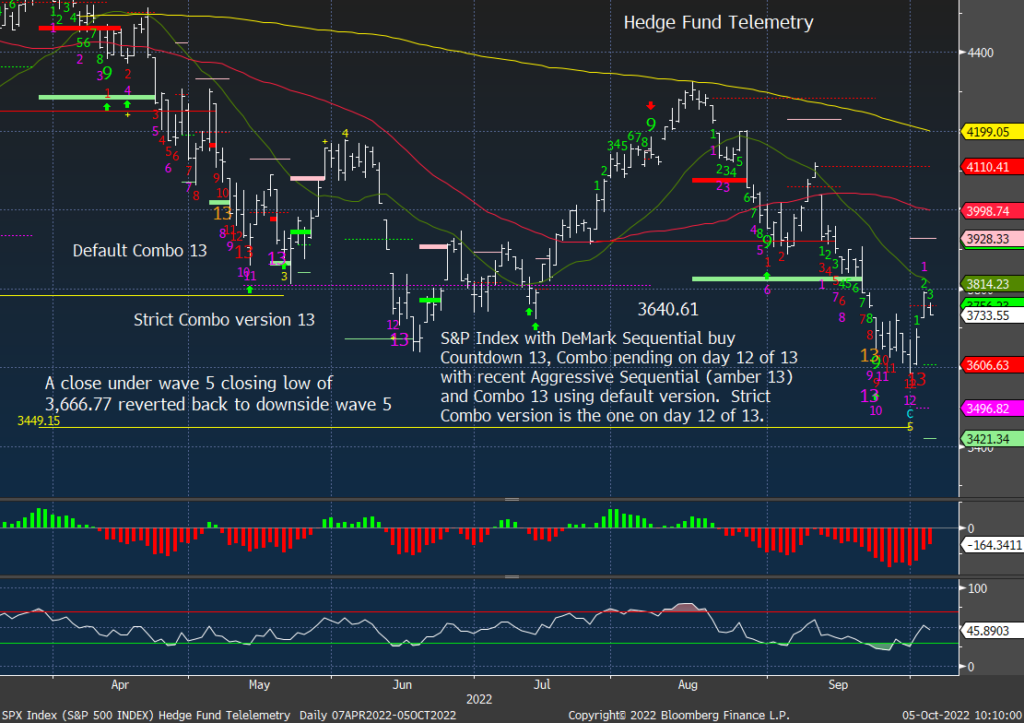
S&P 500 Index daily is backing off after the last two big up days. Stalling at the 20 day.
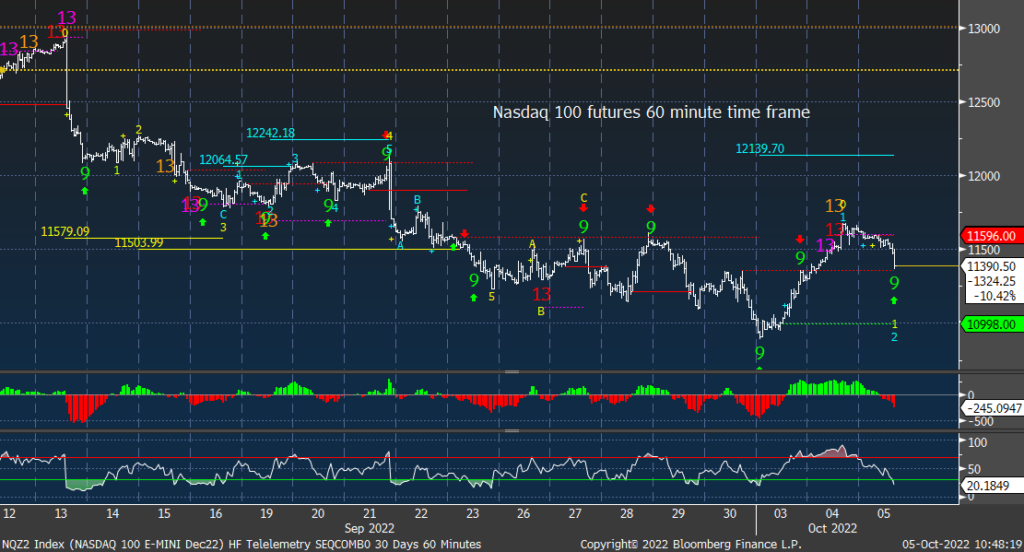
Nasdaq 100 futures 60-minute time frame backed off with the Sequential and Combo sell Countdown 13’s yesterday. Now with buy Setup 9. It’s going to need to hold here
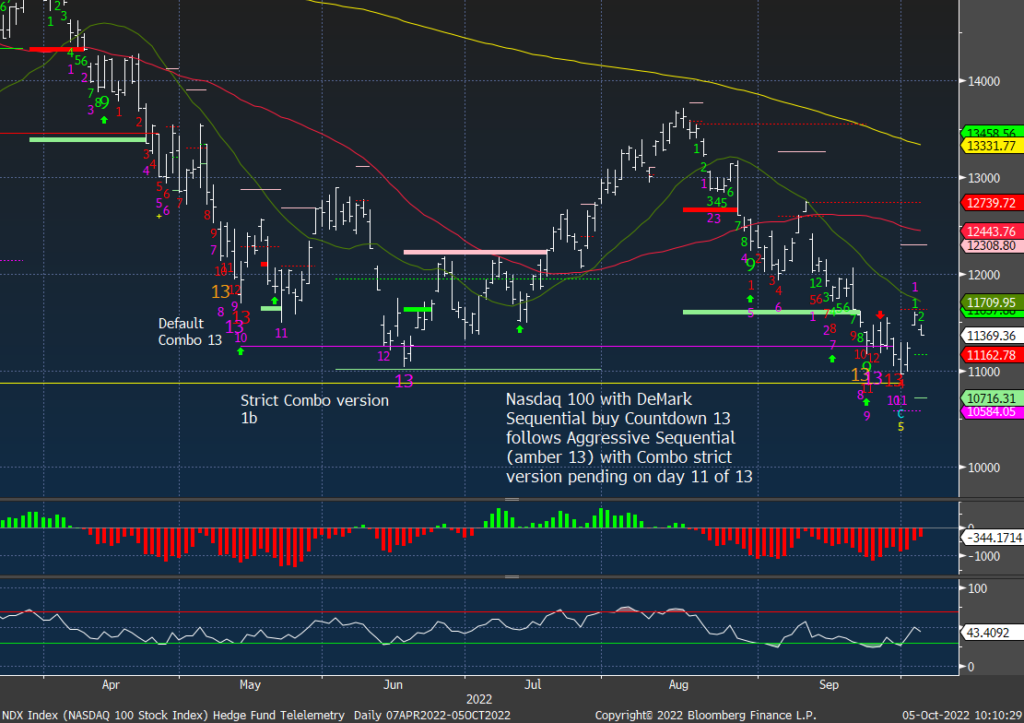
Nasdaq 100 Index daily backing off the strong two-day gain. RSI stalled again at 50. A rise above 50 would add to my conviction
Trade ideas – elon’s wake
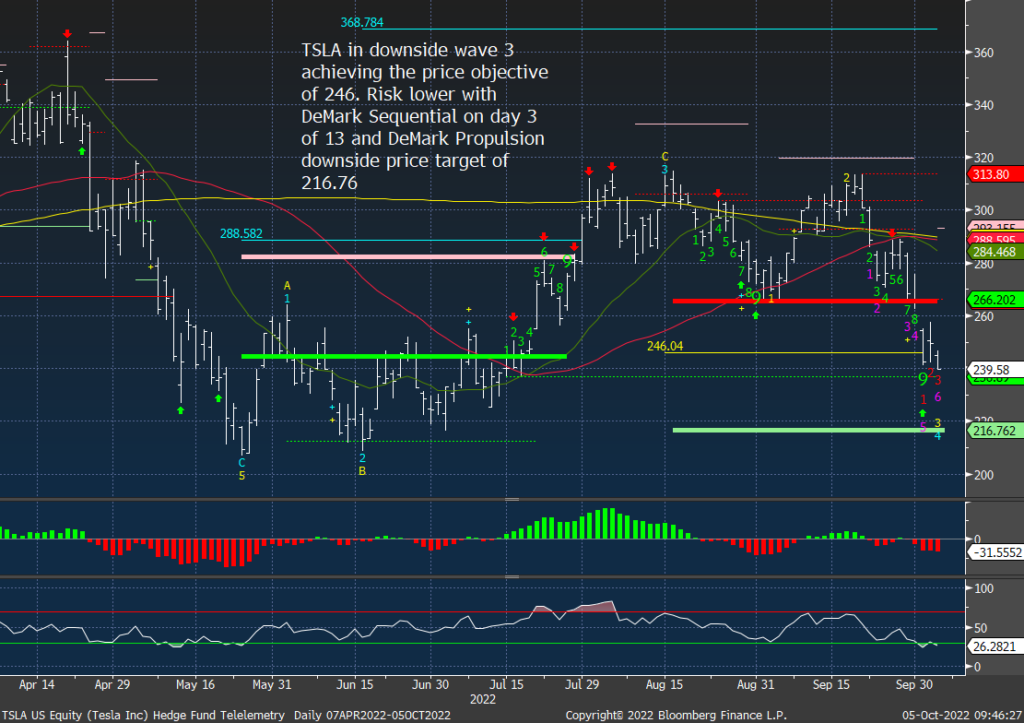
TSLA remains a core short idea and now has a DeMark Sequential Countdown on day 3 of 13, continuing the trend lower with a Propulsion target of 216. Have fun with Twitter, Elon.
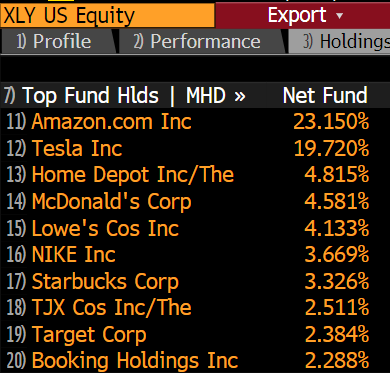
I’ve been short XLY too with the Sequential still in progress
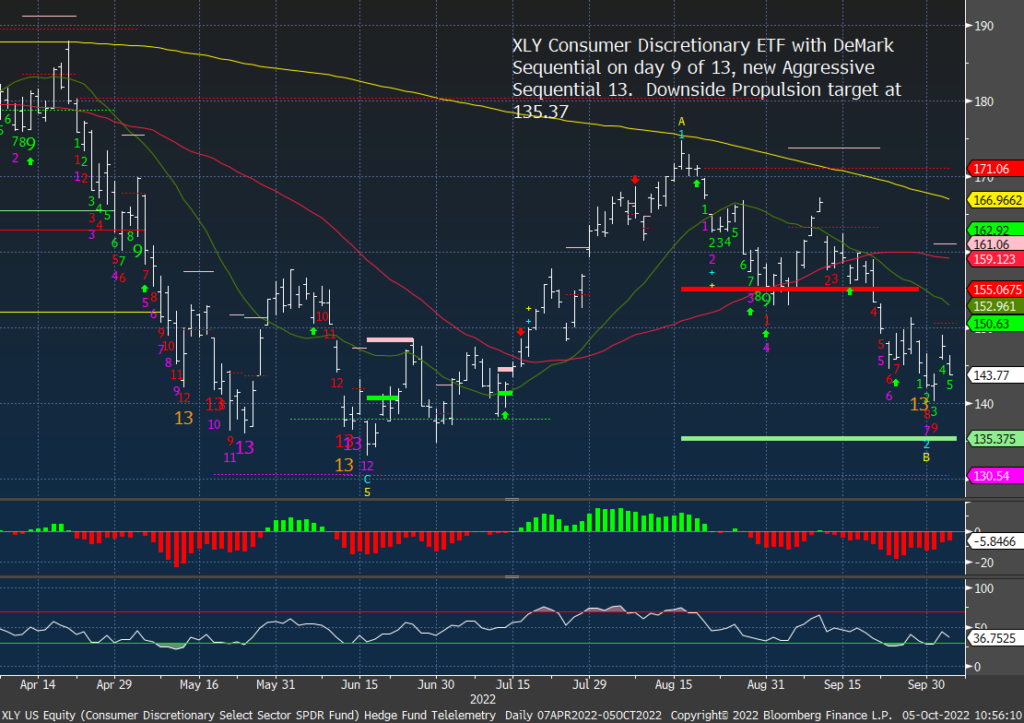
Another reason I am short XLY is Tesla is 20% of the Consumer Discretionary ETF
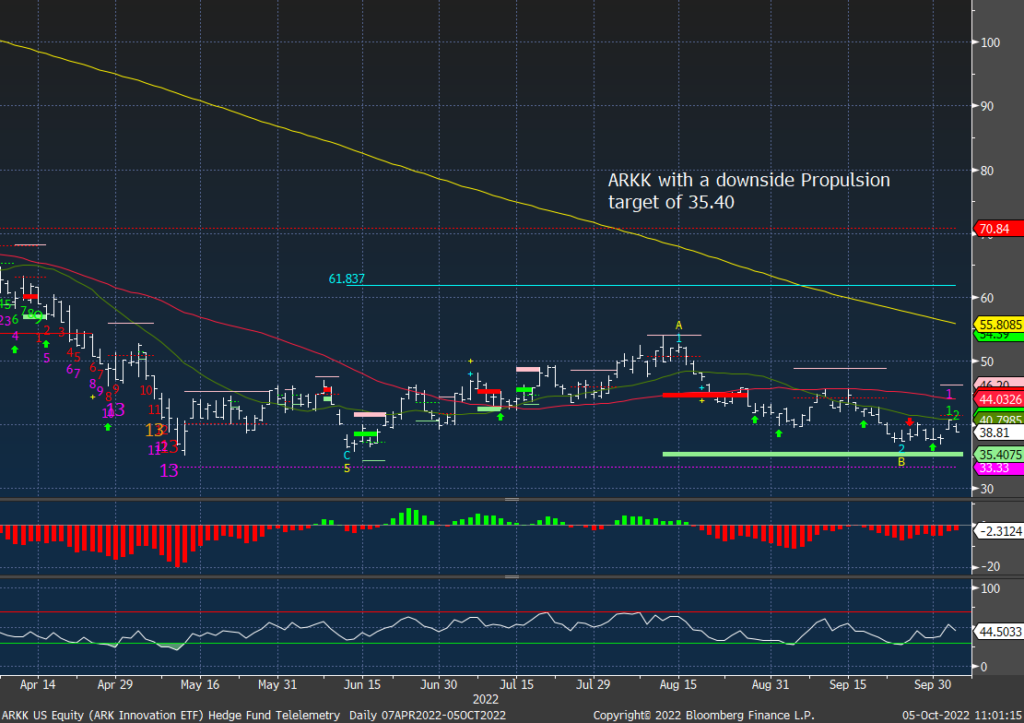
I remain short ARKK, although not with the weighting I had when I put it on above 50. Cathie Wood and her team have purchased more Tesla shares. 350k shares in the last 30 day and 275k shares in the last 7 days.
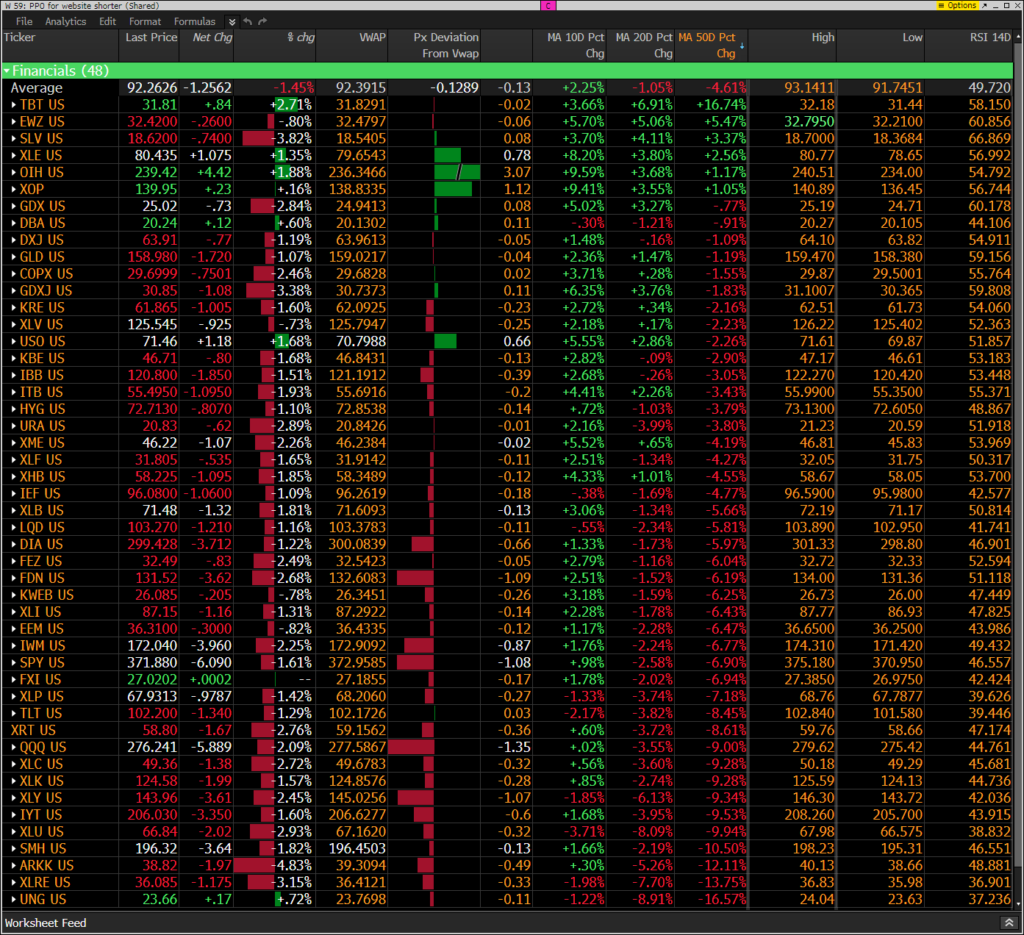
Hedge Fund Telemetry ETF Percentage Price Oscillator Monitor
The PPO monitor (percentage price oscillator) force ranks ETFs by percentage above/below the 50-day moving average. For information on this monitor please refer to this primer. This monitor is offered to Hedge Fund Telemetry subscribers who are on Bloomberg. A mostly solid red day except for energy which we have some long exposure on the long side. Seeing many now above the 10 day is a good start with some more upside needed to clear the 20 day.
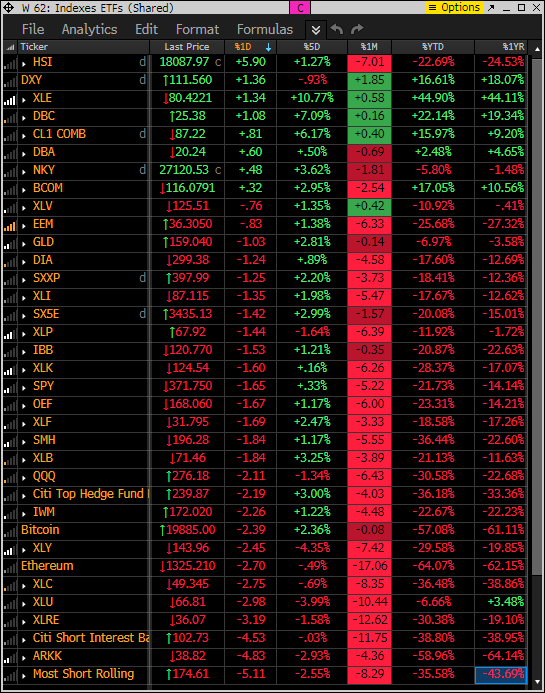
Index ETF and select factor performance
This ranks today’s performance with 5-day, 1-month, and 1-year rolling performance YTD. Short baskets are down the most today along with ARKK
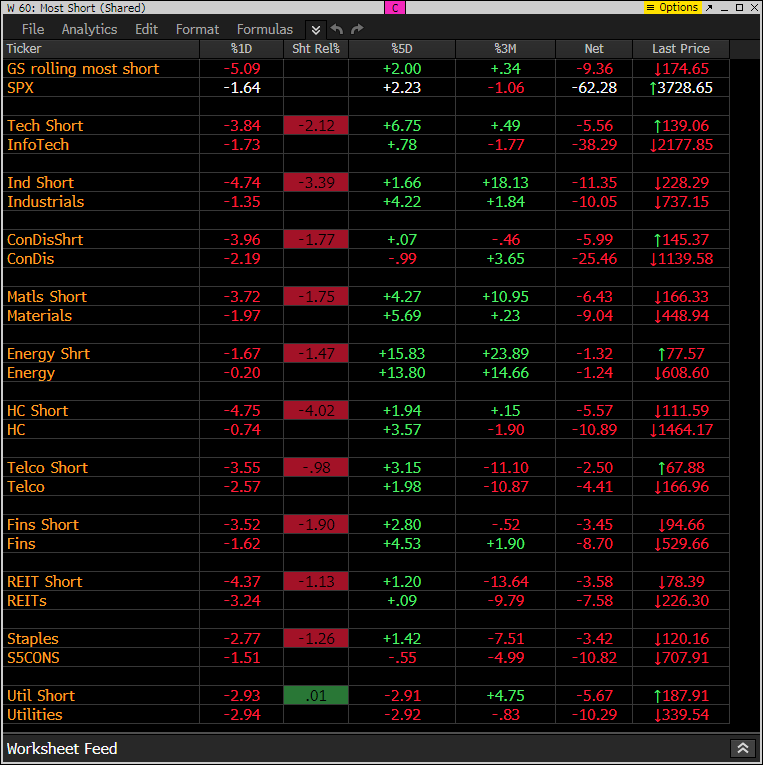
Goldman Sachs Most Shorted baskets vs S&P Indexes
This monitor has the S&P indexes and the Goldman Sachs most shorted baskets. Today the shorts are pressing lower.
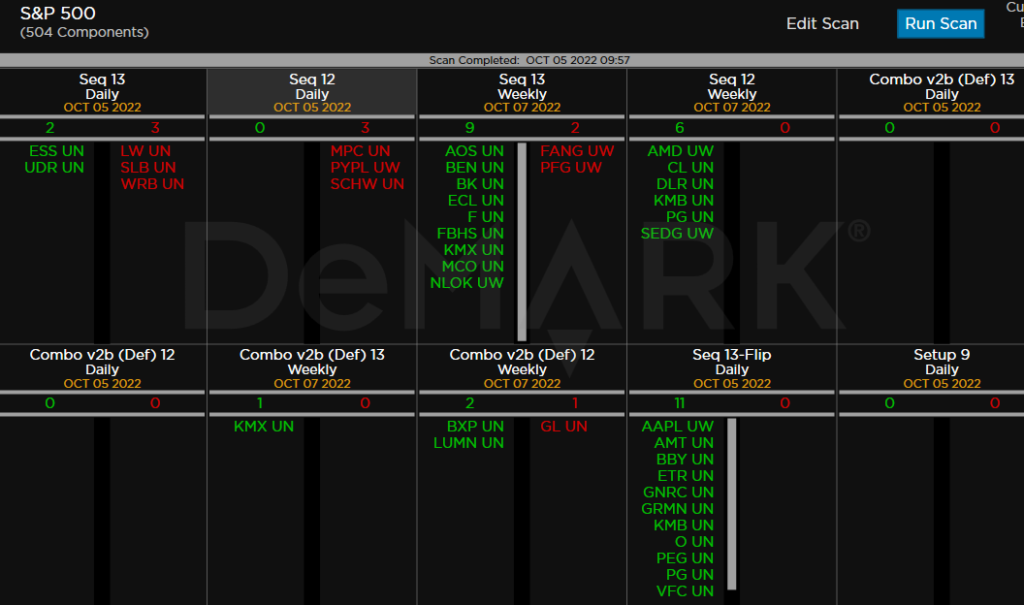
DeMark Observations
Within the S&P the DeMark Sequential and Combo Countdown 13’s and 12/13’s on daily and weekly time periods. For information on how to use the DeMark Observations please refer to this primer. The extra letters at the end of the symbols are just a Bloomberg thing. Worth noting: It’s a little quieter vs the last few weeks when we had a lot of buy Countdown 13’s
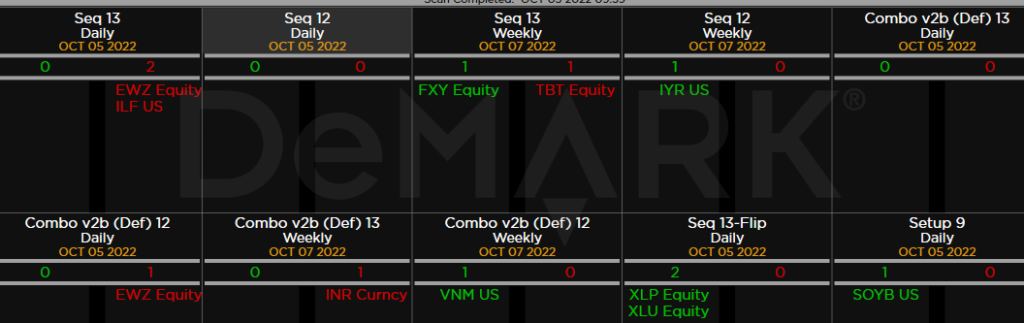
Major ETFs among a 160+ ETF universe.
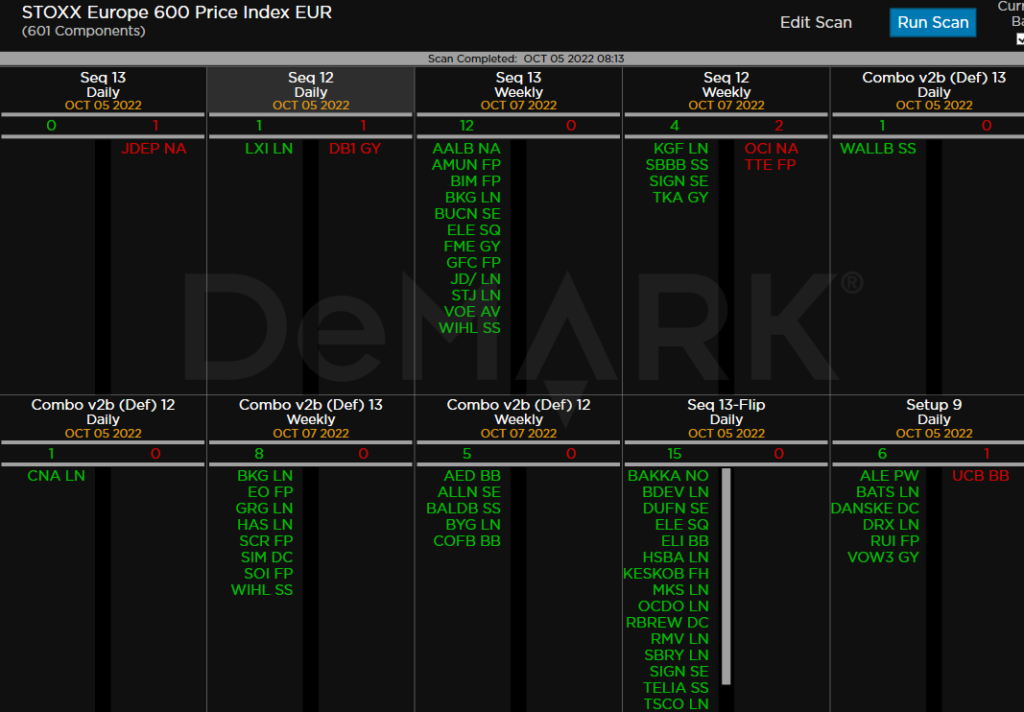
Euro Stoxx 600
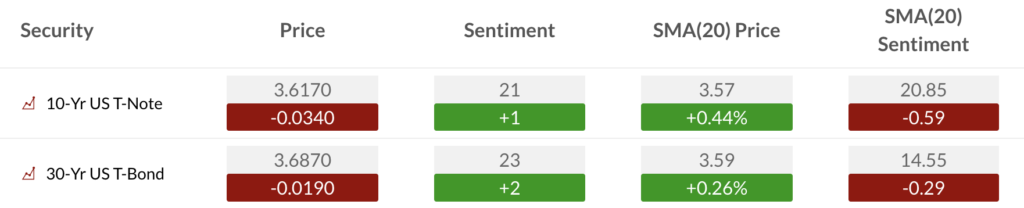
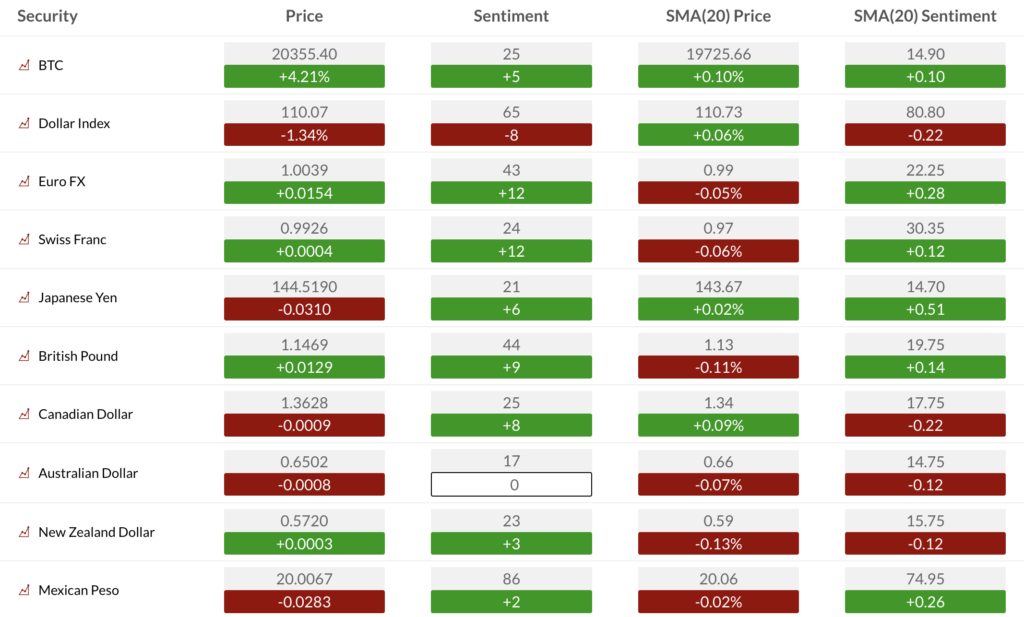
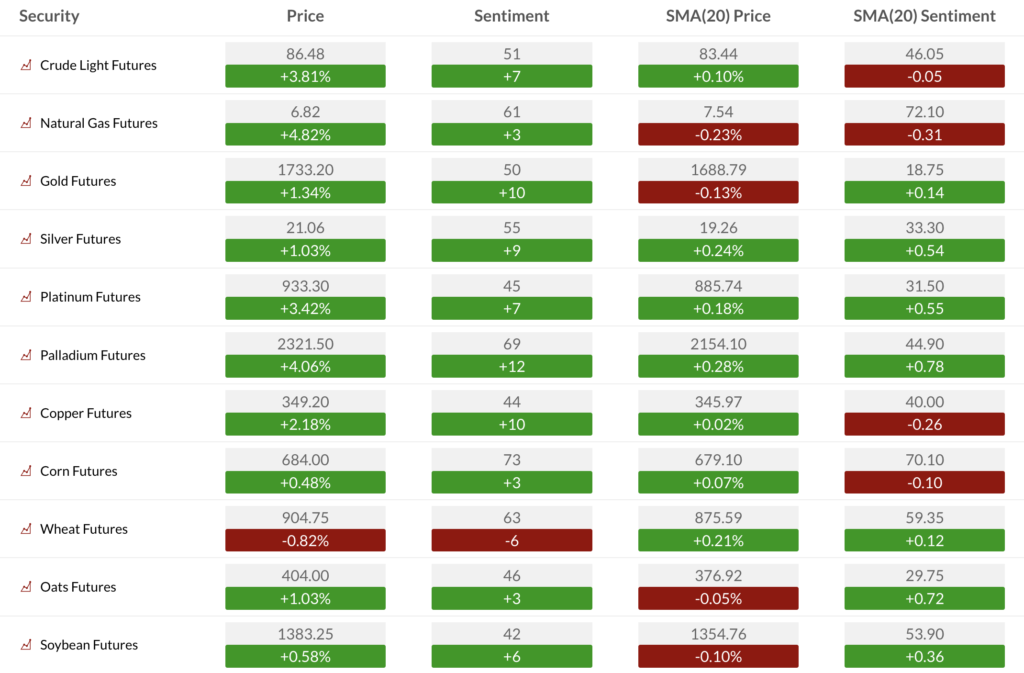
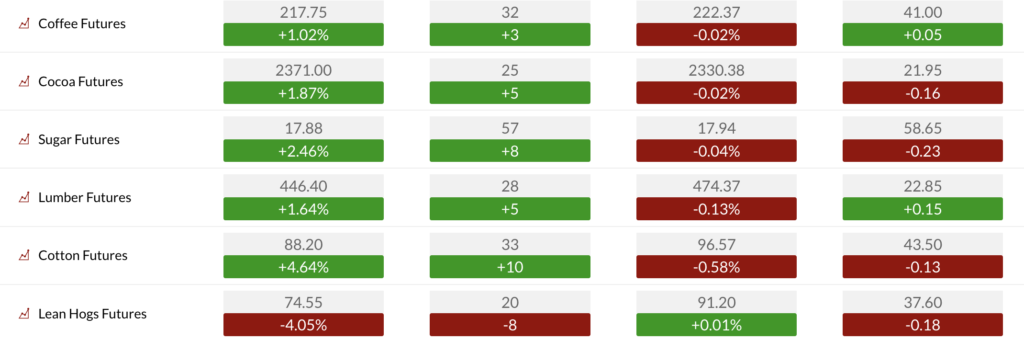
Bond, Currency, and Commodity Bullish Sentiment
Bond bullish sentiment
Currency bullish sentiment
Commodity bullish sentiment
If you have any questions or comments please email us. Data sources: Bloomberg, DeMark Analytics, Goldman Sachs, Street Account, Vital Knowledge, Daily Sentiment Index, and Erlanger Research