Quick Market Views
Stocks: The ISM Services data came out at 10am showing continued resistance within the Services sector. The data showed an uptick with employment to 54 from 50. New orders moved a little higher and prices paid dropped to 65.6 from 67.8. The markets have a way of focusing on the positive data as people pinged me about the drop on prices paid. The bond market, wagging the dog was rallying ahead of the report, rallied a little more and now might be selling off a little which could spook the equity market. Then again, the markets have been snapped and whipped around with the 0DTE options gamblers. The amount of calls bought early today was heavy, and if this starts to run out of steam, a late-day fade is possible with options dealers selling upside delta hedges. Internally breadth is good but not as supportive if things back off under today’s VWAP levels: SPY 400.40, QQQ 296.35.
Bonds: As mentioned above rates are starting to tick up off earlier lows. If this continues the overall equity market might take notice. The US 10 year yield is down 5bps at 4% and the 2 year yield is up 1bps to 4.89%
Commodities: Energy is up led by Natural Gas +2%. Metals are up about 0.5%. Coffee is down 2.5% and I am not yet back as a buyer after selling at well at the highs.
Currencies: The US Dollar is little changed. Overnight Bitcoin and crypto broke down with continued negative stories with Silvergate, Microstrategy, Binance, etc
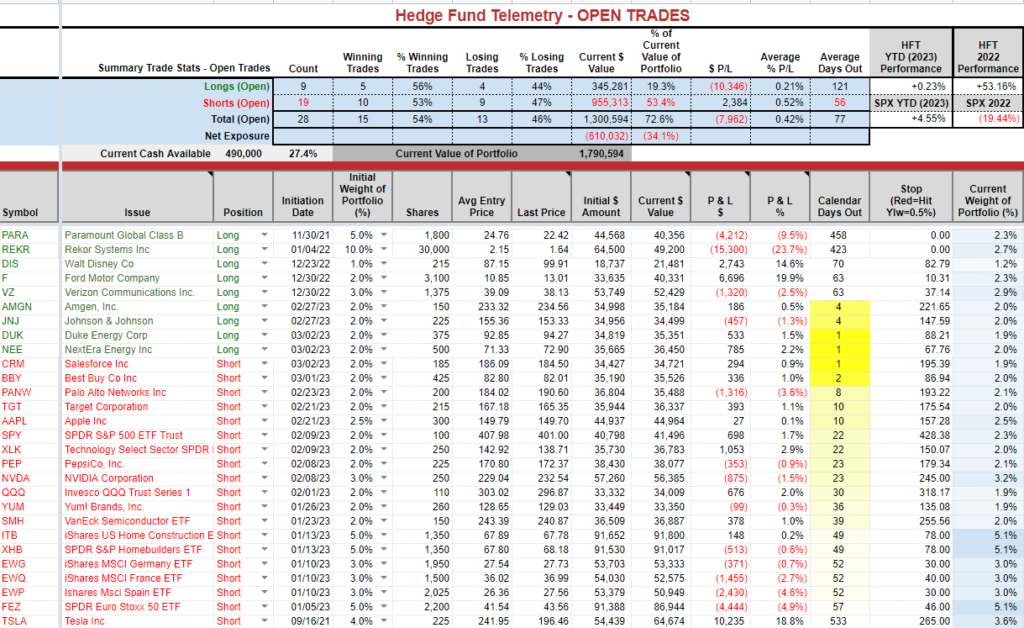
Trade Ideas Sheet: Still net short: 34%, with a large cash allocation of +27%. This reflects my cautious bias overall in Q1.
Changes: Nothing new. Perhaps on the late note
Thoughts: Let’s see if those VWAP levels above break or hold.
I have some great charts looking back at the history of the “soft landing” narrative and some good charts from Bank of America’s Harnett.
US Market Indexes and Sentiment
Here is a primer on how we use Daily Sentiment Index charts. Bond, currency, and commodity sentiment are posted on the website.
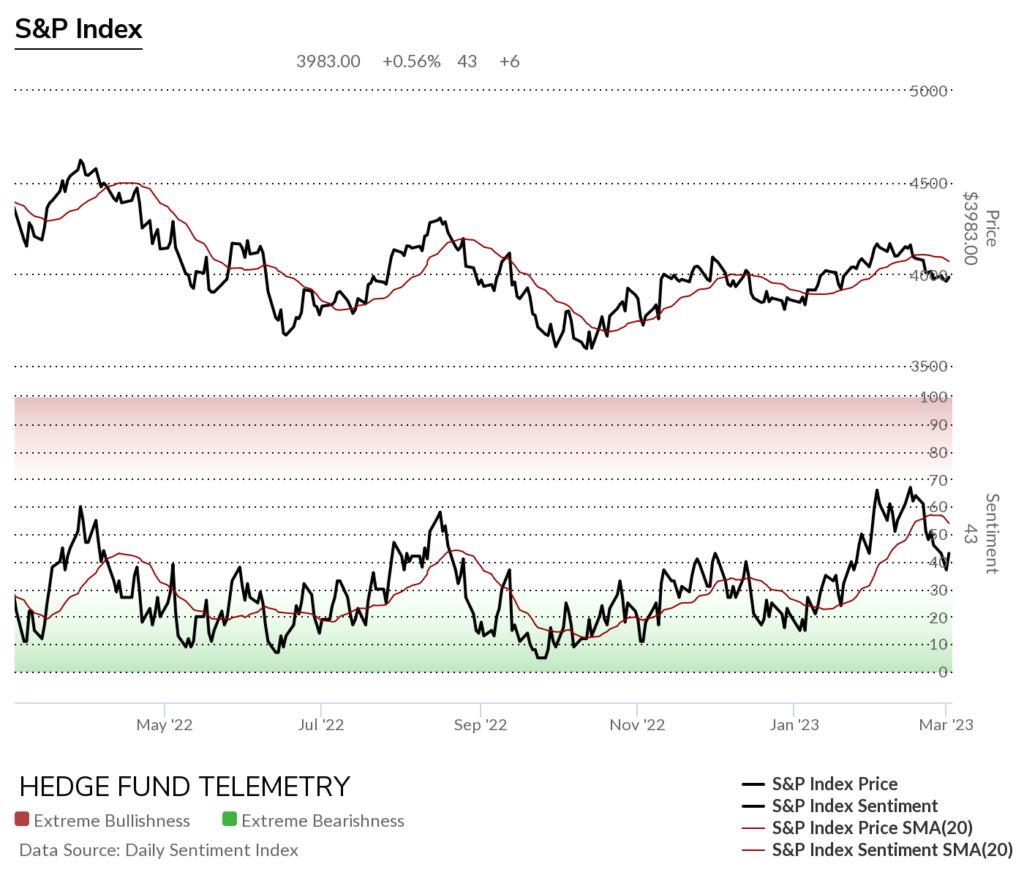
S&P bullish sentiment and Nasdaq bullish sentiment bounced after a recent decline.

S&P bullish sentiment shows the downward sloping 20 day moving average of bullish sentiment.
Here is a primer on the DeMark Setup and Sequential indicators.
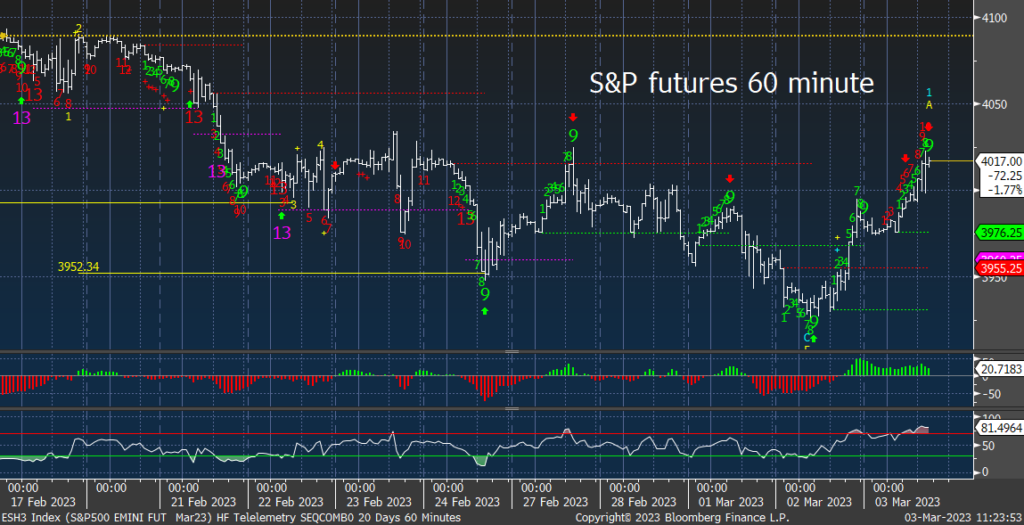
S&P futures 60-minute time frame has an upside Sequential on hour bar 10 of 13 with another sell Setup 9 which has stalled out a few other moves.
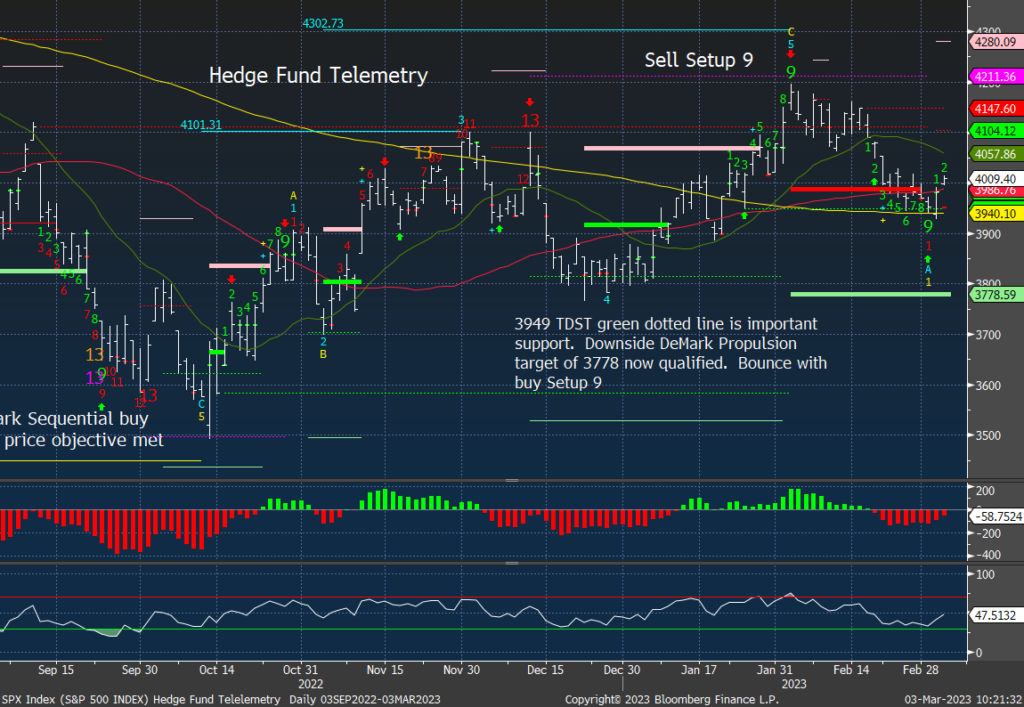
S&P 500 Index daily bounced off the completed buy Setup 9. There also is a downside Propulsion that qualified and can remain in play.
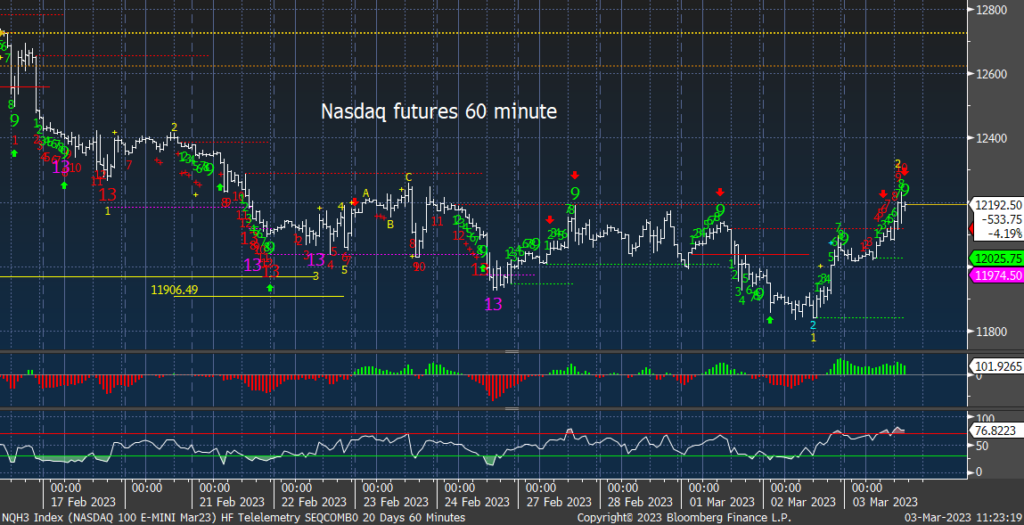
Nasdaq 100 futures 60-minute time frame with the Sequential on hour bar 9 of 13 and a new sell Setup 9 at resistance
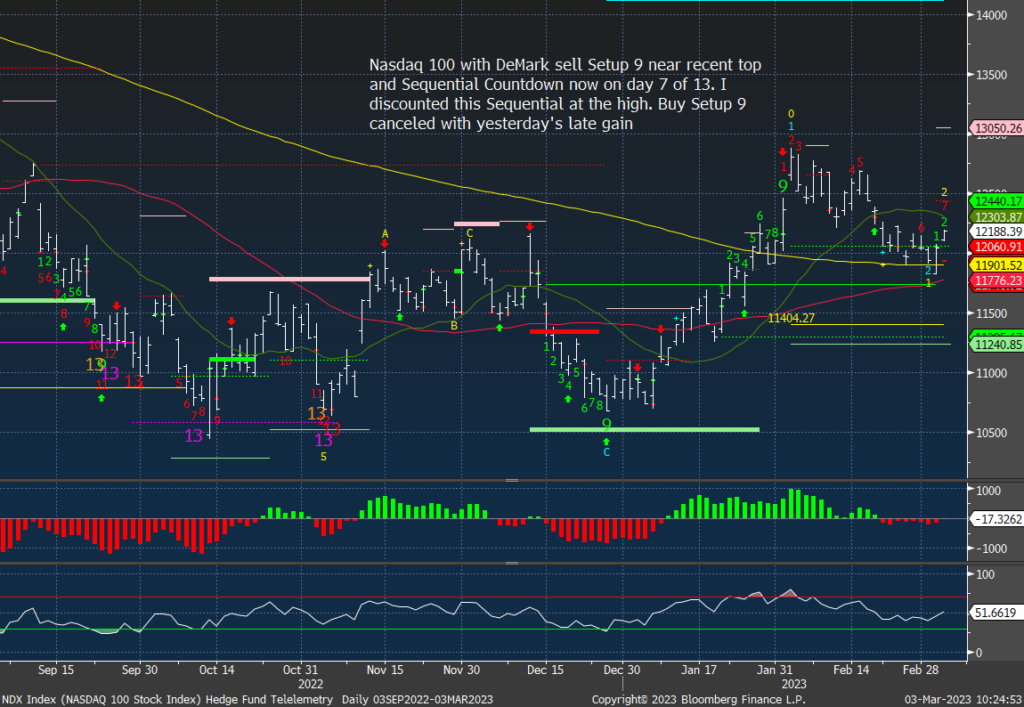
Nasdaq 100 Index daily with some important DeMark developments too.
Trade Ideas Sheet
REKR is up today on some vague and unsubstantiated takeover rumors. I continue to hold this one for some promising deals this year with the infrastructure bill. I like the new long ideas: AMGN, JNJ, NEE, DUK and like CRM short as you gotta think the activists will take the win with this lift.
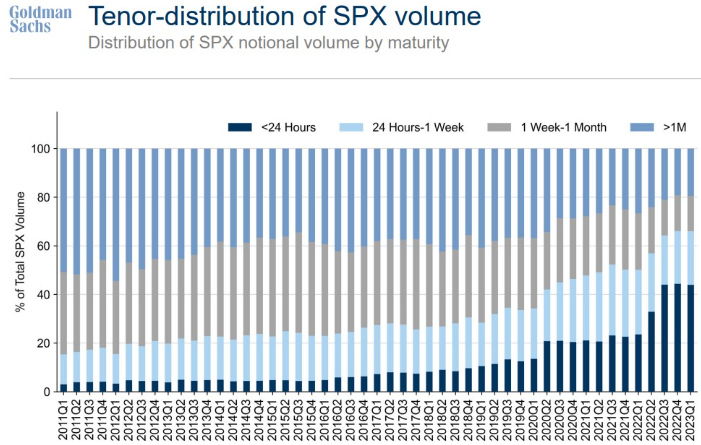
Another good look at the volumes of short-dated options trading. Admit it. You’re trading today’s expiration! All the cool kids are trading 0DTE options.
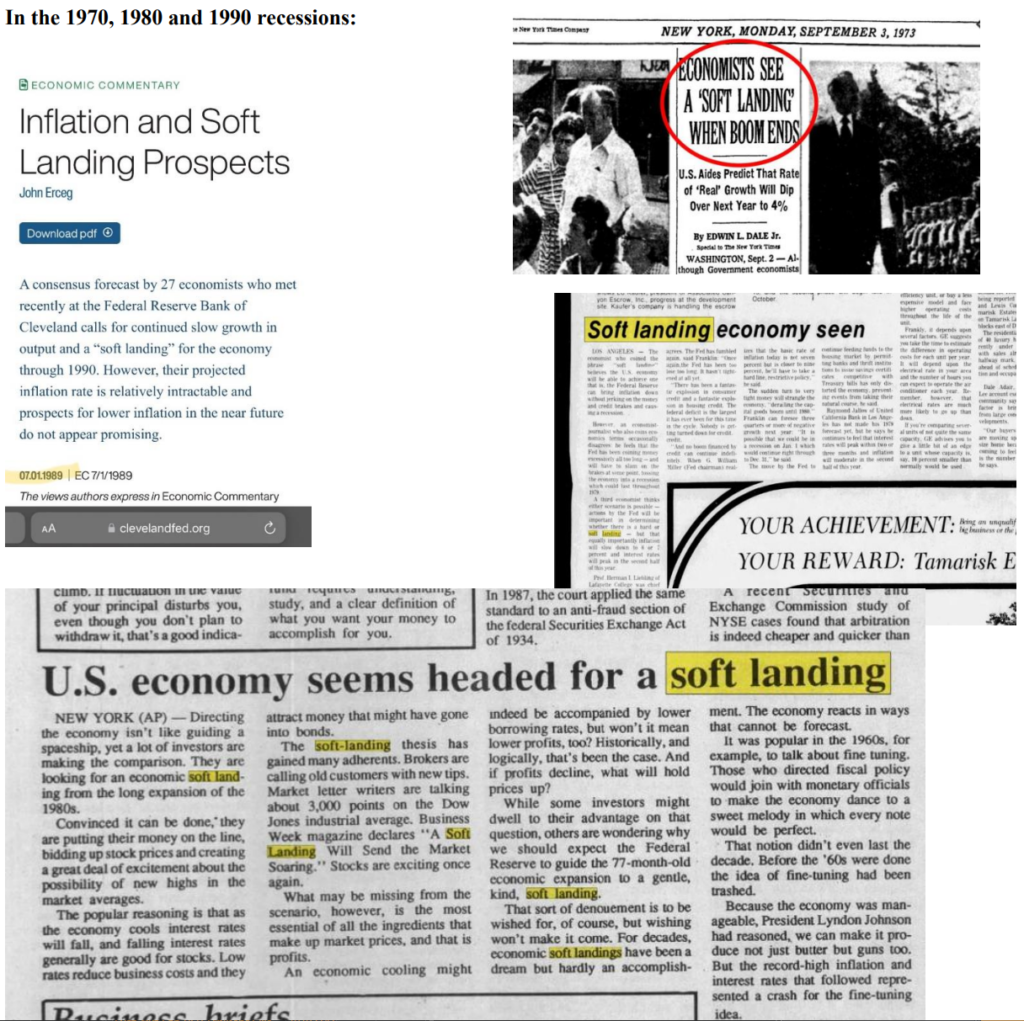
The history of the “soft landing” narrative
Fund manager Lukasz Tomicki of LRT Capital posted these clips on his monthly client letter of other periods when the Fed, economists, and the media discussed the “Soft Landing” narrative.


Latest BofA Harnett highlights
Michael Harnett from Bank of America is out with his latest piece. Here are some highlights:
I’ve been bearish on the home builder stocks, and with the low level of mortgage applications and mortgage rates at highs, there is a dislocation in the prices of homebuilder stocks.
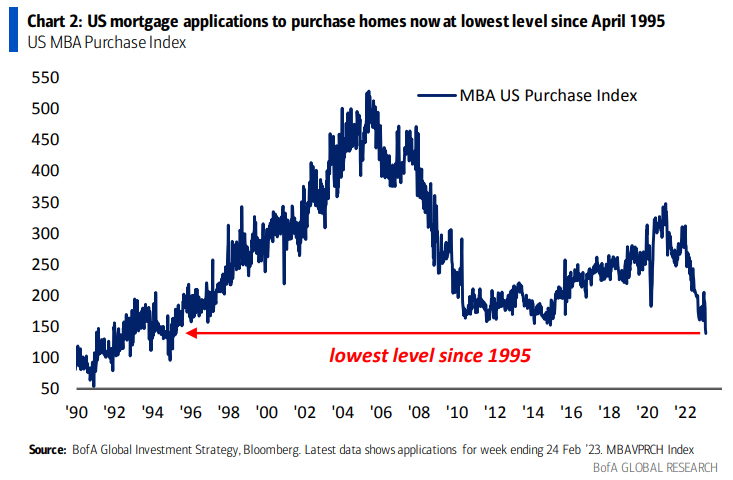
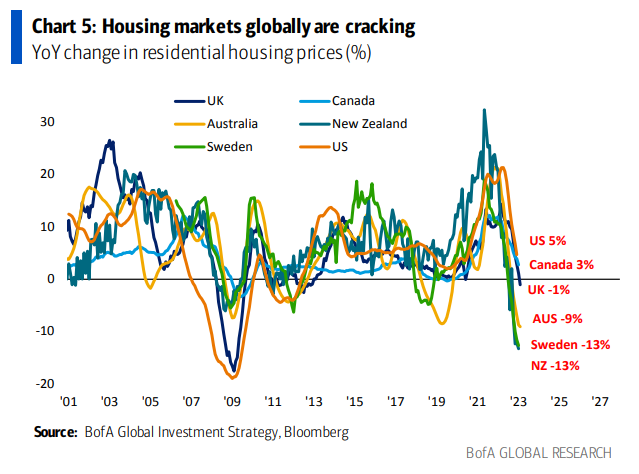
With the low turnover in the US, the prices have not turned negative… yet
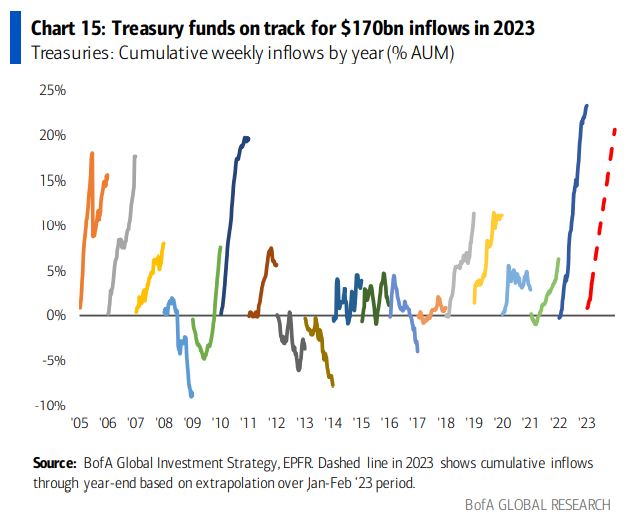
Despite the bond market falling, people are more than happy to take advantage of the higher interest rates
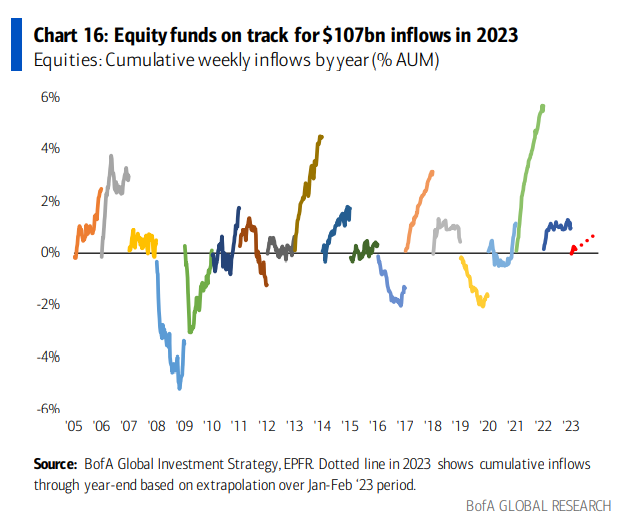
Equity inflows in 2021 were huge, and there haven’t been any outflows. There remain inflows YTD, and I believe we’ll see these turn into outflows in 2023
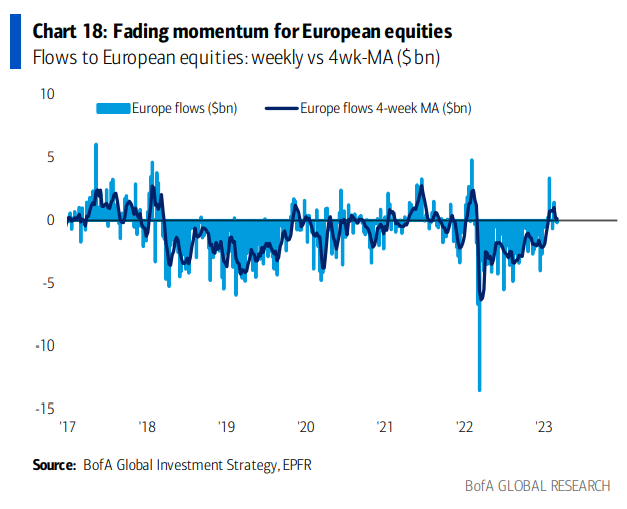
European markets have seen strong inflows in the last quarter
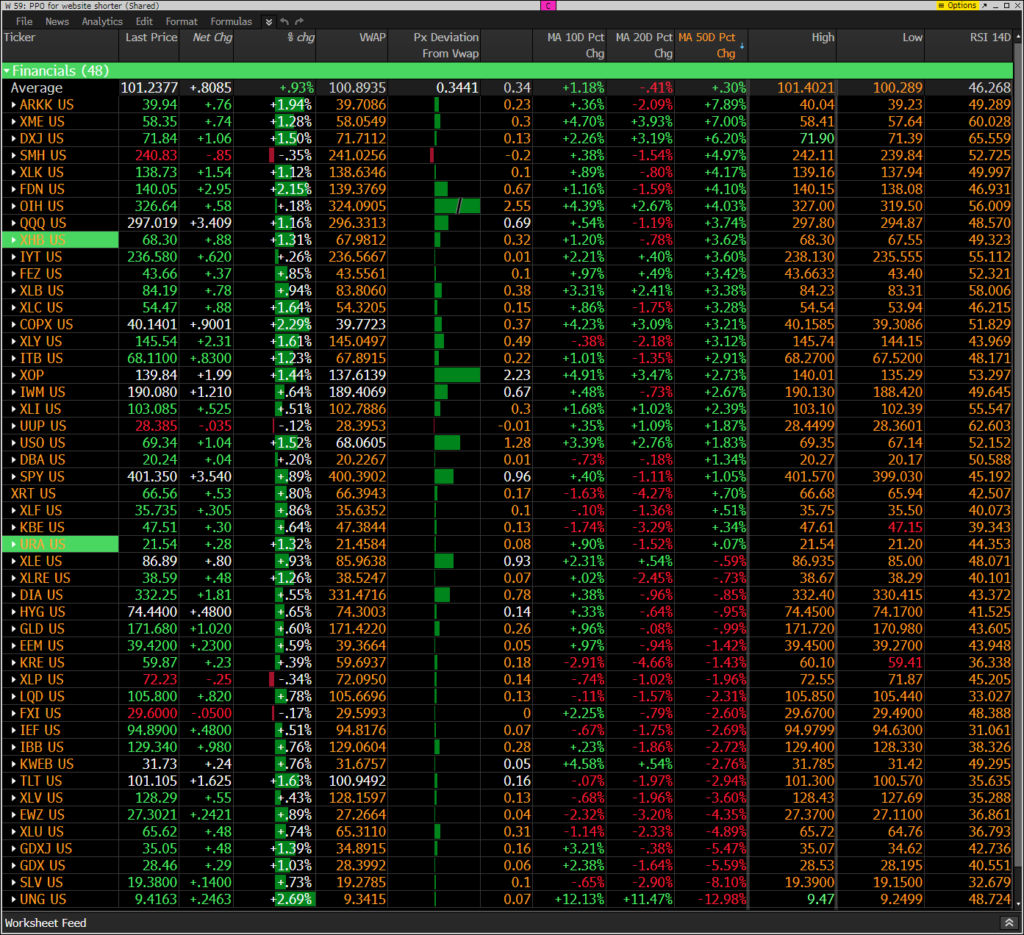
Hedge Fund Telemetry ETF Percentage Price Oscillator Monitor
The PPO monitor (percentage price oscillator) force ranks ETFs by percentage above/below the 50-day moving average. For information on this monitor, please refer to this primer. This monitor is offered to Hedge Fund Telemetry subscribers who are on Bloomberg. Strong overall however, several VWAP levels are not far from the current price. If these start to break, a late-day selloff is possible.
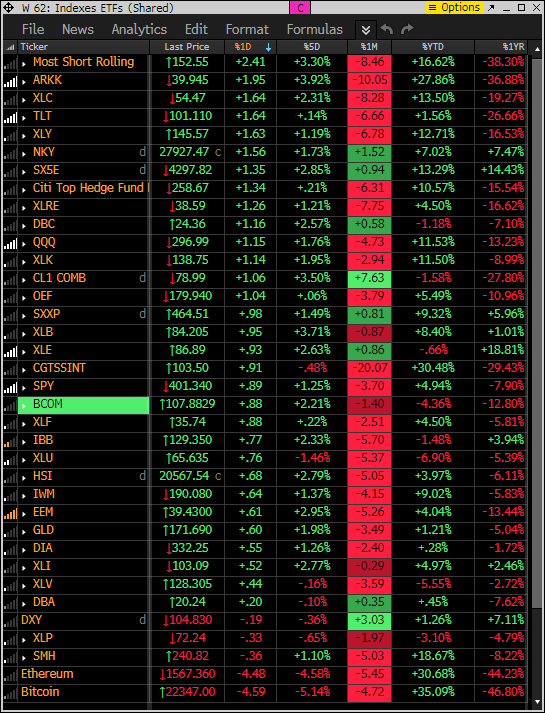
Index ETF and select factor performance
This ranks today’s performance with 5-day, 1-month, and 1-year rolling performance YTD.
Goldman Sachs Most Shorted baskets vs. S&P Indexes
This monitor has the S&P indexes and the Goldman Sachs most shorted baskets. Shorts are getting squeezed again today with some real money buying (S&P indexes higher)

DeMark Observations
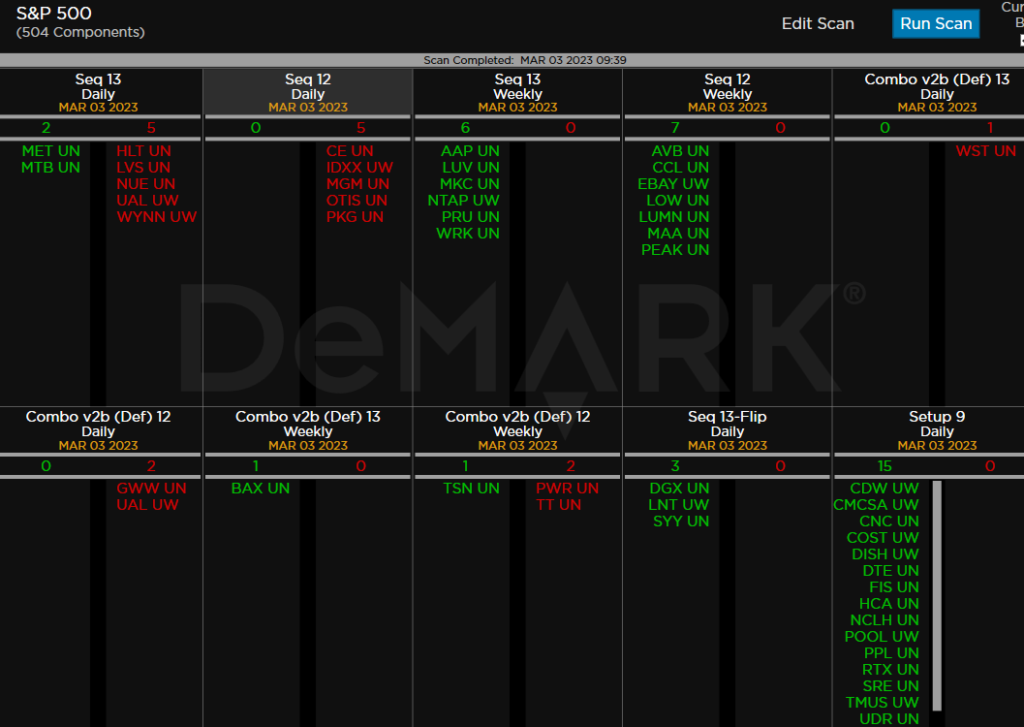
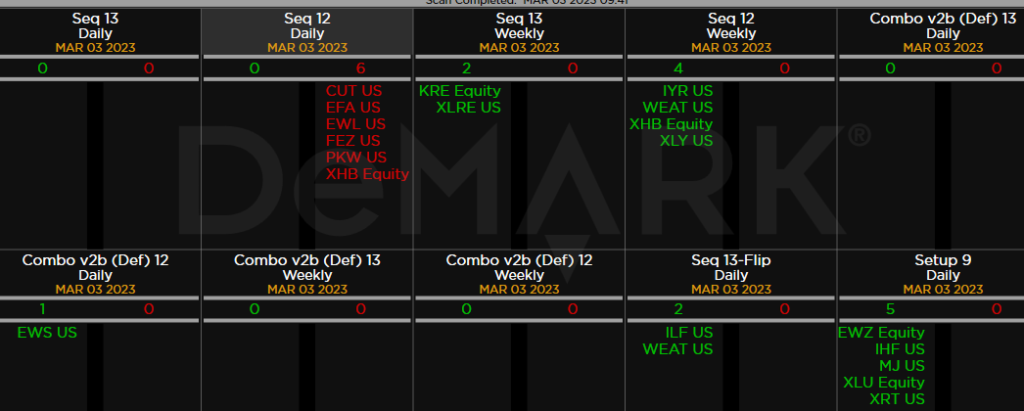
Within the S&P the DeMark Sequential and Combo Countdown 13s and 12/13s on daily and weekly periods. Please refer to this primer for information on how to use the DeMark Observations. The extra letters at the end of the symbols are just a Bloomberg thing. Worth noting: Starting to see two way buys and sells with Countdown 13’s. The Weekly buy Countdown 13’s are starting to trigger however we want to sell many more downside Sequential buy Countdown 13’s on the daily time frame to get a strong overall buy setup. Another day with many buy Setup 9’s. Short-term bounce potential.
Major ETFs among a 160+ ETF universe. Several on deck day 12/13 sell Countdown’s to watch EFA, FEZ, XHB
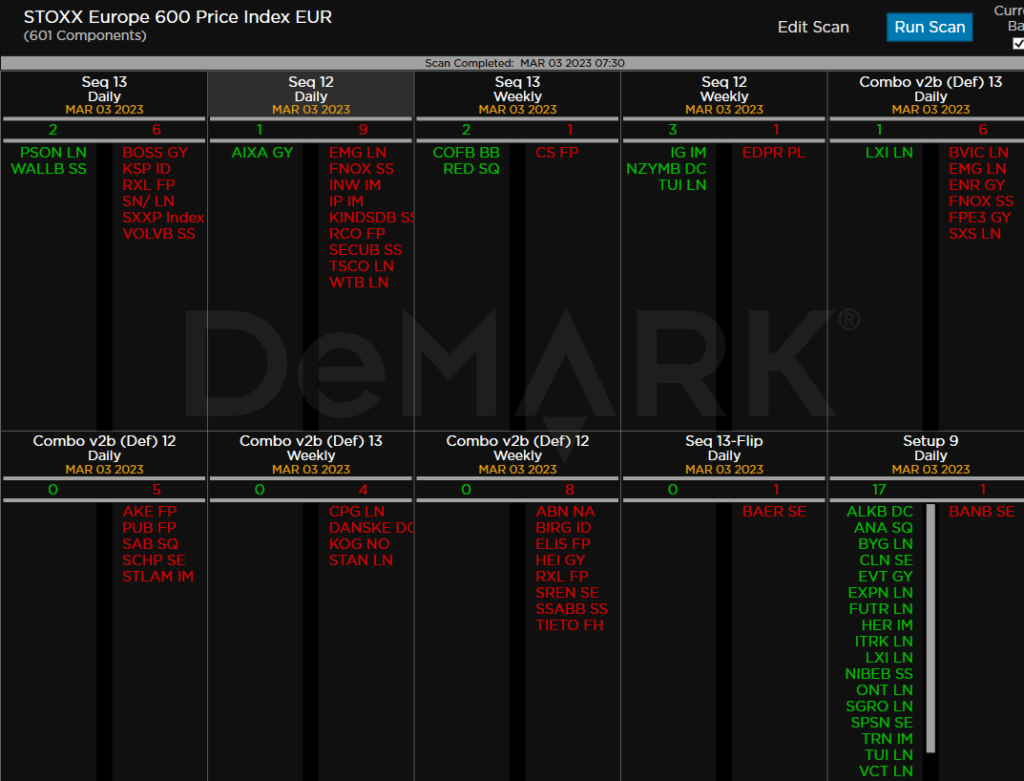
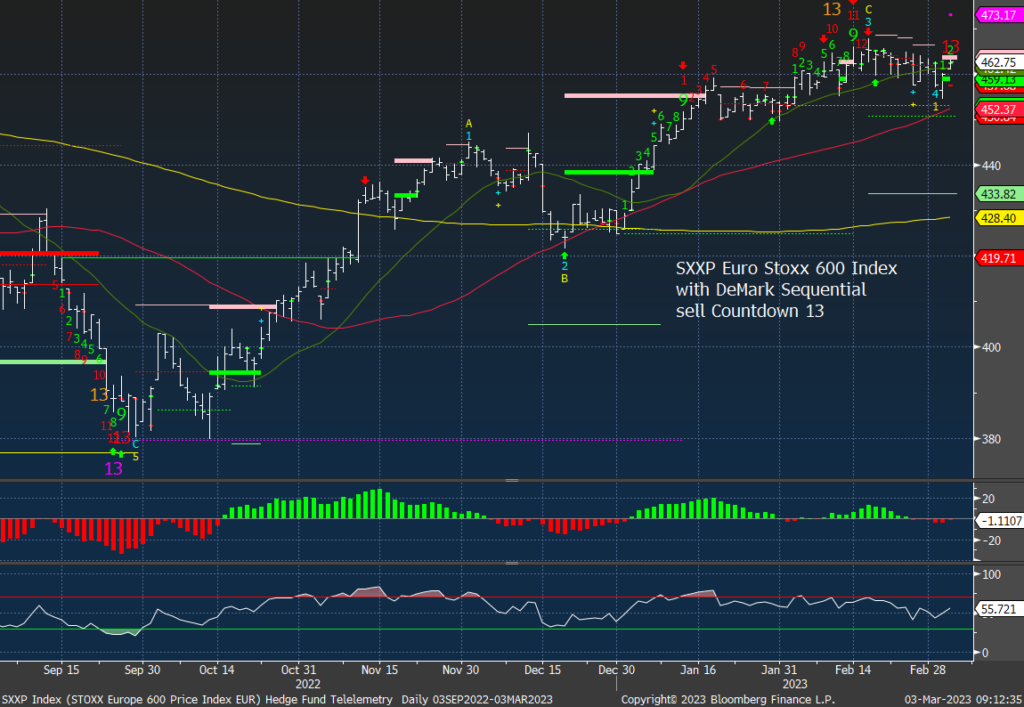
Euro Stoxx 600 still has many DeMark Sequential and Combo sell Countdown 13’s in play with the SXXP Euro Stoxx 600 now with its own Sequential sell Countdown 13.
If you have any questions or comments, please email us. Data sources: Bloomberg, DeMark Analytics, Goldman Sachs, Street Account, Vital Knowledge, Daily Sentiment Index, and Erlanger Research

