
Quick Market Views
I added some new ideas on this note and some extra stuff. I am on Real Vision’s Daily Briefing at 4pm ET today (you can access it free on You Tube) This will be the last note for today.
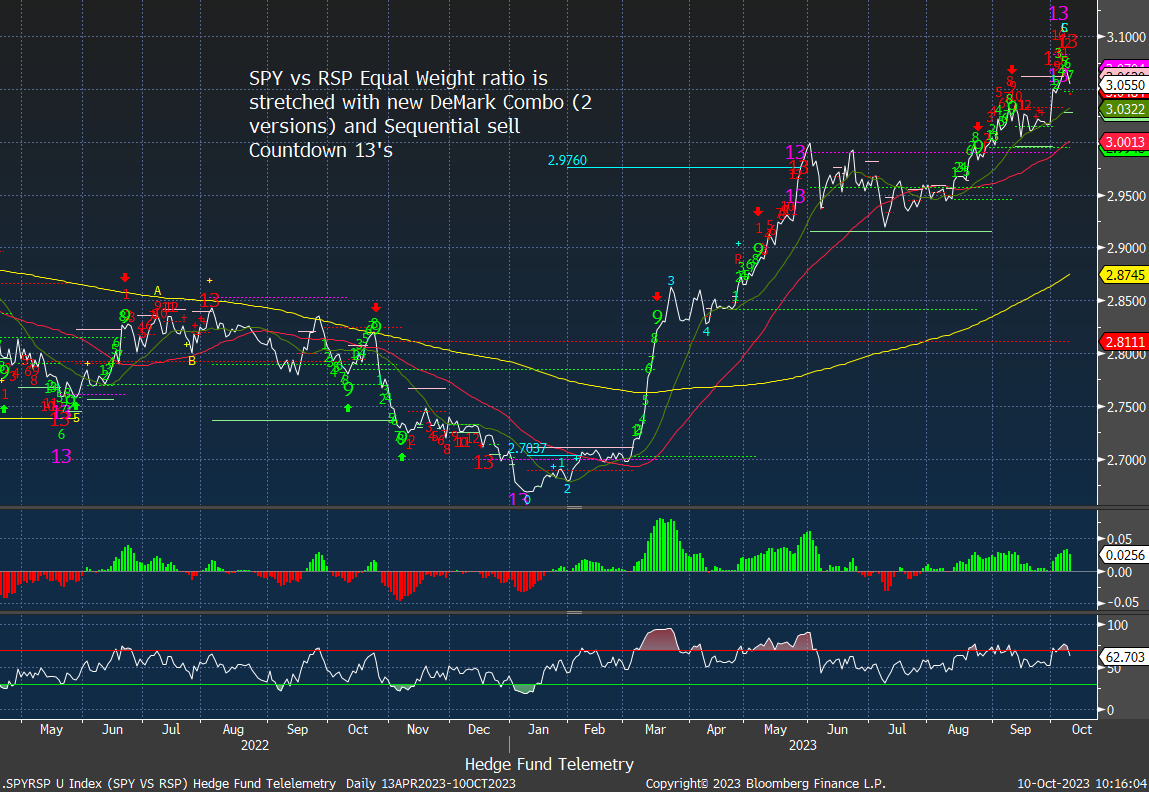
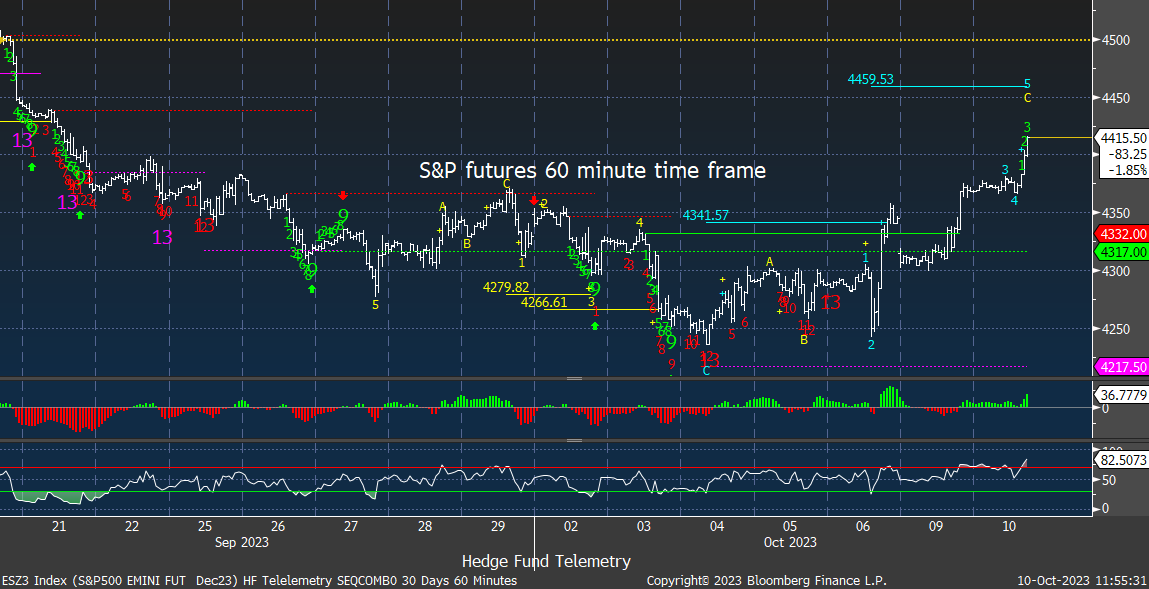
Stocks: The most important chart in the market right now is the SPY vs RSP S&P equal weight ratio as I have featured it on several notes recently. This suggests there can be some broadening out in the market which clearly is occurring. It’s also why I have adding a lot of longs to neutralize my long-short exposure. Corrective lower high wave 4 of 5 are now in play. Short-term 60-minute charts are now in upside wave 5 and could top out in the next day or two.
Bonds: Rates are lower and near the lows after staging a short lived bounce earlier. 2’s are down 14bps, 10’s down 17bps, and 30’s down 14bps. If the PPI or CPI comes in hot expect a reversal higher. The cooler CPI could be getting priced in. I expect stronger and hotter CPI reports in the coming months.
Commodities: Mixed action with Natural Gas up 1%, Crude down 0.9%, Grains weak, Copper down 0.075%, Gold and Silver up 0.5%.
Currencies: US Dollar Index is down 0.35%. Bitcoin didn’t get the risk on memo and is down 0.55%
Trade Ideas Sheet: Longs are now outperforming shorts with neutral positioning with a 65bps gain today.
Changes: Adding some new ideas
- I will buy a 2% sized weight long in PCT – see below
- I will buy a 2% sized long weight in GS
- I will short a new 2% sized short weight in AMGN
Thoughts: I expected some broadening in the market and added non-tech exposure which are mostly all working well. I continue to hold shorts for several reasons. First, there is still a very volatile and fluid situation in Israel and if this escalates it will hit stocks. Second, the S&P and Nasdaq are now in corrective lower high wave 4 of 5 and I expect a lower low wave 5 ahead.
US Market Indexes and Sentiment
Here is a primer on how we use Daily Sentiment Index charts. Bond, currency, and commodity sentiment are posted on the website.
S&P bullish sentiment and Nasdaq bullish sentiment are back above the 50% midpoint level

S&P and Nasdaq bullish sentiment didn’t get fully oversold and I continue to believe the series of lower highs and lower lows will continue going forward.


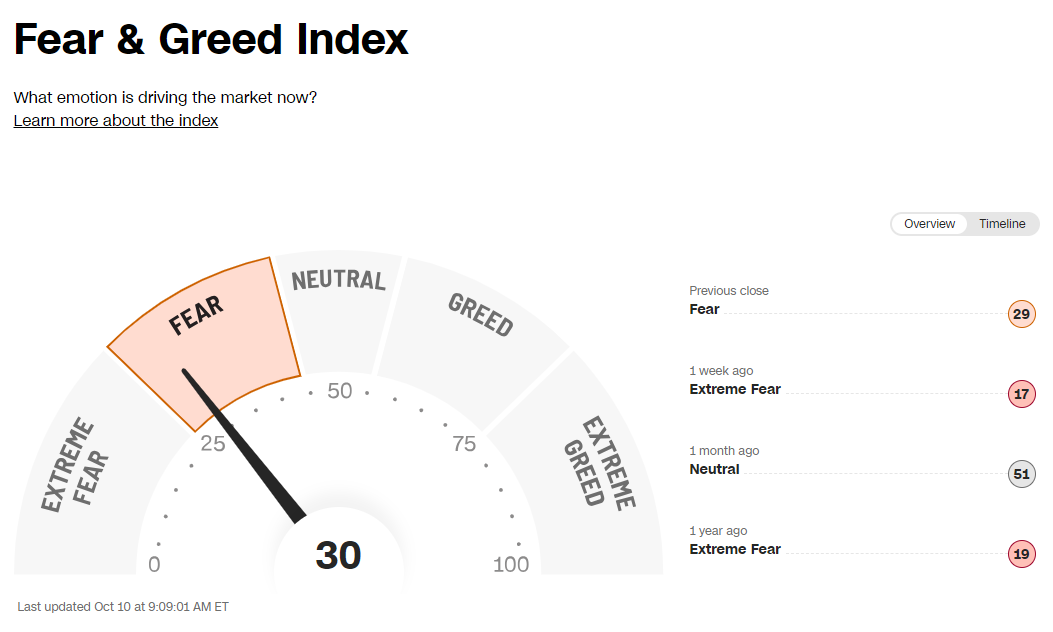
CNN Fear and Greed Index has bounced off extreme fear levels. It can and might remain under 50%

Here is a primer on the DeMark Setup and Sequential indicators.
I have shown this chart several times recently and believe it’s the most important chart to watch. SPY vs RSP S&P equal weight ETF. I believe this chart suggests some broadening out in the markets is possible. It is also why I have moved exposure to neutral with more long ideas.
S&P futures 60-minute time frame in upside wave 5 of 5 with upside Setup on hour bar 6 of 9. It may or may not reach the upside wave 5 price objective of 4,459.
S&P 500 Index daily now has qualified corrective lower high wave 4 of 5.

Nasdaq 100 futures 60-minute time frame also in upside wave 5 of 5 with upside Sequential on hour bar 6 of 13. It may or may not reach the upside wave 5 price objective of 15,568

Nasdaq 100 Index daily is now on day 5 of 9 with the upside Setup. A corrective wave 4 of 5 is now in play. This alone is not a signal. As long as this remains under wave 2 (yellow 2) the downside wave pattern is in play.

Russell 2000 IWM with three strong days. Is this a similar bounce like last August?

Trade Ideas Sheet
Pre changes

PCT Pure Cycle Technologies is a high-risk small-cap stock that has technology that takes waste materials and converts it into highly pure plastic that is sold in pellet form to companies like Procter and Gamble. I recently worked on this one and learned about the very interesting technology. There are a lot of skeptics in this one and some very smart investors who believe in the technology. P&G, the largest PCT customer, first developed the technology. The stock ripped higher to 12 after they turned on the plant and were producing the product. It worked fine until there was a freak local power outage, which shut the plant. Pipes were clogged, and they had to shut the plant down. A force majeure situation. The stock moved down as expected and, at this point, could be de-risked for a new entry. All signs believe the company has installed backup power generators and has resolved the issues, and they could soon turn on the plant again. I am starting a position with a 2% sized weight and will add more on a dip or higher. THIS IS A HIGH-RISK TYPE OF IDEA, SO KEEP YOUR SIZE SMALL AND REASONABLE.

PARA as much as I don’t want to jinx it is trying to turn off recent lows. 14-15 is heavy resistance. It remains the cheapest of all media assets.

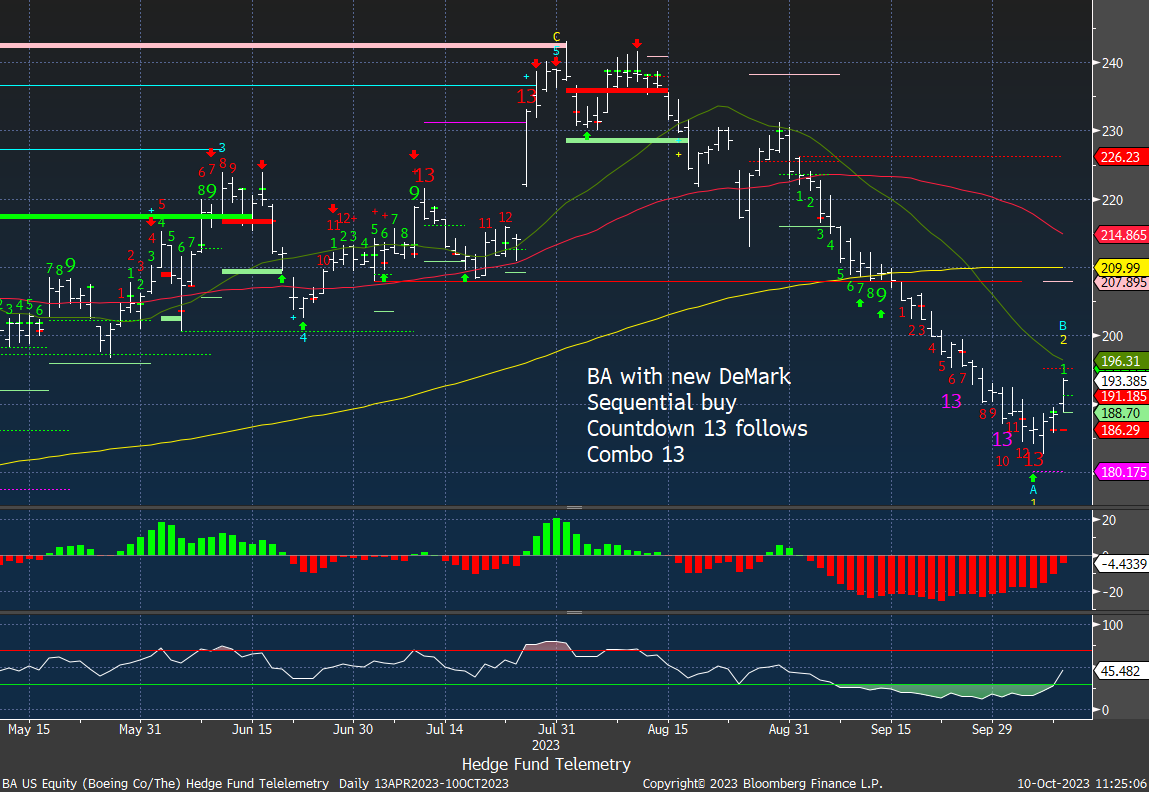
BA a new long with a price flip up. I continue to this can work higher.
AA a current long needs to clear 30 to break out. I continue to hold long.

JPM a new long idea reports Friday. The stock is up after we recently bought it and I will hold.

I will add a 2% new long position with GS ahead of earnings. I think JPM and them will be OK.

AMGN was a long idea from back in May that I exited too early. It’s looking like a topping pattern with a new DeMark Sequential sell Countdown 13. I am going to add a new 2% sized short.

Sell-side notes and flows
Eric Johnson from Cantor Fitzgerald posted a new note today. I have always liked his work. He remains bearish and highlights the battle between technicals and fundamentals. I agree.

Eric has a great chart here. Many people have suggested the only way to fix the bond market is to crash the equity market. In some respects, this is plausible, as it’s happened before.

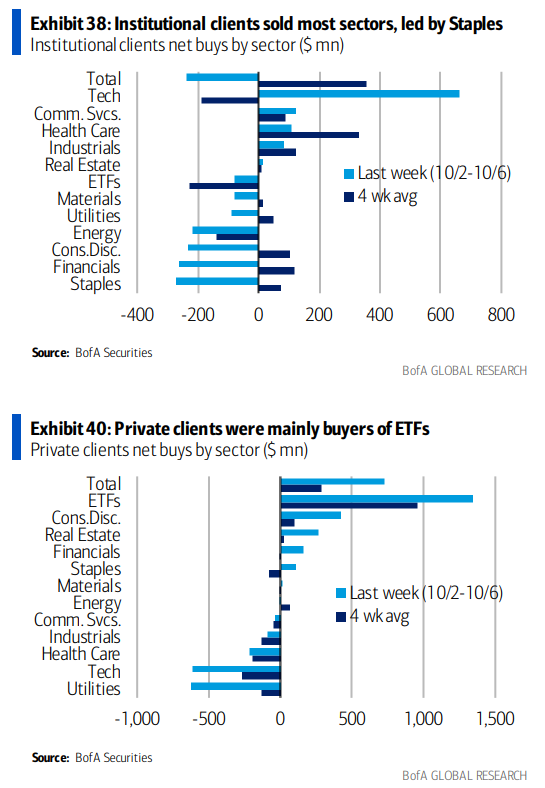
The Bank of America flow data had a few interesting charts. ETFs (large cap) remain the most bought while tech saw buyers again while utilities and energy were sold.

Large cap remains the preferred place for buying.

Mixed action last week by client type as hedge funds and institutional investors were buyers mostly across the board while retail sold tech and utilities

Hedge Fund Telemetry ETF Percentage Price Oscillator Monitor
The PPO monitor (percentage price oscillator) force ranks ETFs by percentage above/below the 50-day moving average. For information on this monitor, please refer to this primer. This monitor is offered to Hedge Fund Telemetry subscribers who are on Bloomberg. Broad strength.

Index ETF and select factor performance
This ranks today’s performance with 5-day, 1-month, and 1-year rolling performance YTD. Short baskets are getting squeezed hard today. That’s the story.


Goldman Sachs Most Shorted baskets vs. S&P Indexes
This monitor has the S&P indexes and the Goldman Sachs most shorted baskets. Short baskets are getting squeezed higher big time today. Much stronger than index performance.

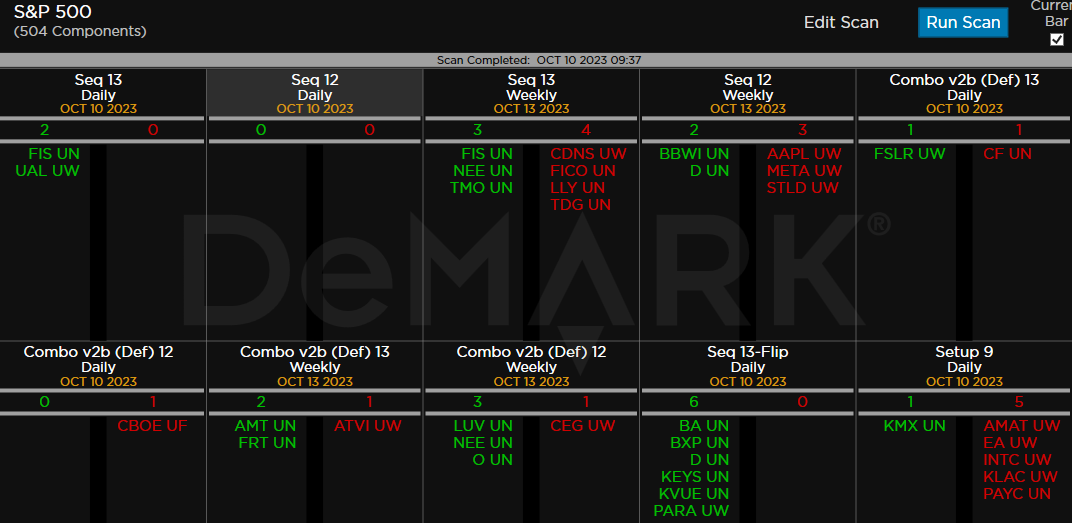
DeMark Observations
Within the S&P the DeMark Sequential and Combo Countdown 13s and 12/13s on daily and weekly periods. Please refer to this primer for information on how to use the DeMark Observations. The extra letters at the end of the symbols are just a Bloomberg thing. Worth noting: A little quiet with 13 Countdowns while a few more price flips up, including BA and PARA current longs
Major ETFs among a 160+ ETF universe.

Euro Stoxx 600

If you have any questions or comments, please email us. Data sources: Bloomberg, DeMark Analytics, Goldman Sachs, Street Account, Vital Knowledge, Daily Sentiment Index, and Erlanger Research