
Quick Market Views
Stocks: Choppy spiky action up and down has been what we’ve been trying to navigate in the last few weeks. Breadth is again very weak with NYSE and Nasdaq down over 2100 issues. I’m doing my best to find decent long ideas while short ideas are starting to add alpha. I’ve raised more cash than usual, and that is a reflection of my concerns for a decent-sized pullback that will see sentiment move to oversold levels and some DeMark buy Countdowns will show up, giving us a lower risk-long entry opportunity. Since the markets have moved higher so consistently, absent any volatility or pullbacks, the risk of something more sinister is possible. I have an update on the VIX Index and Credit spreads which are starting to show signs of stress. Broader indexes like the equal weight ETFs and Russell look vulnerable to the downside. Considering the market positioning has been max over, some levels not so far off from where things are could turn more funds into sellers. Financial earnings were not received well with all of them down hard (for them), and next week, more broadening of sectors with companies reporting will kick off.
I will be updating the ETF Momentum Monitor after this note is sent. I will do a video and send later.
Bonds: Recent DeMark sell Countdown 13’s on some yields is seeing a reversal today that isn’t helping the equity markets. This could be due to a risk off type of trade with the heightened tensions with Iran and Israel. Across the curve rates are down 7-9bps.
Commodities: Mostly still higher but there has been some intraday reversals off the highs.
Currencies: US Dollar Index is now over 106 perhaps another risk-off type of signal. See the charts of Euro and Pound on First Call. Bitcoin is down 1.6%.
Trade Ideas Sheet: Hedging out a lot of market risk is working to limit volatility.
Changes: I will add 2% to bring SMH short to 5% and double up MGK short back to 5%.
Thoughts: Not pleased with the action with China tech but I have faith and will be patient as BIDU has an AI conference next week. Our cost in the larger picture on these isn’t so bad vs what I see on the upside this year. REKR is down on no news, and liquidity isn’t there, so sit tight, as we know there are positive catalysts ahead. AAPL has lifted in the last few days which happened ahead last quarter’s earnings. This has been a defacto funding short so some de-risking (covering shorts/selling longs) could be happening. I added a little in the fund today short.
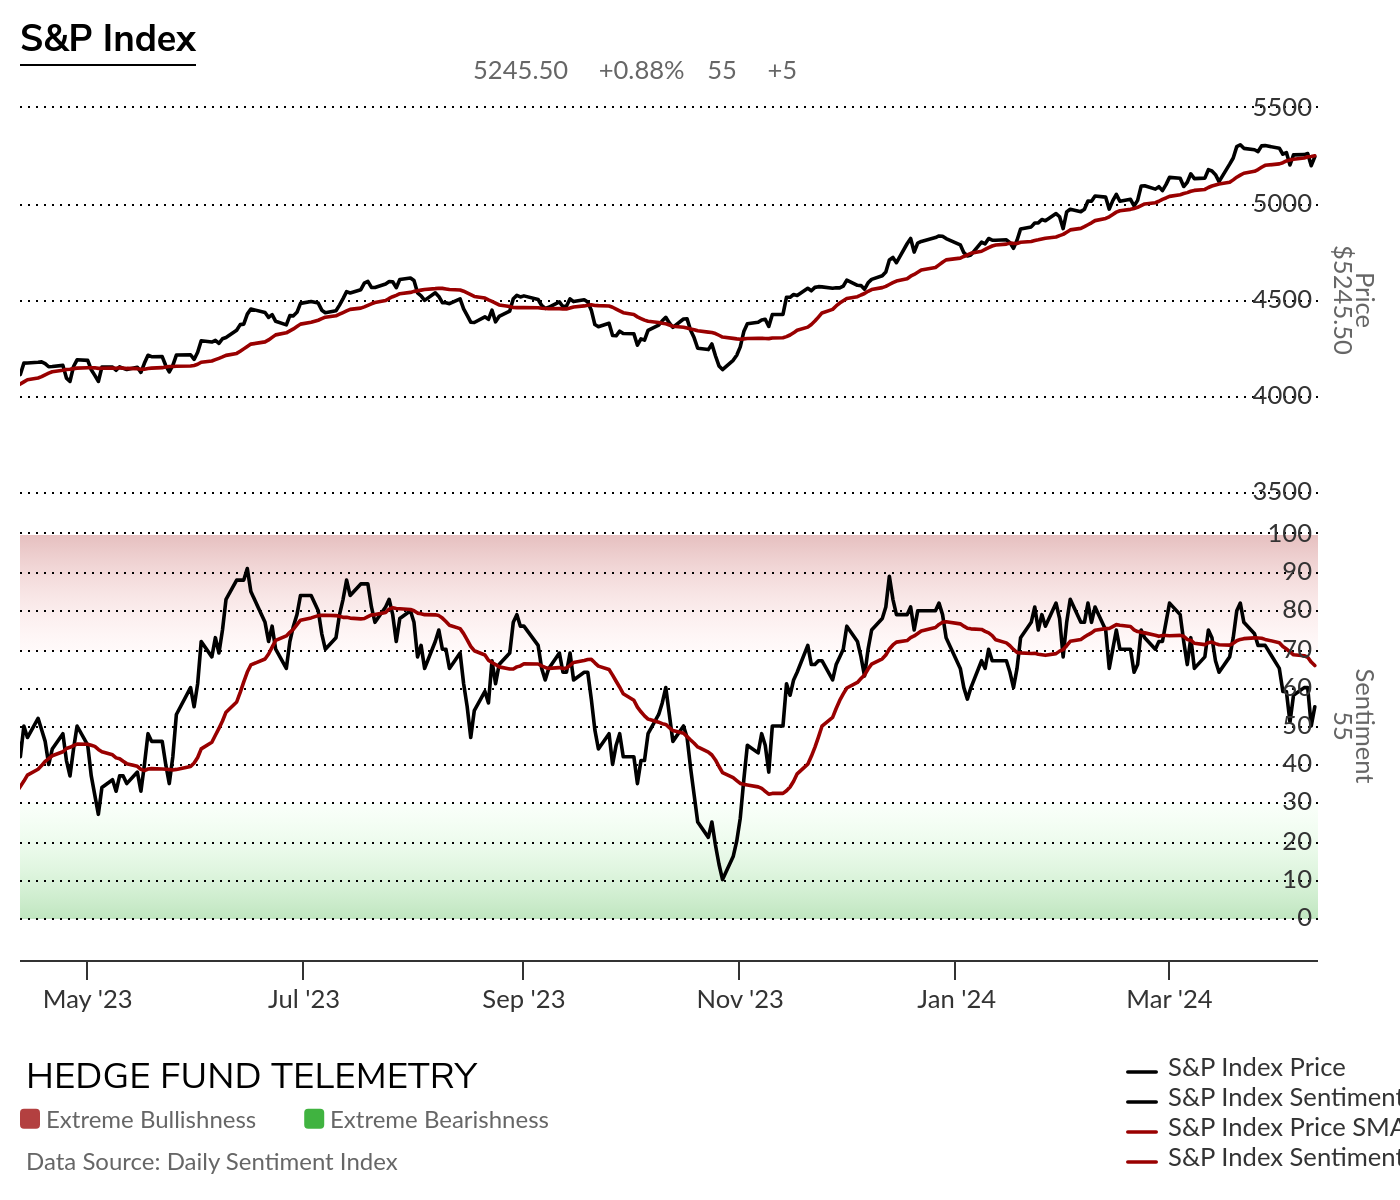
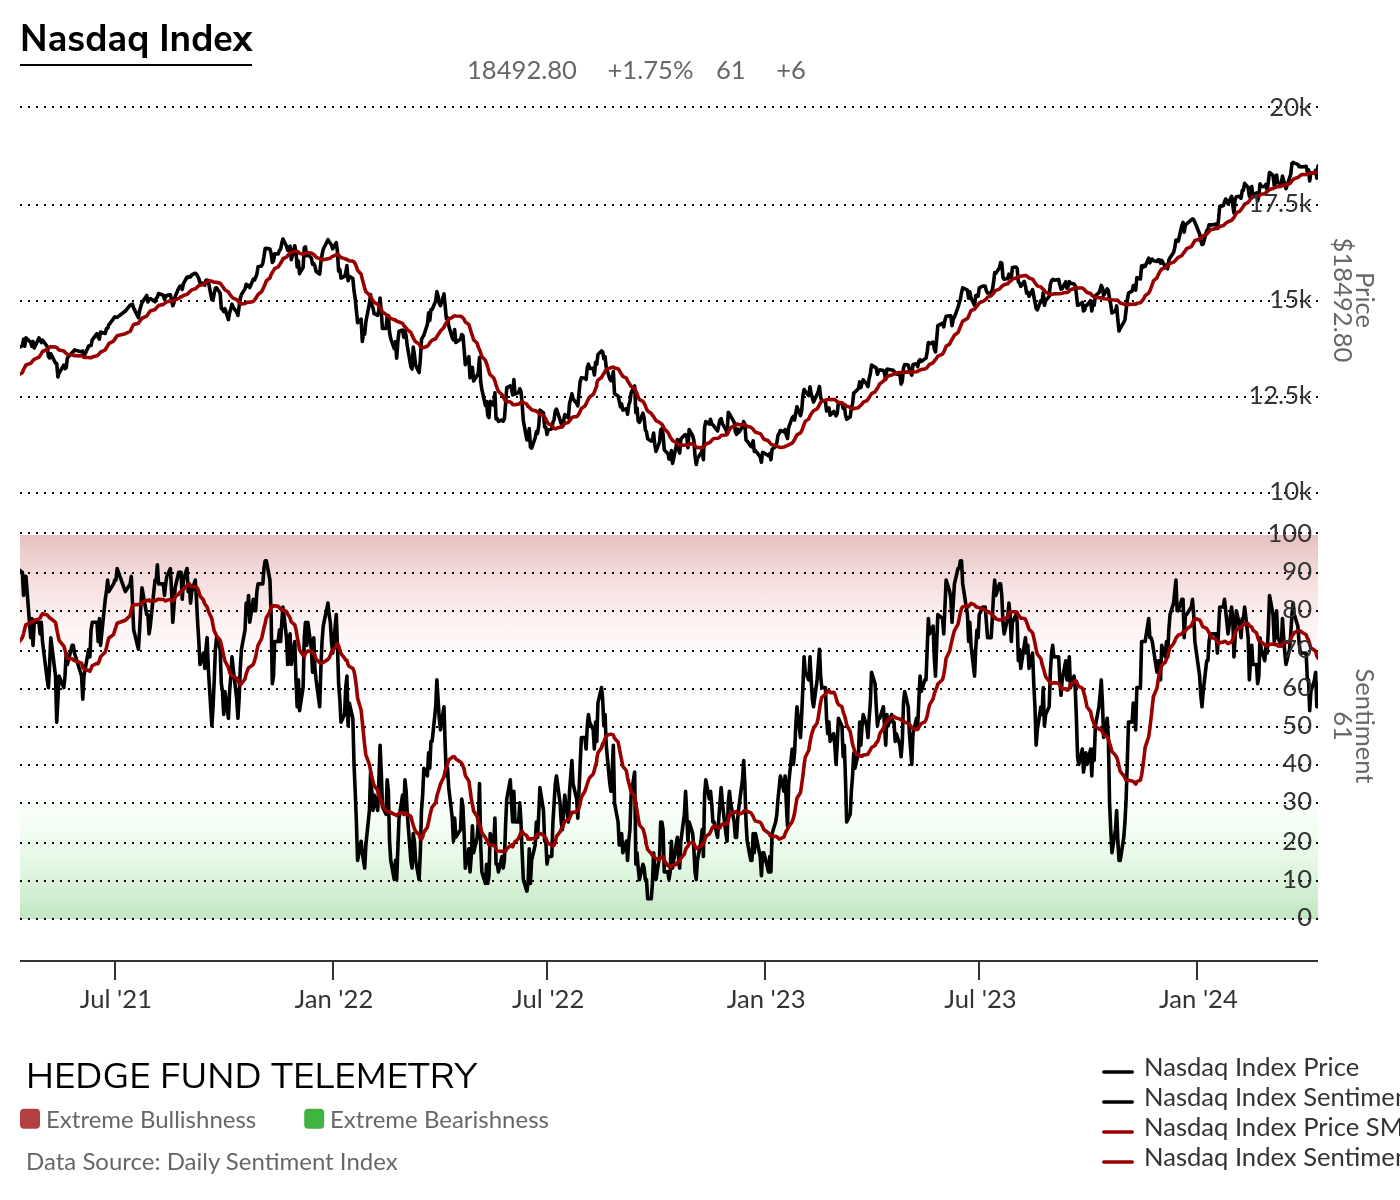
US Market Indexes and Sentiment
Here is a primer on how we use Daily Sentiment Index charts. Bond, currency, and commodity sentiment are posted on the website.
S&P bullish sentiment and Nasdaq bullish sentiment bounced yesterday off the midpoint majority level. The 20 day moving average of bullish sentiment is now declining.
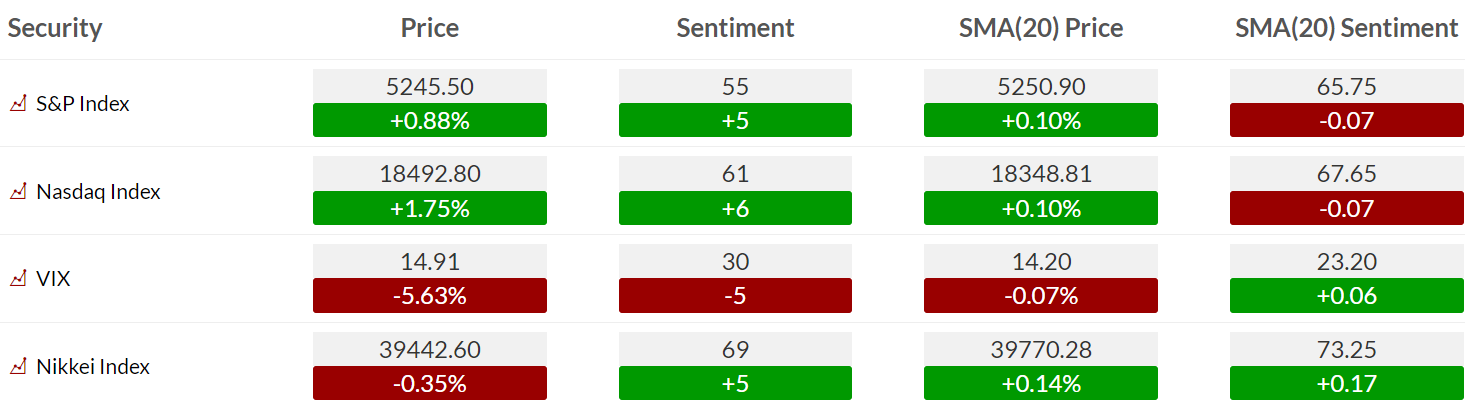
S&P and Nasdaq bullish sentiment could break 50% with tonights data. It should be updated around 7:30pm ET on the site.
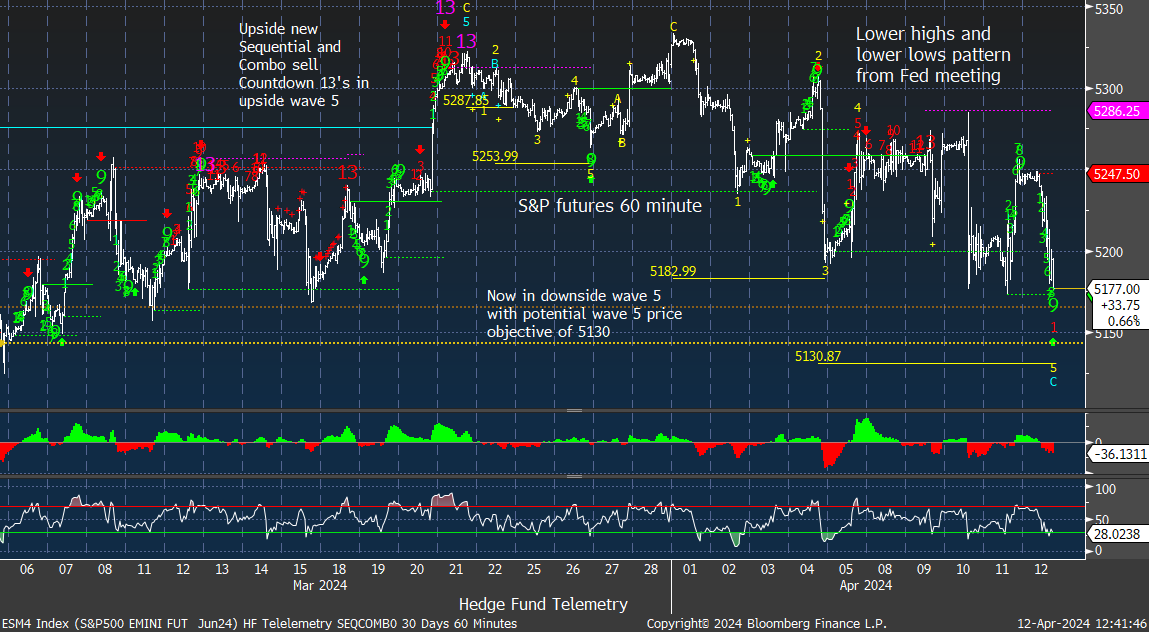
Here is a primer on the DeMark Setup and Sequential indicators.
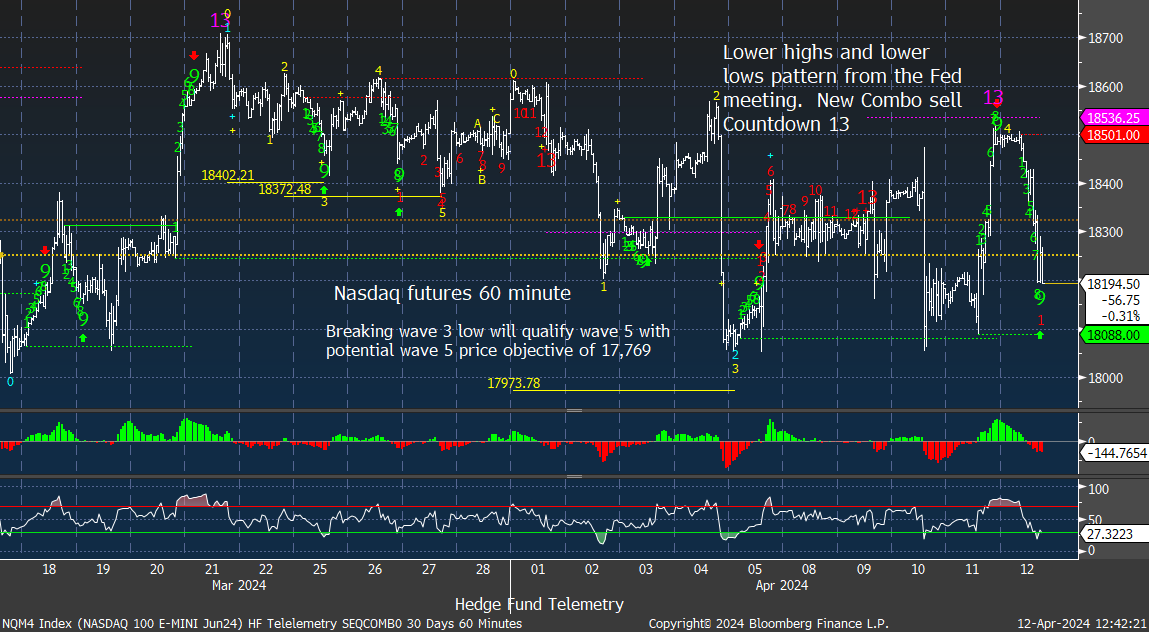
S&P futures 60-minute tactical time frame shows the choppy spiky mess of a market.
S&P 500 Index daily with a potential rolling top with 50 day at 5111 doable and perhaps more on the downside.

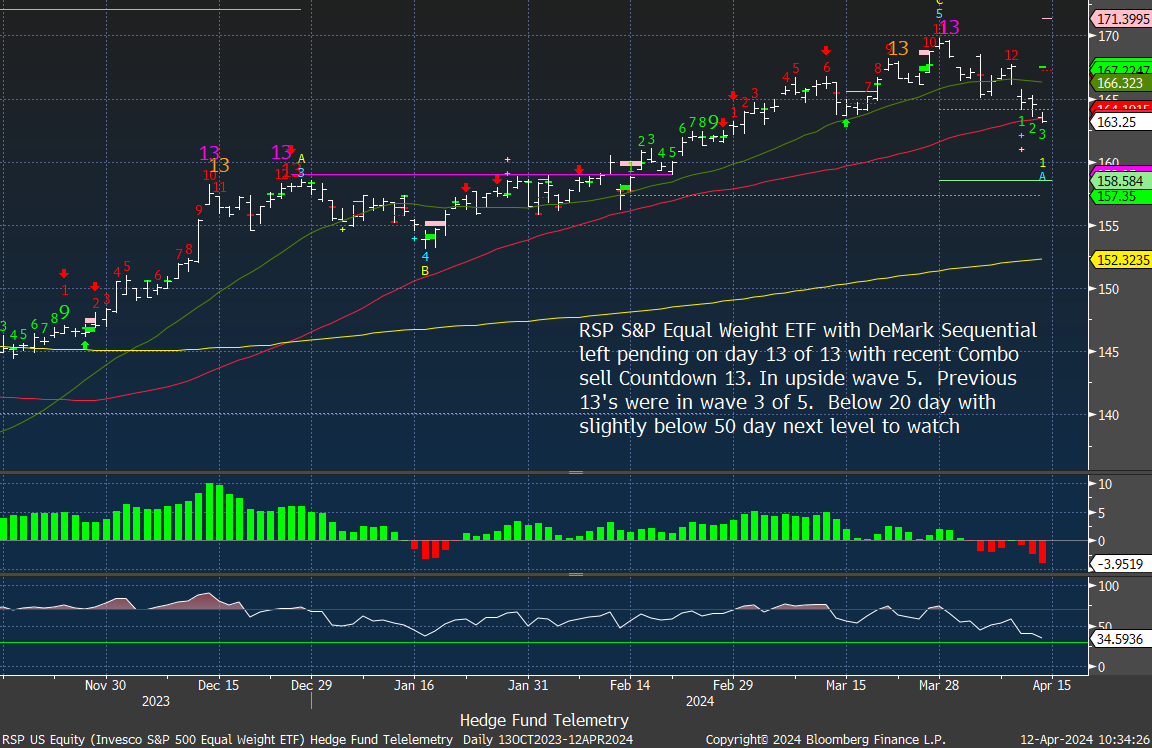
RSP S&P Equal Weight ETF slipping lower
Nasdaq 100 futures 60-minute tactical time frame is still above last week’s lows.
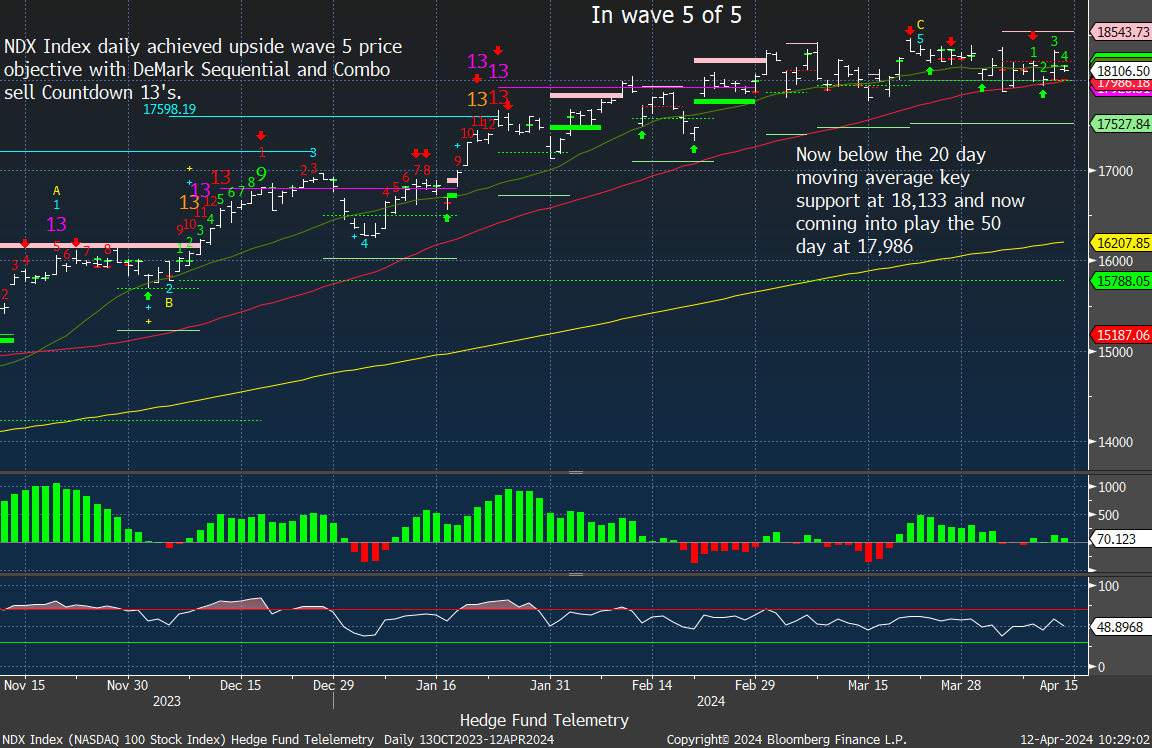
Nasdaq 100 Index daily sideways with 50 day support.
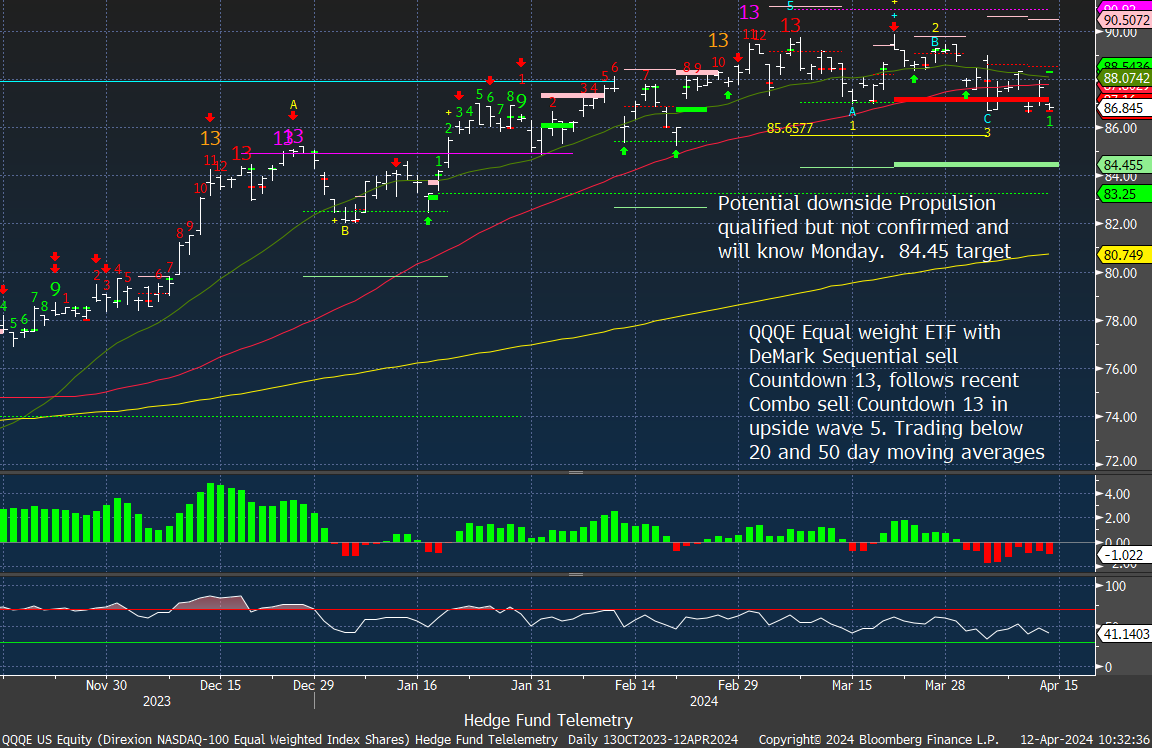
QQQE Nasdaq 100 equal weight is at support and could break
IWM Russell 2000 doesn’t look good

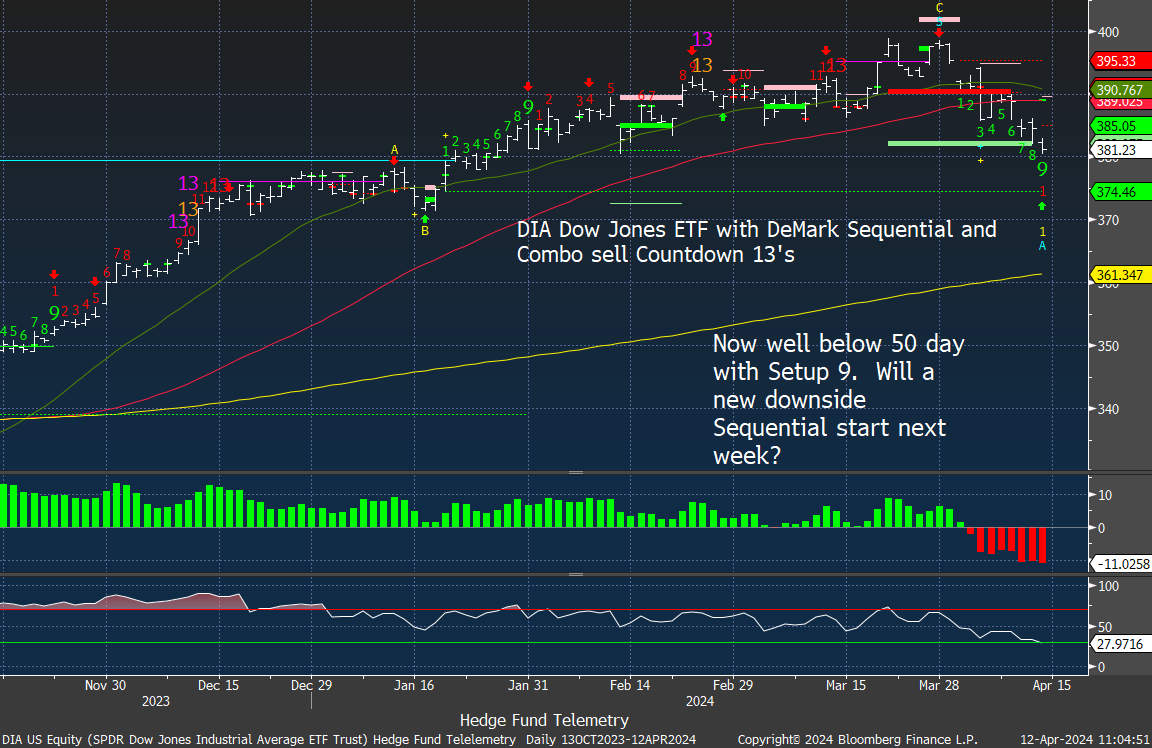
DIA Dow Jones ETF is slipping lower and could start a new Sequential Countdown next week with more continuation.
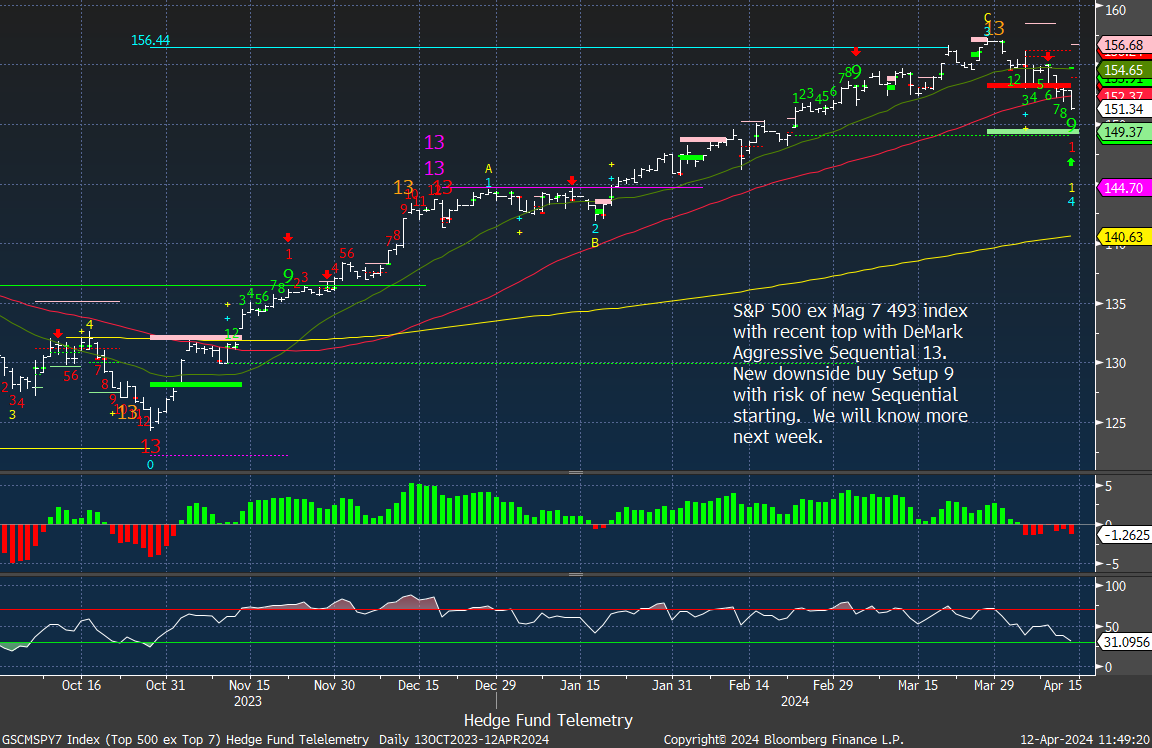
S&P 493 ex Mag 7 like other indexes is slipping lower and could start a new Sequential Countdown next week with continuation.
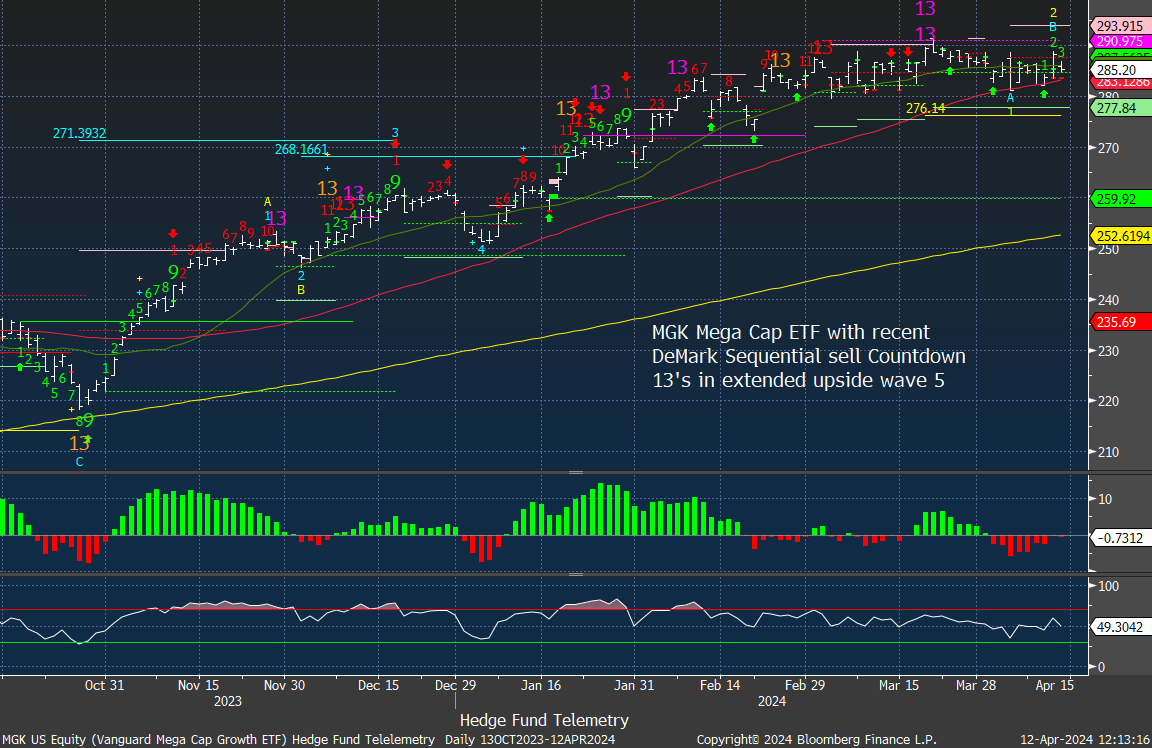
MGK Mega Cap ETF has been moving sideways and is very crowded on the long side. I’m doubling up the short exposure again to 5% from 2.5%.
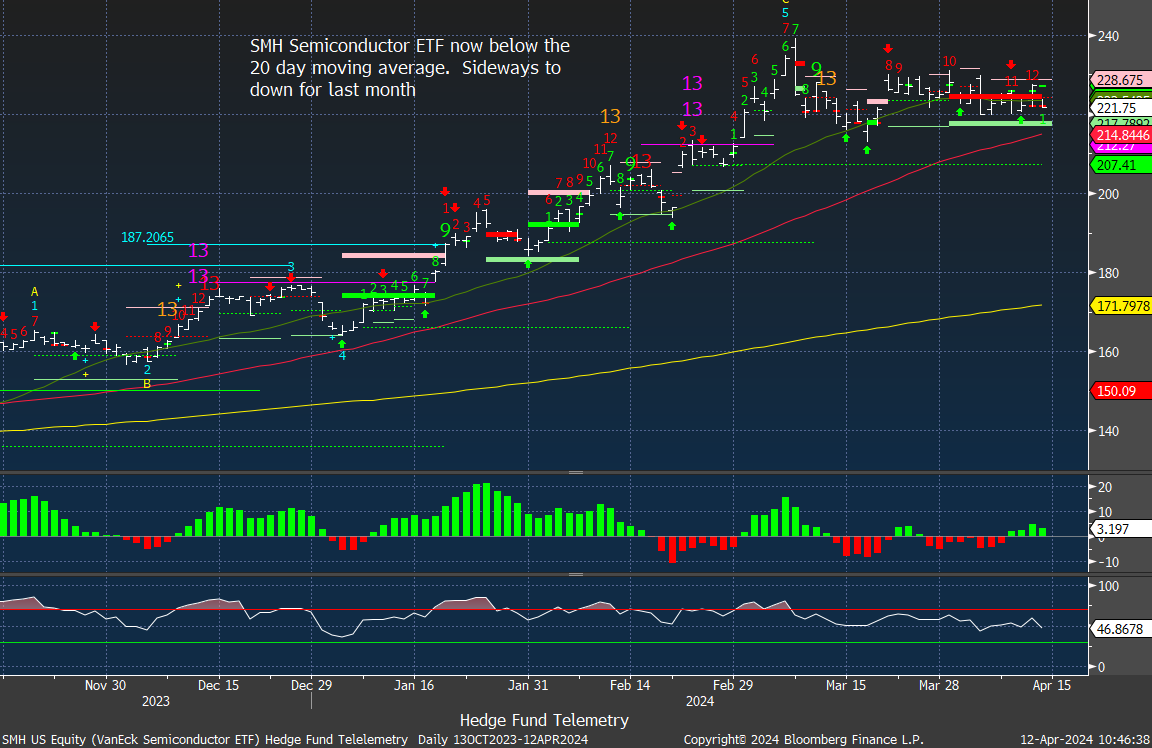
SMH has been the going sideways since early March and might just break support. I am adding 2% to bring to 5% max short SMH.
VIX Index and credit spreads update
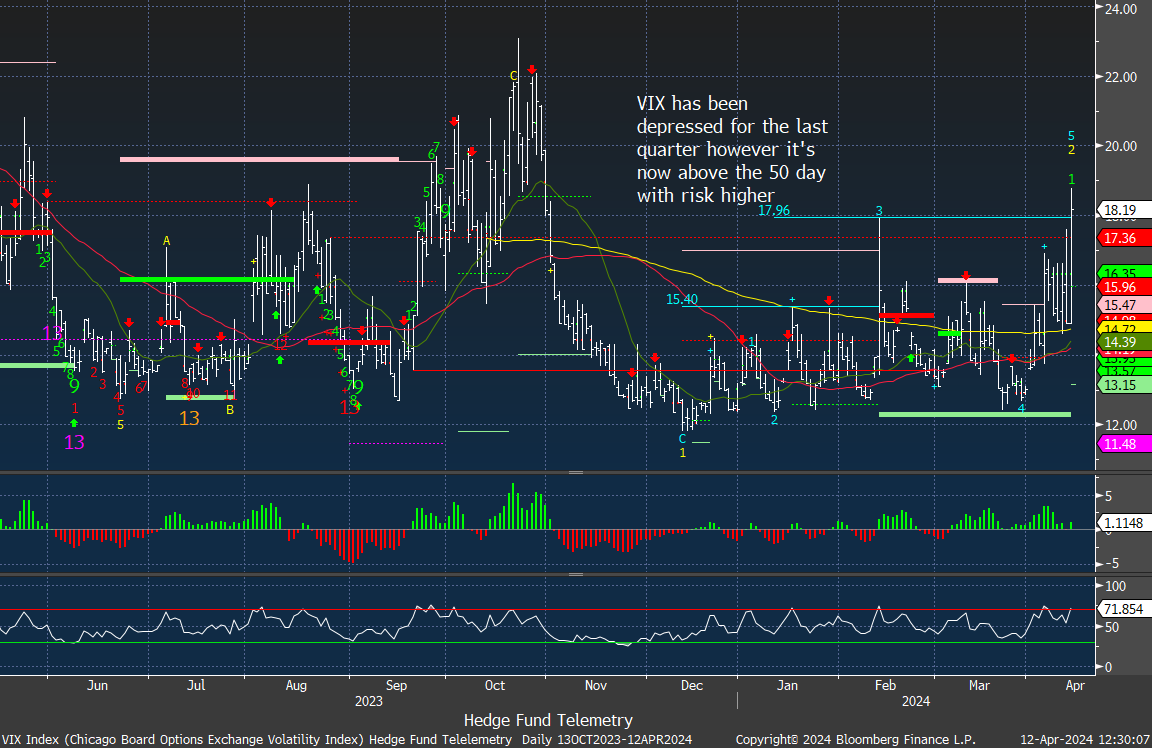
VIX Index is at the highest level since last November. As much as many will discount the VIX index since short term options trading is more in vogue this still matters.
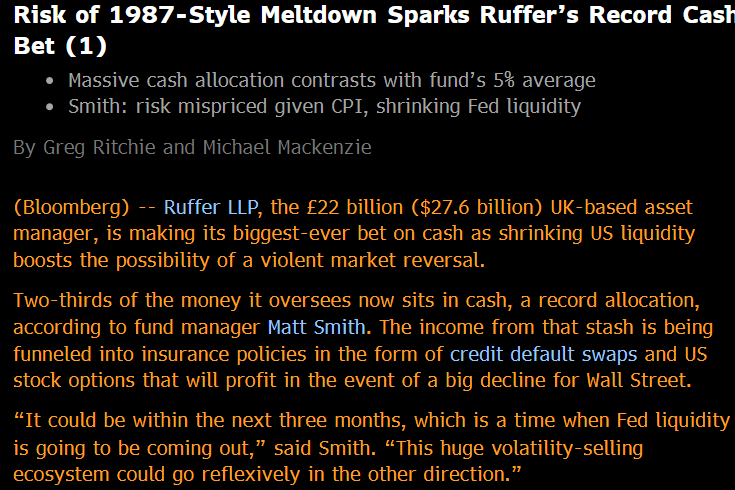
Ruffer is now holding the majority of it’s assets in cash. Ruffer is a very smart firm who has been known also as “50 cent” for purchasing out of the money VIX calls for $0.50. I’ve talked about the massive inflows of volatility selling assets in the last few years that Matt Smith is also concerned could lead to a 1987 style meltdown.
If you don’t think selling volatility can wipe out a portfolio in a day, ask this guy. The Rolex and cufflinks weren’t a good look when you’re telling your clients you wiped them out AND that they now owe money on top of being zeroed out.

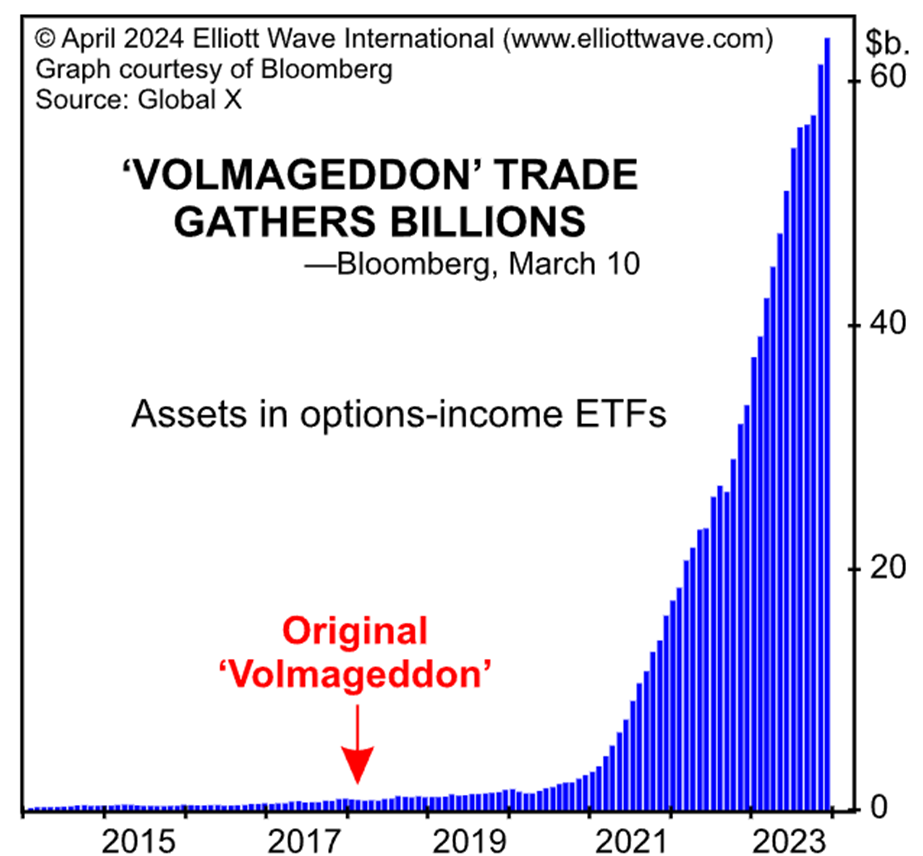
This graphic shows the assets in option selling strategies. Volmageddon in 2017 saw the markets drop about 10% in a few short days. How do you think it will go down if there is another “rogue wave”?
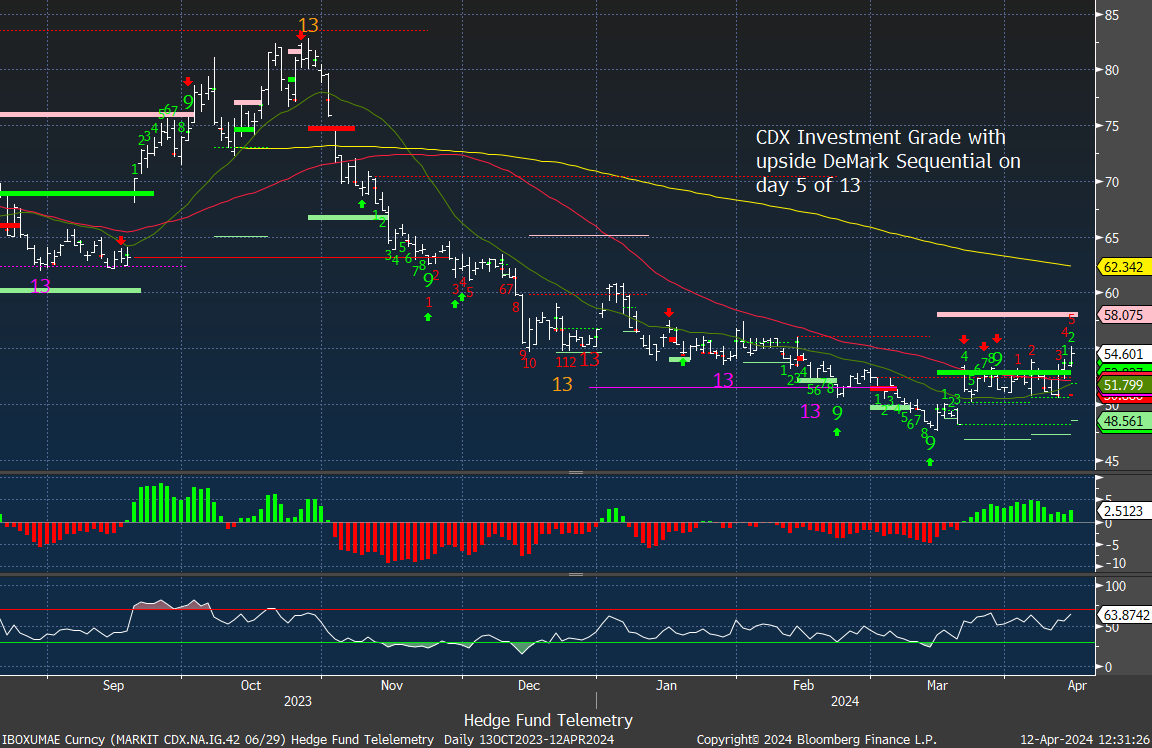
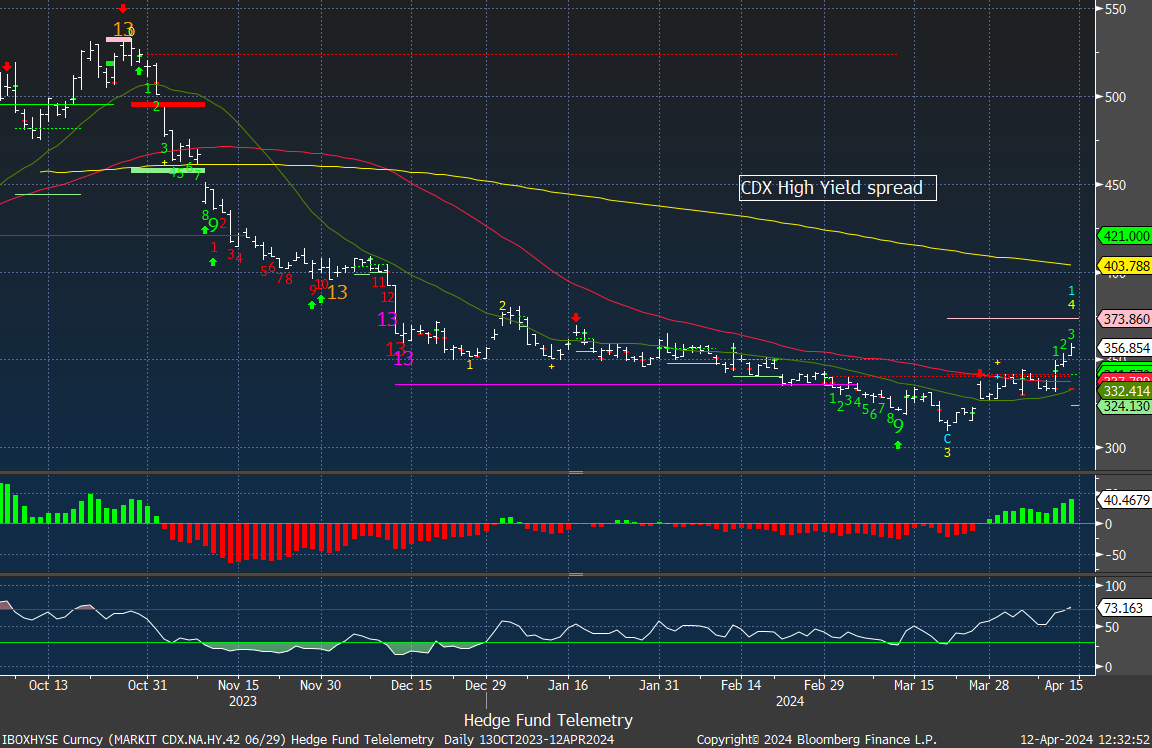
CDX credit spreads for investment grade and high yield are moving in the wrong direction if you’re bullish equities. This is a concerning look if this starts to trend.
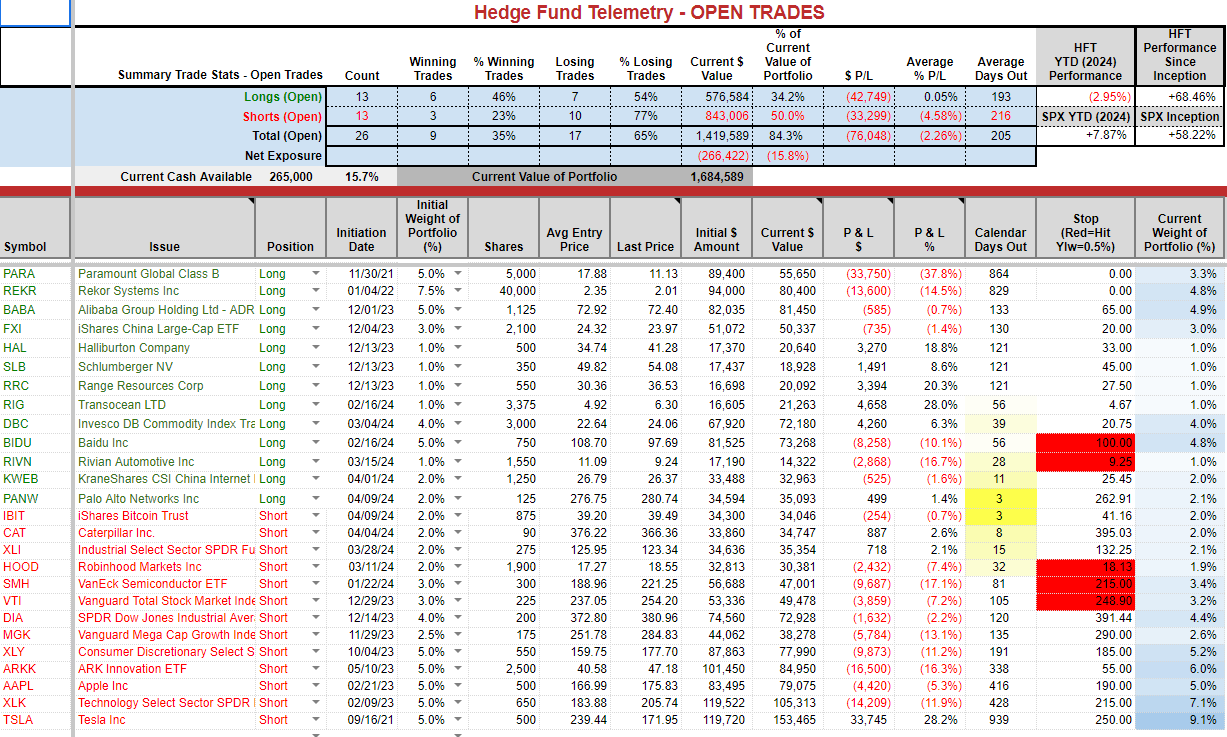
Trade Ideas sheet
Pre changes
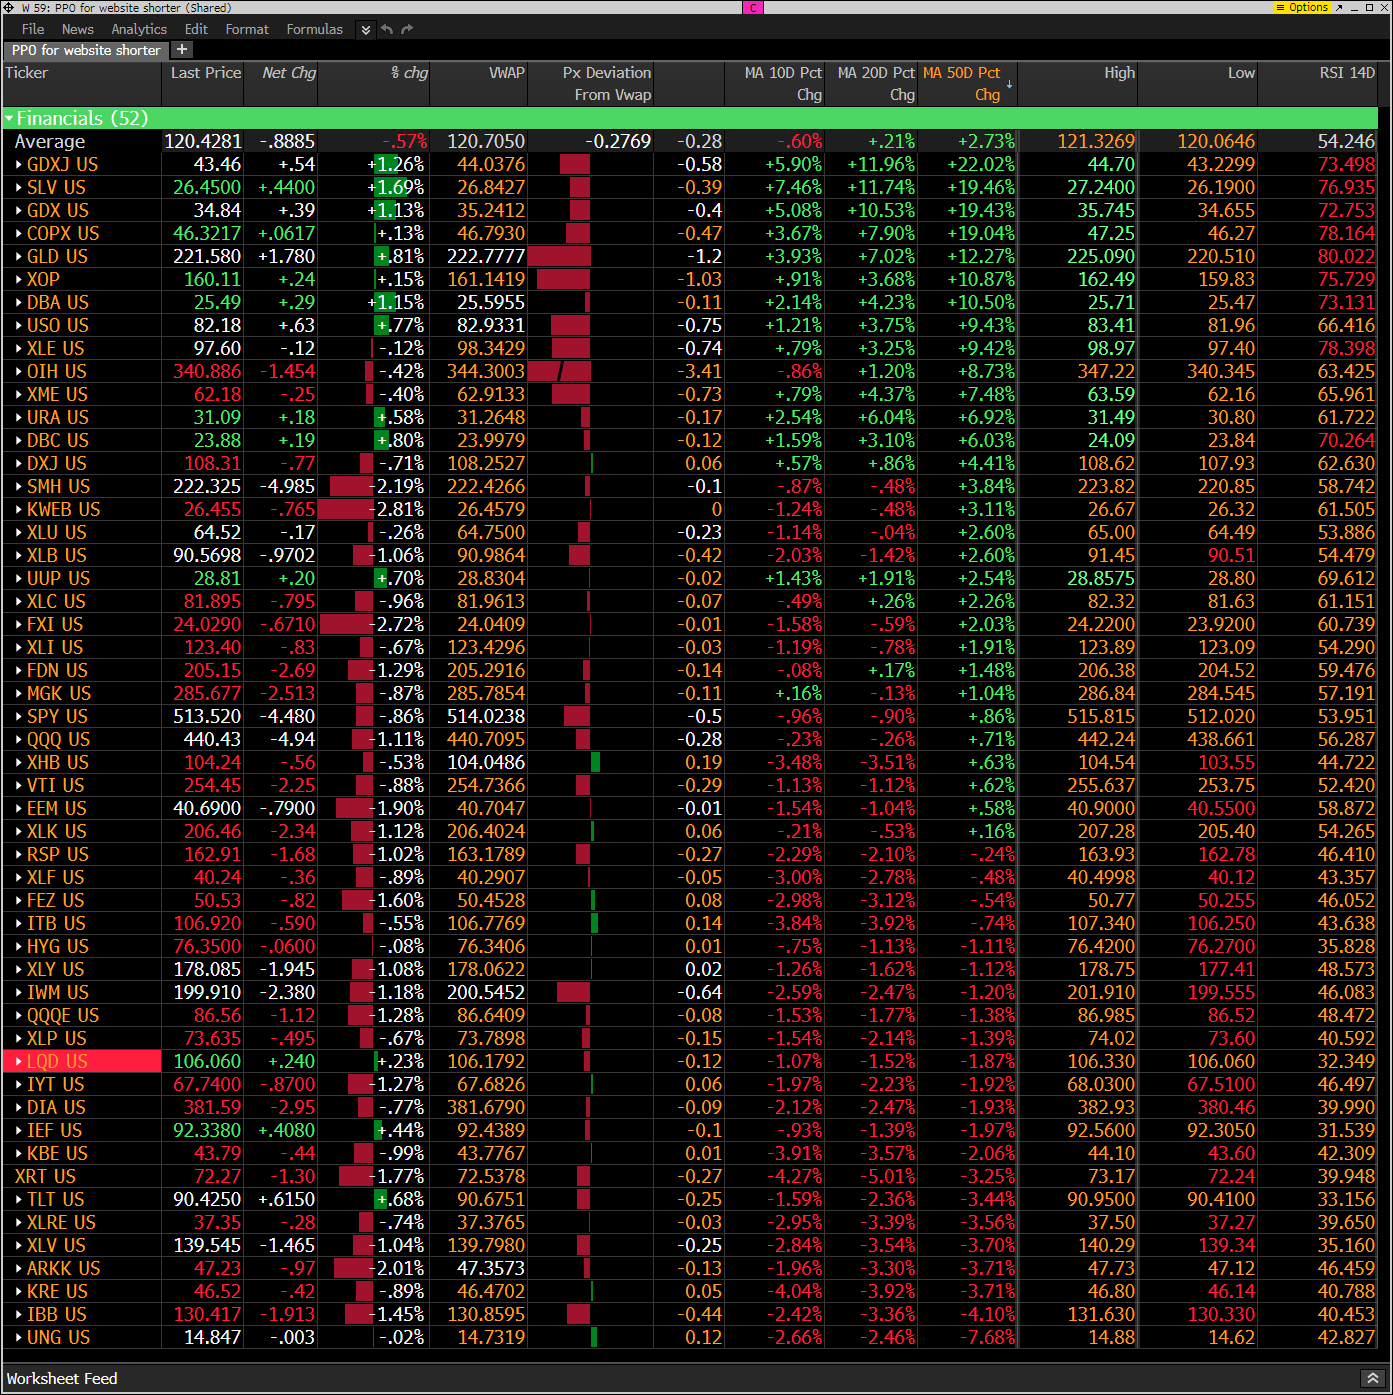
Hedge Fund Telemetry ETF Percentage Price Oscillator Monitor
The PPO monitor (percentage price oscillator) force ranks ETFs by percentage above/below the 50-day moving average. For information on this monitor, please refer to this primer. This monitor and others are offered to Hedge Fund Telemetry subscribers on Bloomberg. Reversal off highs with those ETFs with miners, silver, gold, energy, commodities still green but well below today’s VWAP levels.
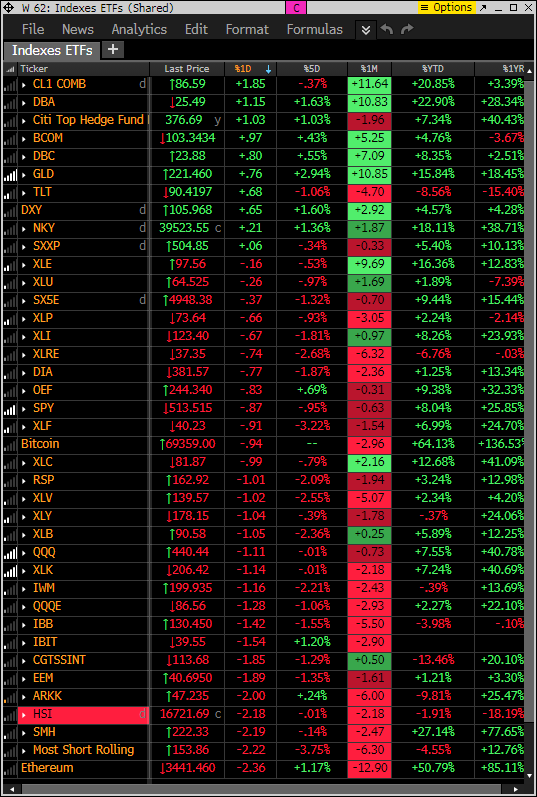
Index ETF and select factor performance
This monitor with various markets and factors ranks today’s performance with 5-day, 1-month, and 1-year rolling performance YTD. Weak action with most below both the 5 day rolling and now 1 month rolling period.
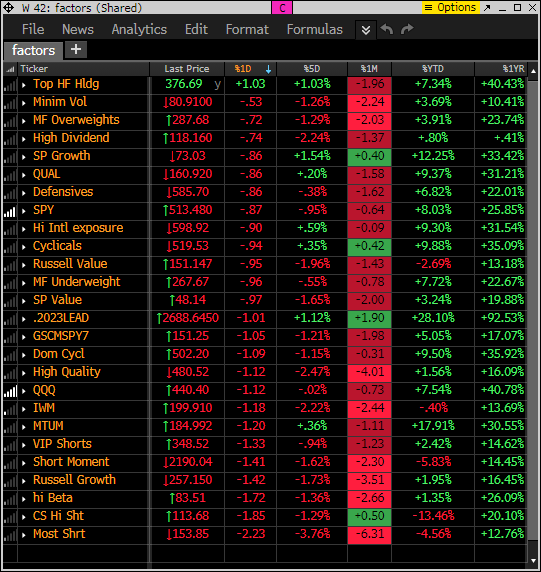
This is a similar monitor with major ETFs. This shows the commodity-related ETFs leading. Several ETFs are now down on the year: TLT, XLRE, XLY (!), IWM, IBB, ARKK
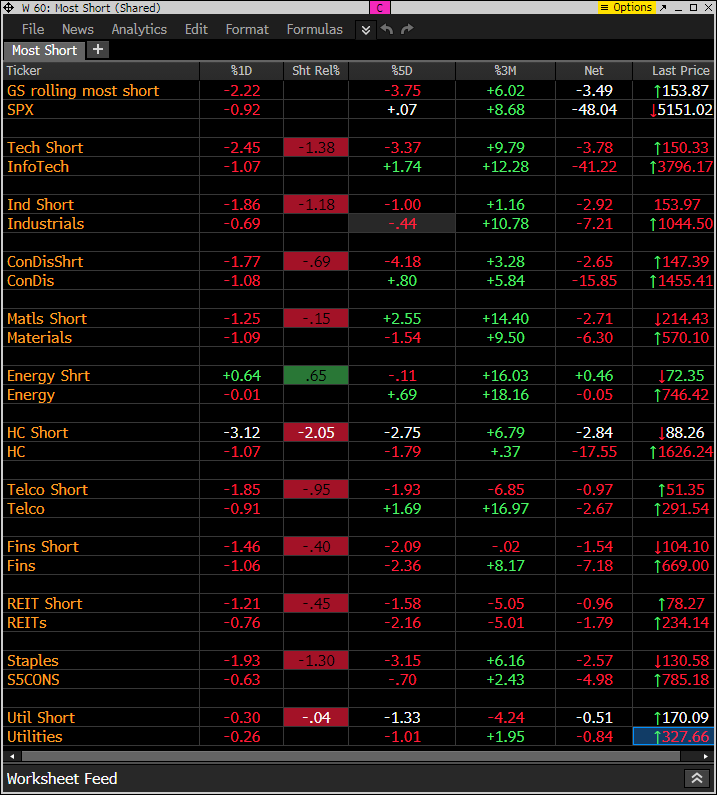
Goldman Sachs Most Shorted baskets vs. S&P Indexes
This monitor has the S&P indexes and the Goldman Sachs most shorted baskets. Short baskets are lower on the day along with all S&P sectors. Energy short basket is up and Energy sector flat on day.
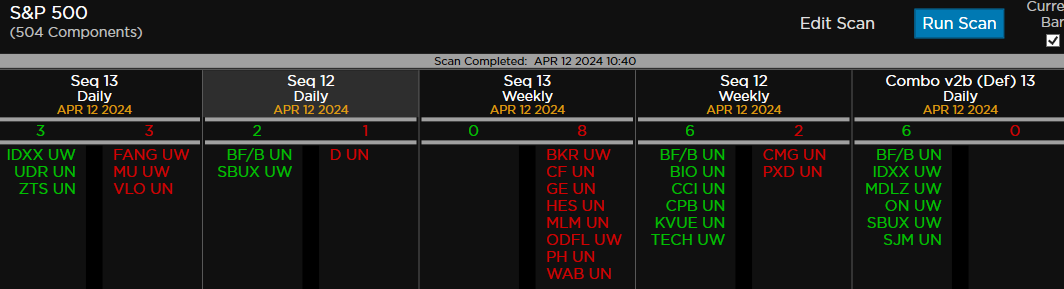
DeMark Observations
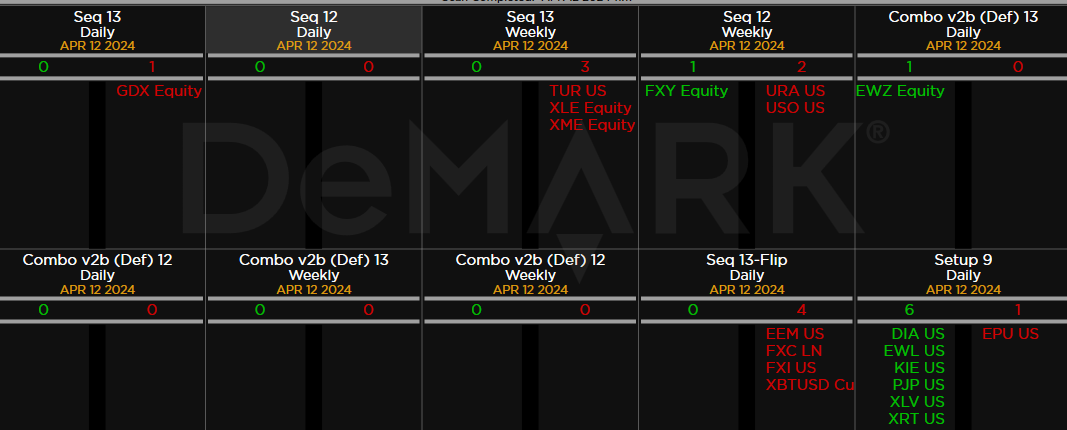
Within the S&P 500, the DeMark Sequential and Combo Countdown 13s and 12/13s on daily and weekly periods. Green = buy Setups/Countdowns, Red = sell Setups/Countdowns. Price flips are helpful to see reversals up (green) and down (red) for idea generation. The extra letters at the end of the symbols are just a Bloomberg thing. Worth noting: As I have mentioned there have been a number of sell Countdown 13’s within the energy sector and why I took recent gains. Not seeing price flips down yet which is a little strange however there are a lot of buy Setup 9’s. If there is continuation next week then expect these to start Sequential Countdowns.
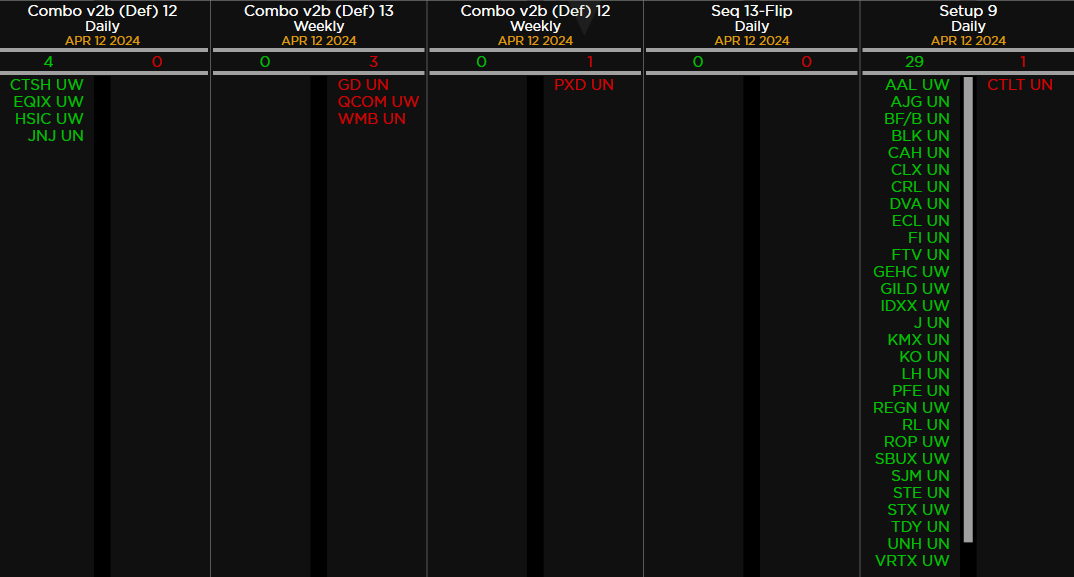
Major ETFs among a 160+ ETF universe. GDX Gold Miners now with Sequential sell Countdown 13.
If you have any questions or comments, please email us. Data sources: Bloomberg, DeMark Analytics, Goldman Sachs, Street Account, Vital Knowledge, Daily Sentiment Index, and Erlanger Research