
Quick Market Views
Stocks: Choppy action intraday. A bit different from the last week as breadth is negative with NYSE down 1300 issues and Nasdaq down 850 issues. Short baskets are not seeing squeezing as in recent days too. I keep hearing how Tesla is up after earnings were not as bad as feared. They were pretty bad, and the stock is up on more Elon Musk fantasies. The price reaction was better than feared is more like it. The business is under severe pressure, and nothing was said that will eliminate the weak sales trends. I was a bit nervous heading into the report as wrote. After this bounce, the weaker sales trends will trickle out and send this lower again. I have some earnings previews below with a couple of ideas.
I was asked to be in Real Vision’s Daily Briefing later today so this will be the last note for the day. It’s on YouTube live at 4pm ET.
Bonds: Rates are higher across the curve with 2’s down earlier now flat. 10’s are up 5bps and 30’s are up 6bps. The 2/10 spread has been moving and is now -28bps.
Commodities: Energy is weak with Crude down 1% and Natural Gas down 5.5%. Copper is up 0.7%, Gold and Silver flat.
Currencies: US Dollar index is up 0.15% but the news is the Yen weak again at 1990 lows vs USD. USDJPY now at 155.31. Bitcoin is down 2%.
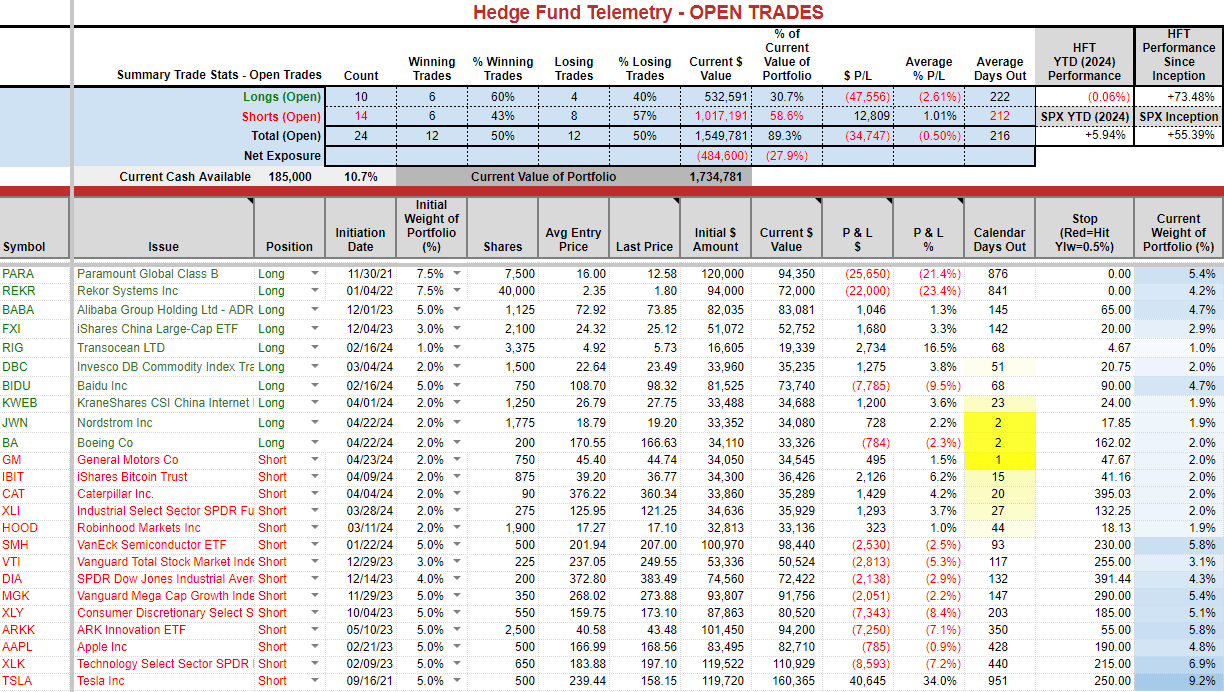
Trade Ideas Sheet:
Changes: If you were quick and smarter than me you sold the BA earlier when it was up 4%. I’ll hold this a little longer and see if it can bounce in the coming days.
I will add two new small short ideas with earnings: 2% weight IBM; 1% weight UNP.
Thoughts: META’s earnings will matter to the markets and I have no strong view as it has another high bar heading into earnings. Tesla stock doing Tesla things we’ve seen too many times over the years. If you bought that put spread, it’s a zero. I wasn’t overly excited about it and why I chose a narrow 10 point spread.
US Market Indexes and Sentiment
Here is a primer on how we use Daily Sentiment Index charts. Bond, currency, and commodity sentiment are posted on the website.
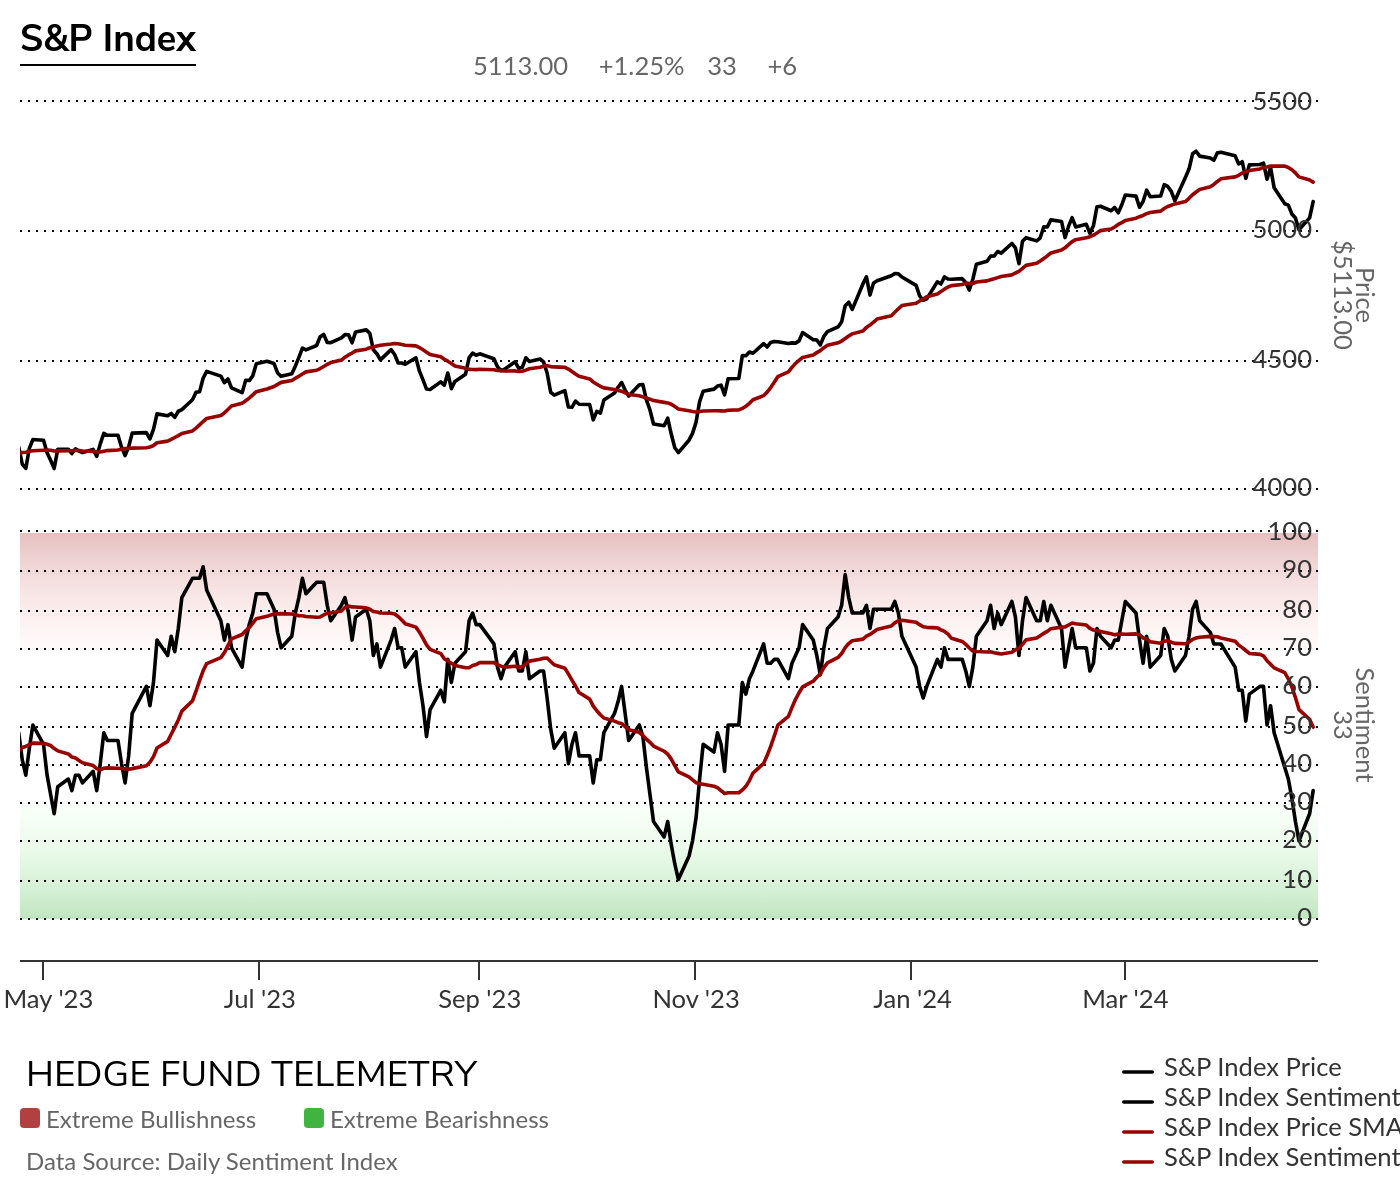
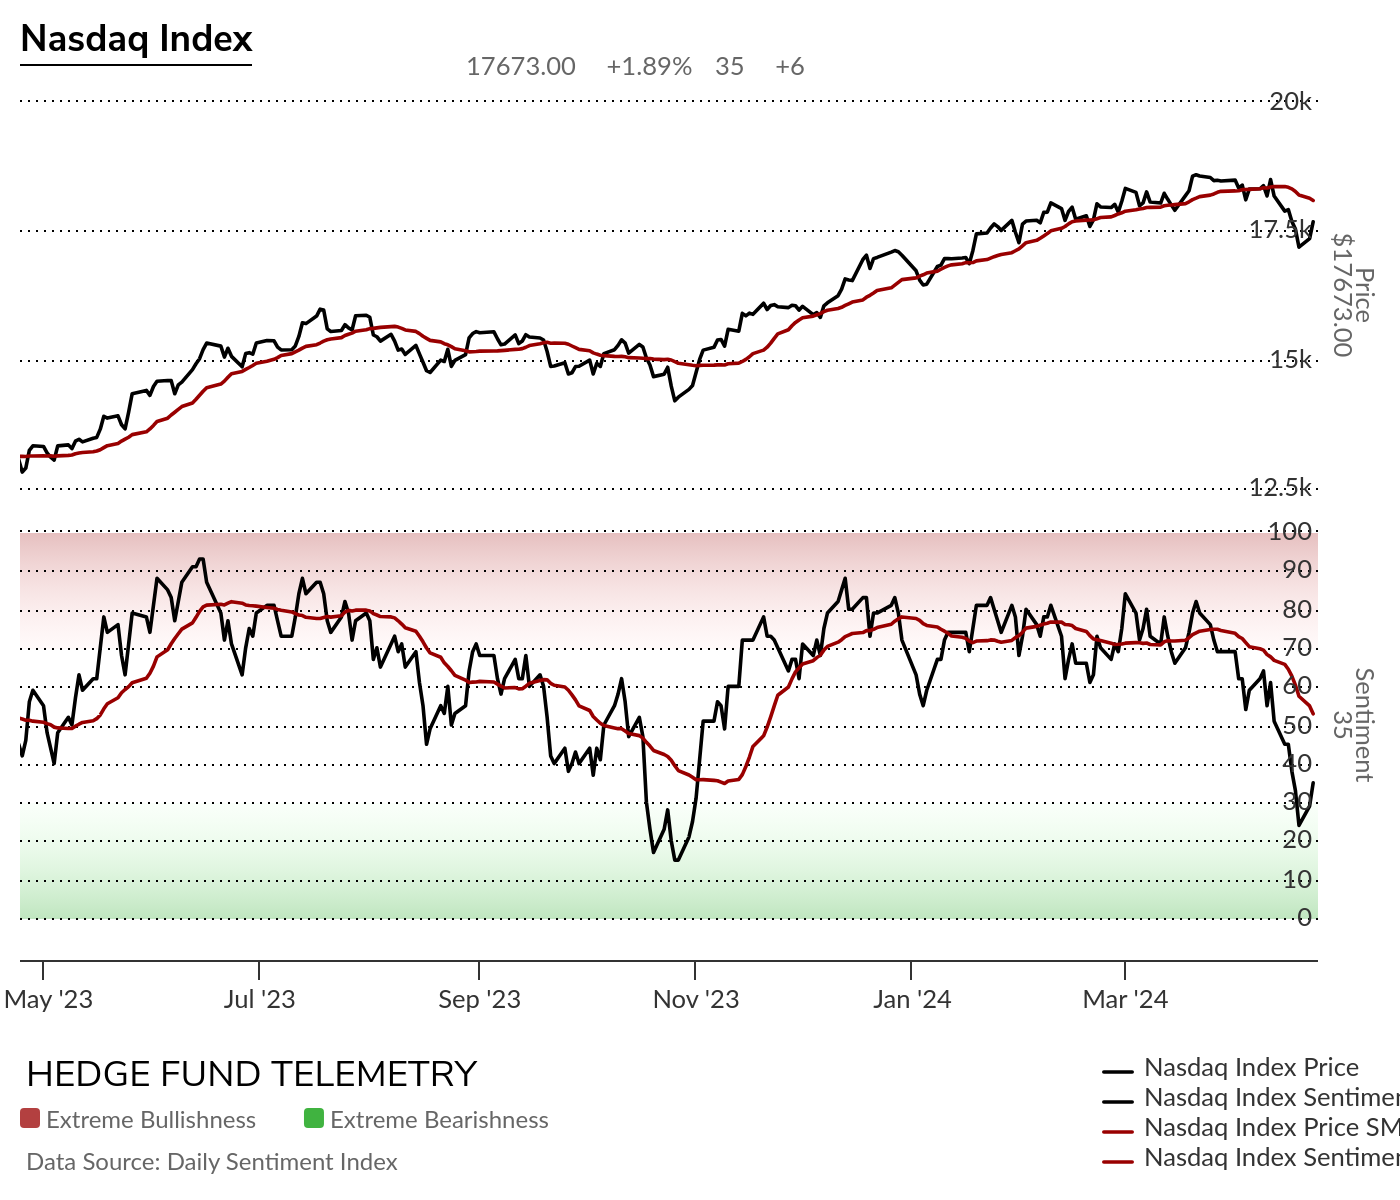
S&P bullish sentiment and Nasdaq bullish sentiment bounced again after moving into oversold zone. The delta between the sentiment data and the 20 day moving average was very wide. I suggested a mean reversion was possible. It might even lift more making another lower high with sentiment.
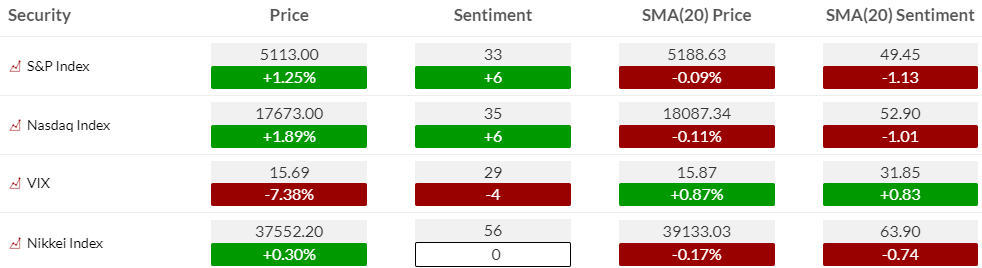
S&P and Nasdaq bullish sentiment was oversold. I do not expect a V bottom like October rather it could spend some choppy action around or below 50%.
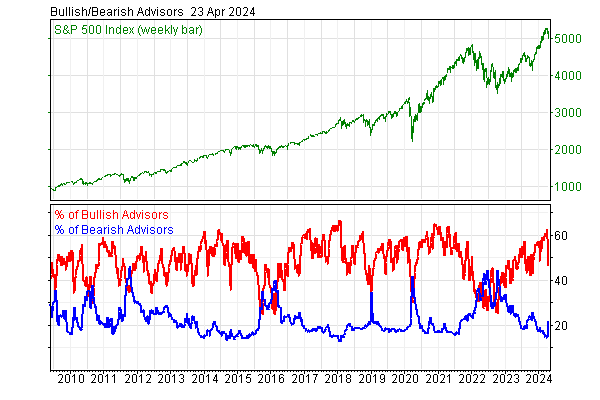
Investors Intelligence Newsletter Survey: No surprise reversing lower after peak levels.
The bulls plunged to 46.2%, from 56.5% last issue. That is a major shift from the end of March when the bulls were 62.5%. That high since summer 2021 pointed to elevated danger of a retreat, and high risk. The bears jumped to 21.5%, from 14.5% the previous two weeks. Before that, 14.1% was the fewest bears since just 12.6% late January 2018.
The best longer term buying opportunities occur when the bulls and bears cross.
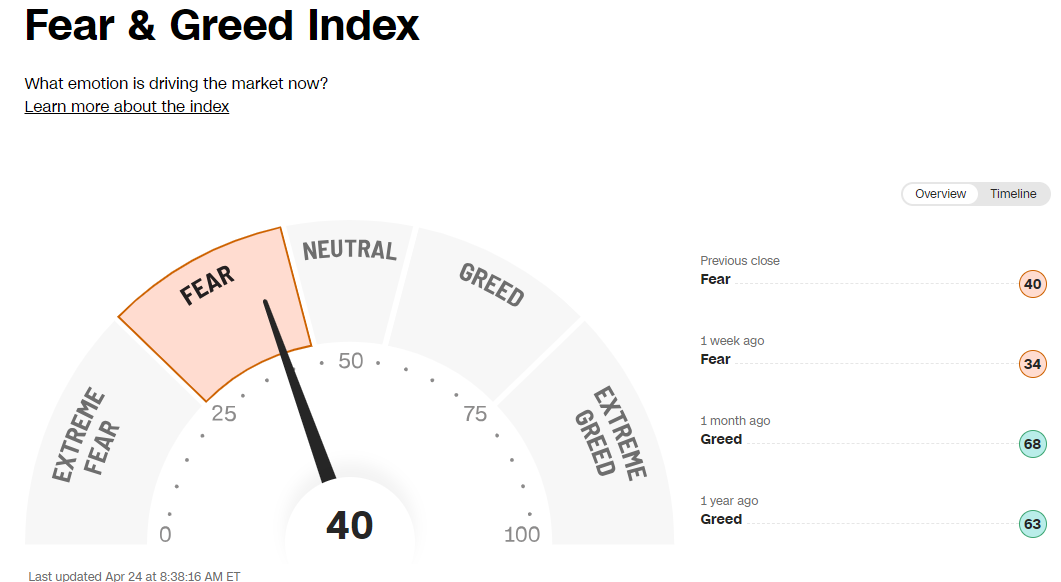
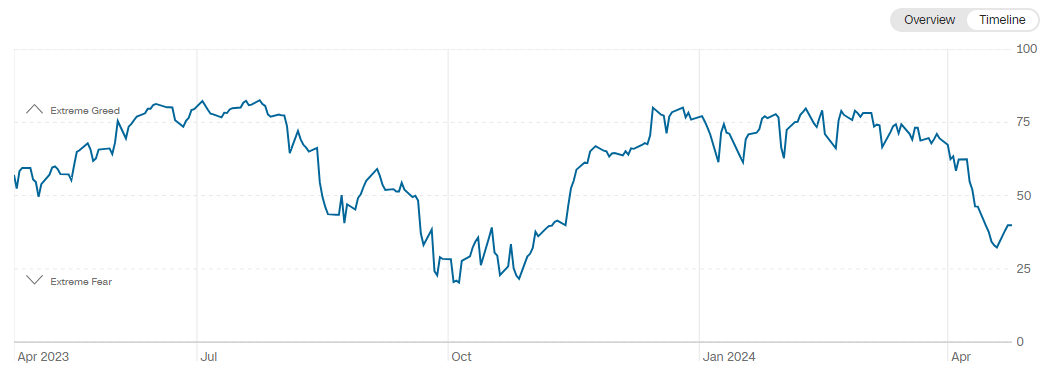
CNN Fear and Greed Index – I like this index as it shows with seven market indicators what traders are doing rather than what they say about the markets. Like the Daily Sentiment Index data, we show each day, this has moved lower and bounced, although this did not get to October lows.
Here is a primer on the DeMark Setup and Sequential indicators.
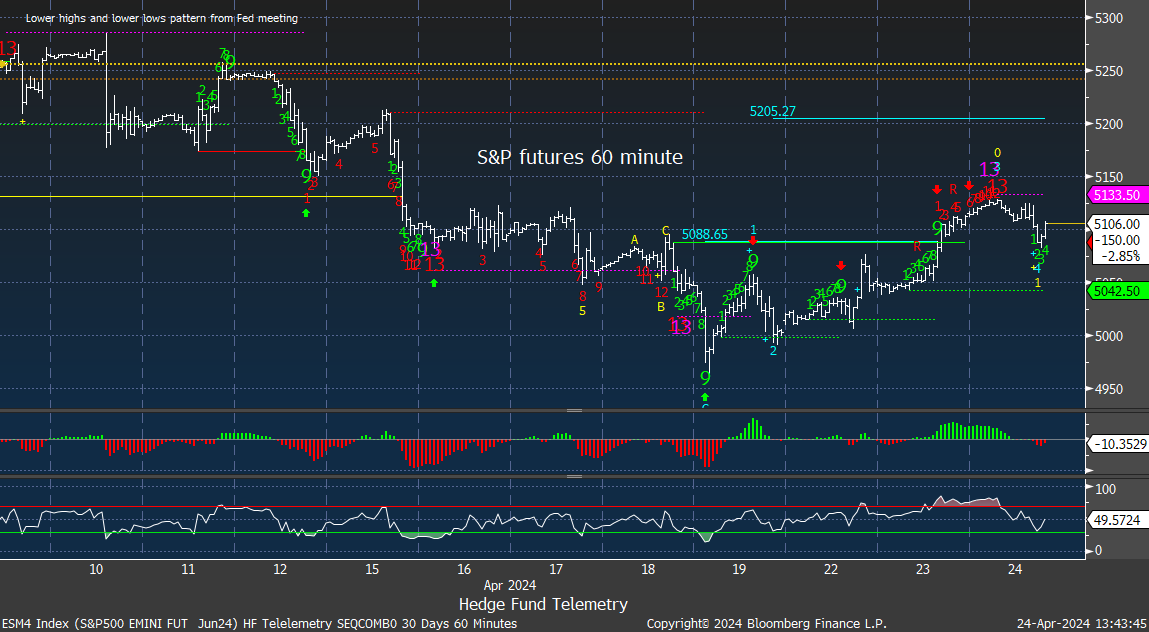
S&P futures 60-minute tactical time frame pausing after recent DeMark sell Countdown 13’s.
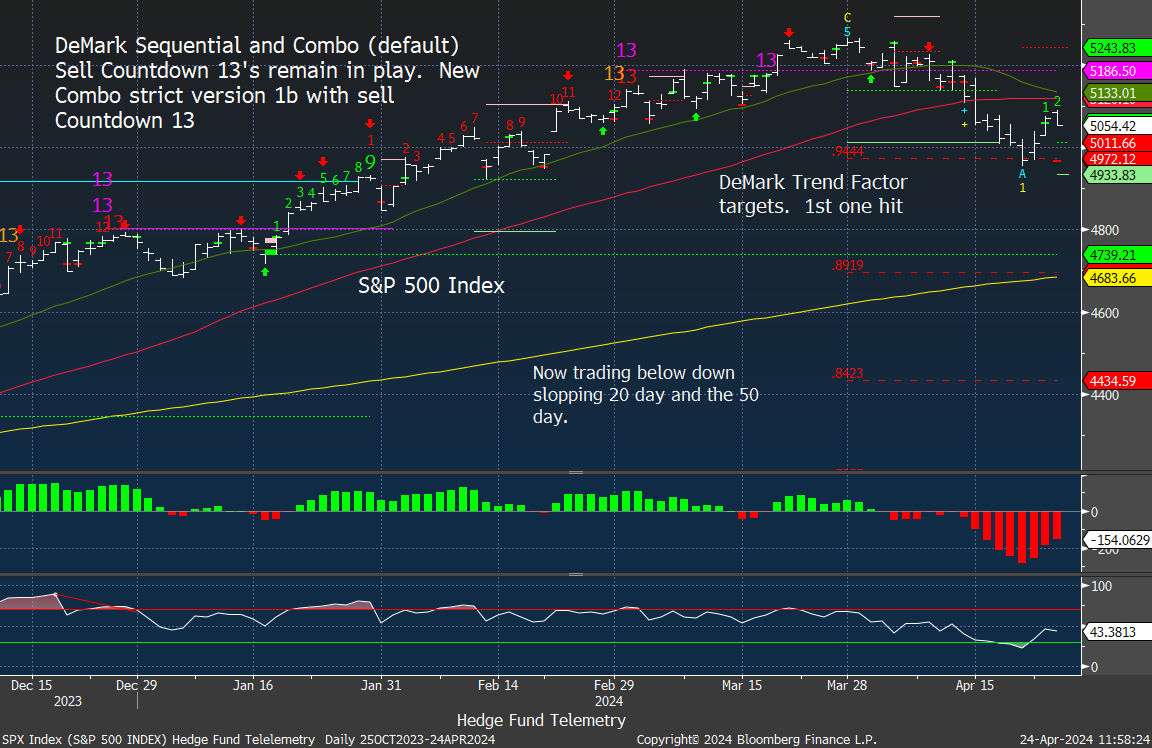
S&P 500 Index daily bounce pausing today
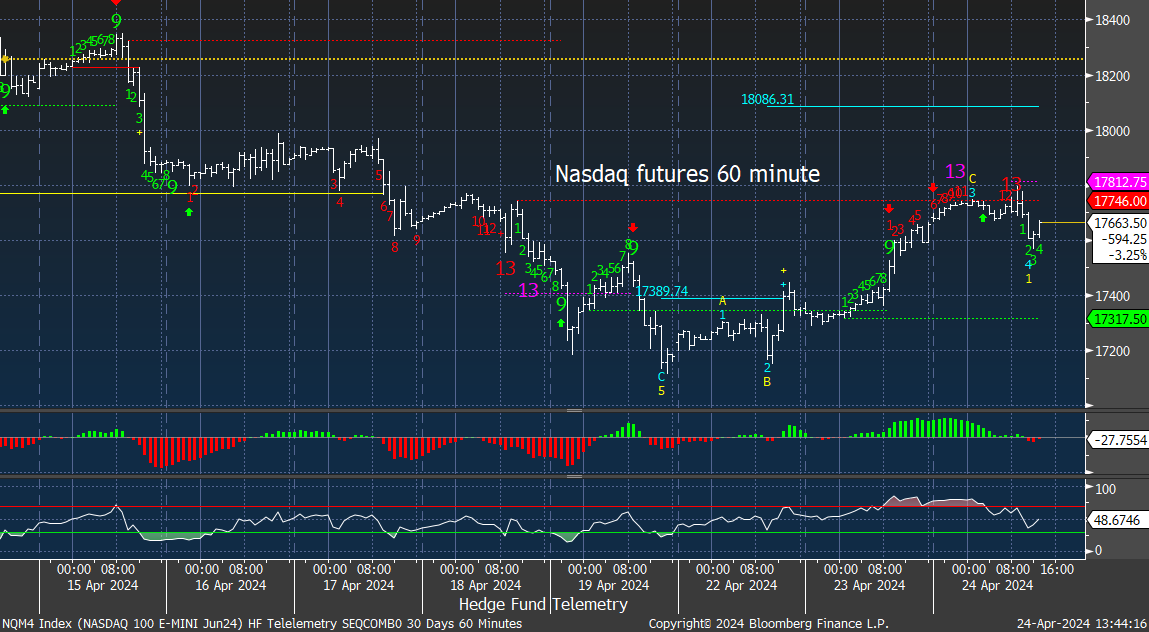
Nasdaq 100 futures 60-minute tactical time frame pausing after recent DeMark sell Countdown 13’s
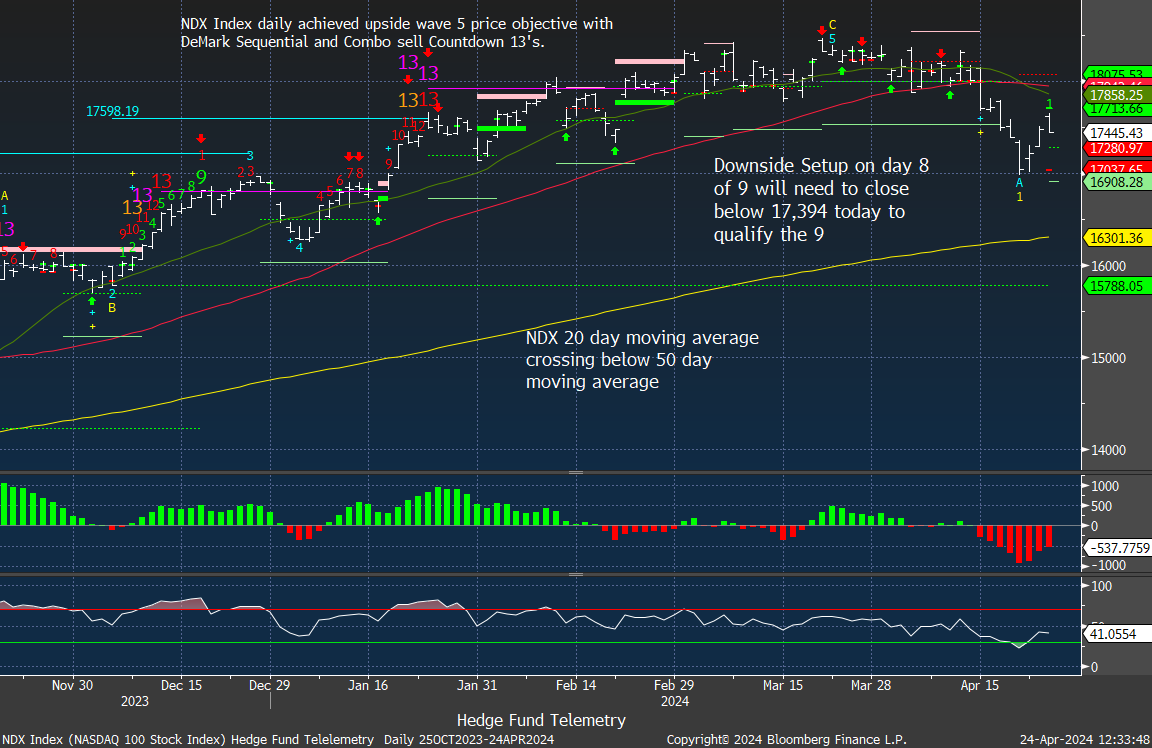
Nasdaq 100 Index daily bounce pausing
Trade Ideas Sheet
Pre changes.
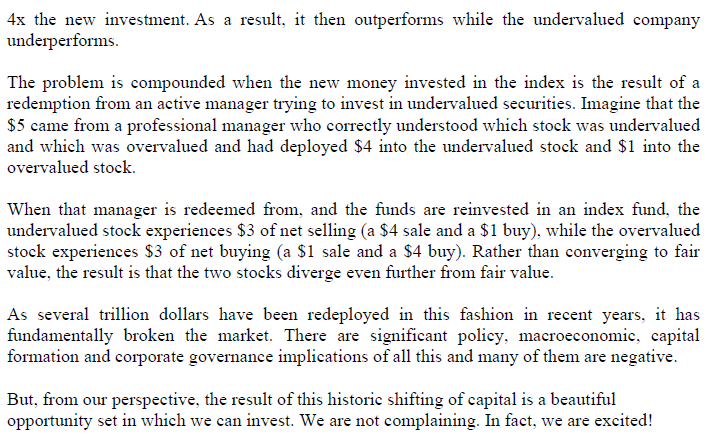
Greenlight letter on passive investing
David Einhorn of Greenlight Capital has been outspoken about passive funds and this from their letter today is a good kindergarten summation of why passive funds have broken the markets.

earnings previews
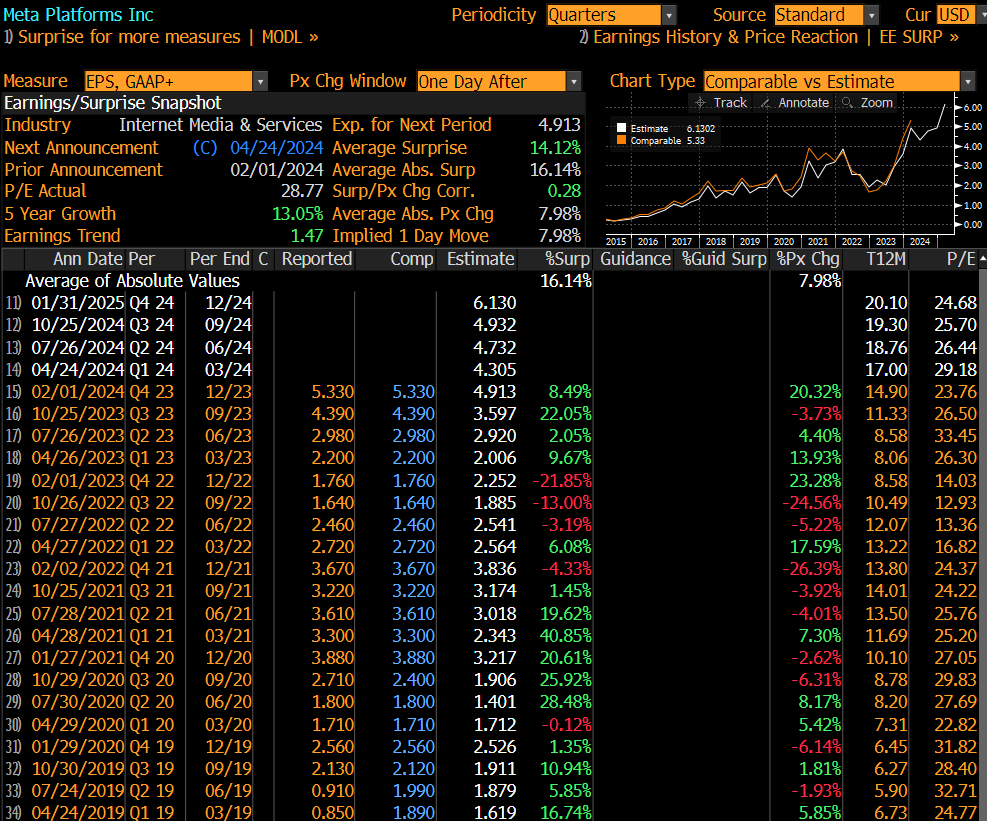
META is the big report later today and despite the topping looking chart I will not be participating in this one as last quarter even with a small sized short I didn’t expect the move which left a mark. The bar is high as it was last quarter. 50/50 up or down. I am OK not having a strong view.
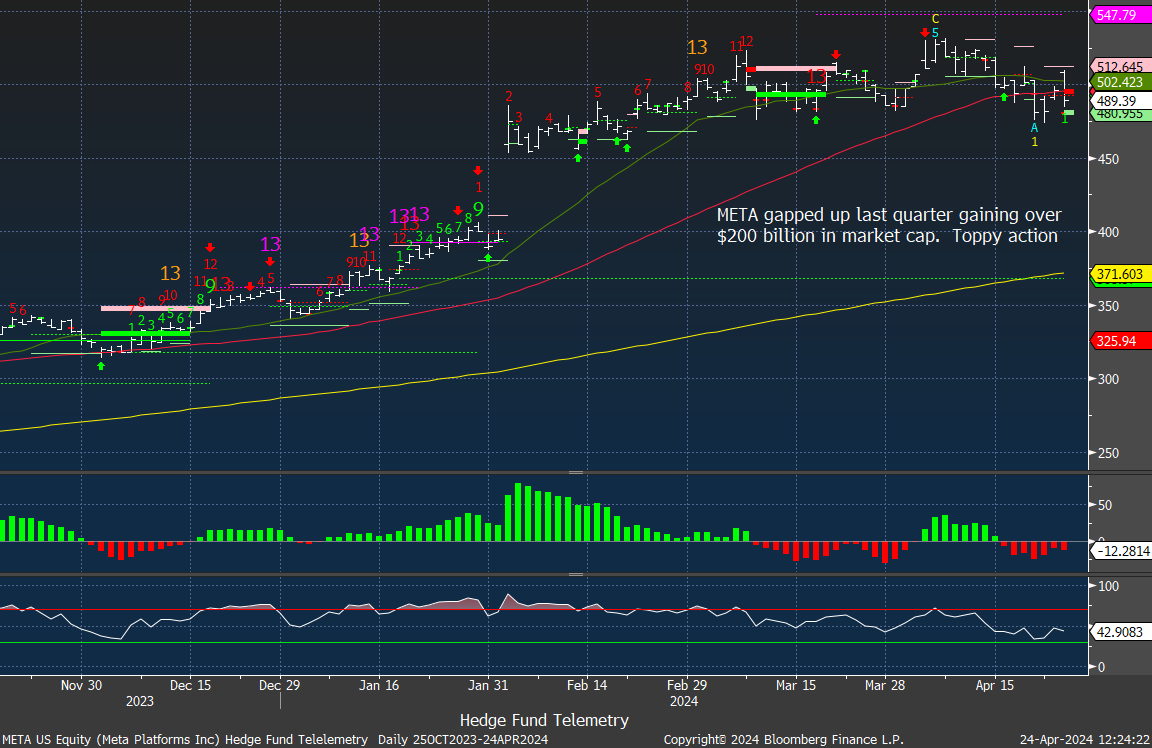
The implied move is 8%.
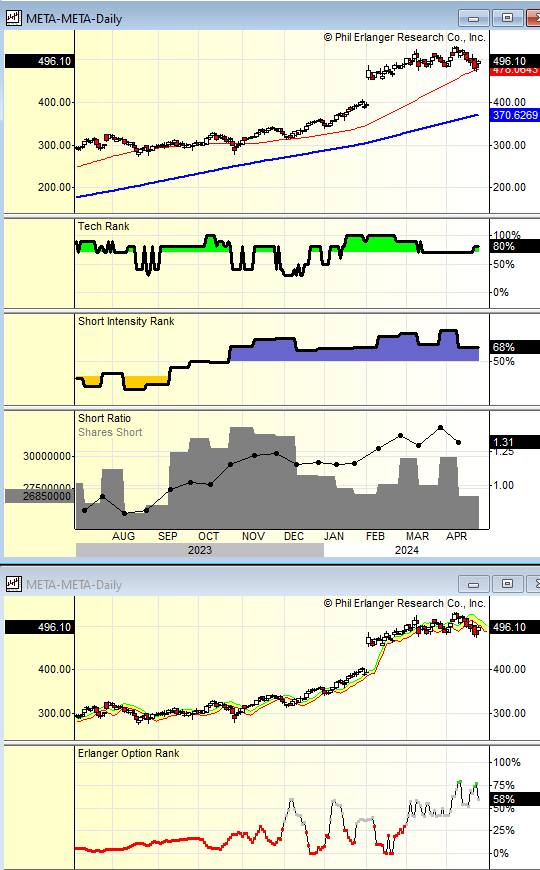
Short interest has been steady and slightly lower than the last report. 1.3 days to cover. There has been a moderate amount of put buying and on balance now neutral.
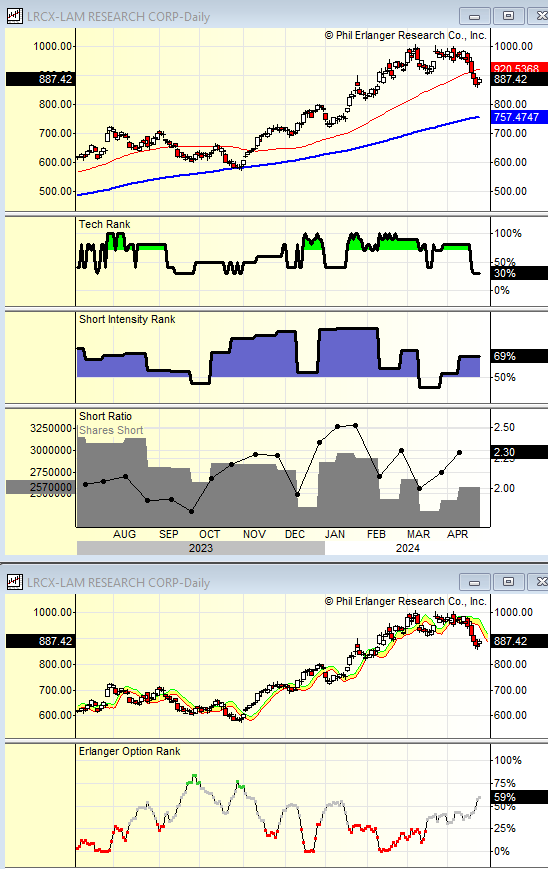
LRCX fell after the weaker ASML report as both have been big semiconductor manufacturing beneficiaries with the AI craze. I would lean short and won’t make a trade with this since I have a SMH ETF short position.
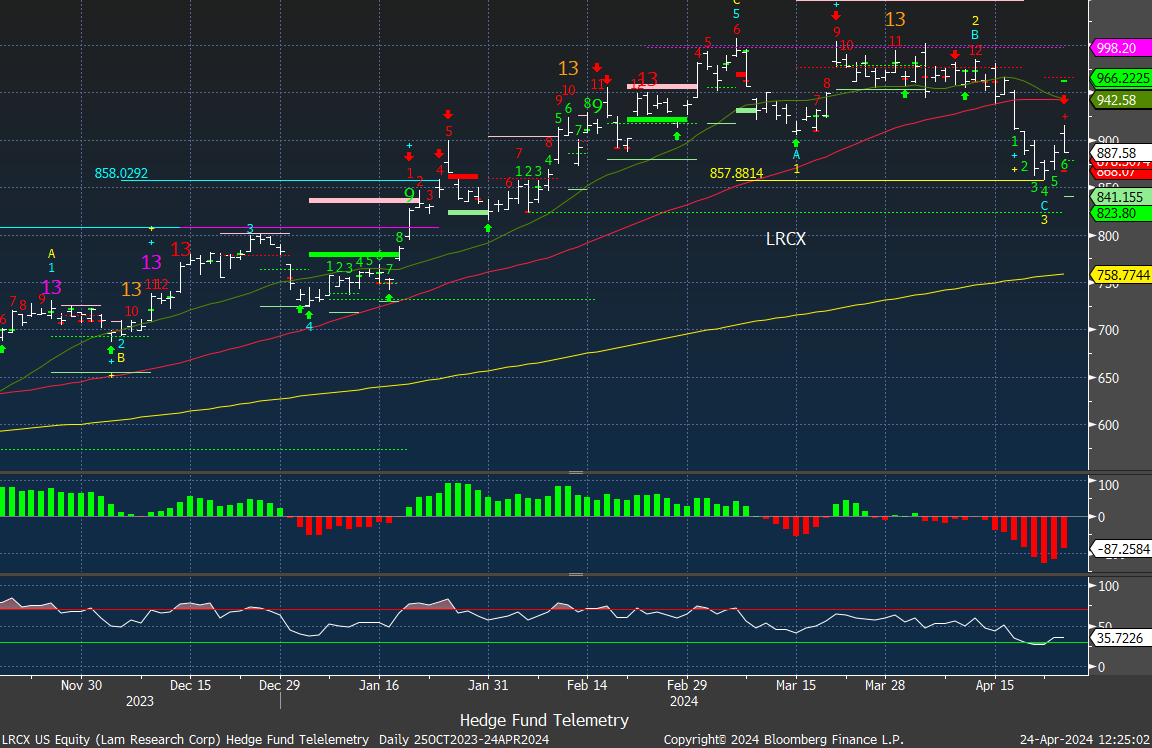
The implied move is 4.55%
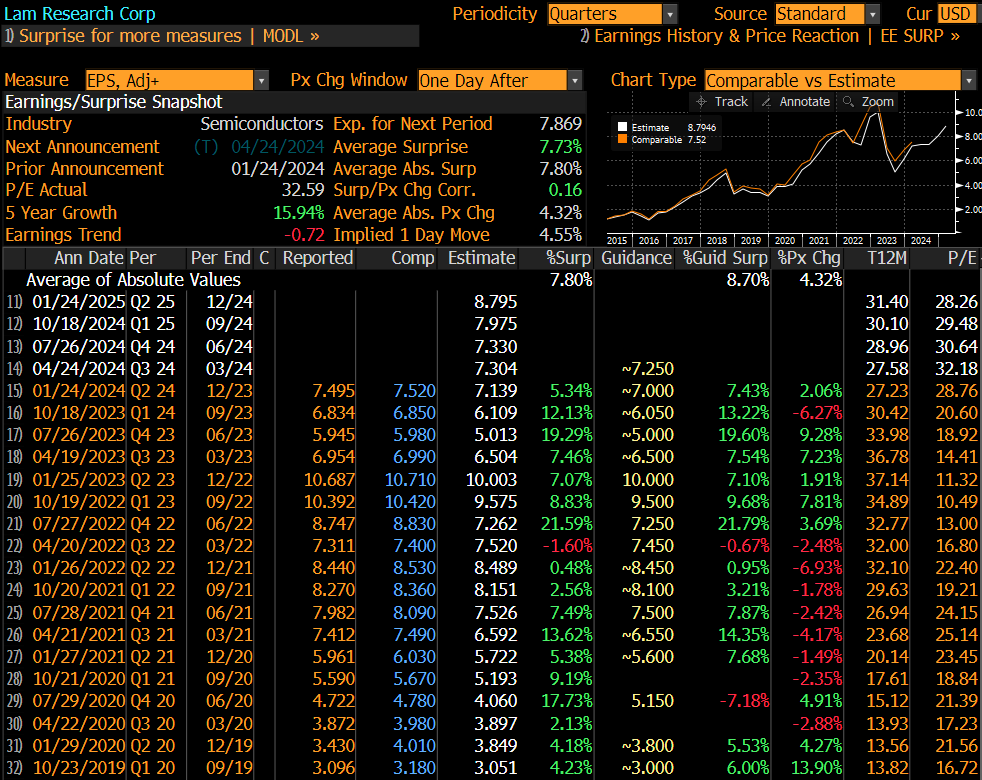
Short interest has been steady with a recent increase. 2.3 days to cover. The past heavy call buying with the red dots has moderated.
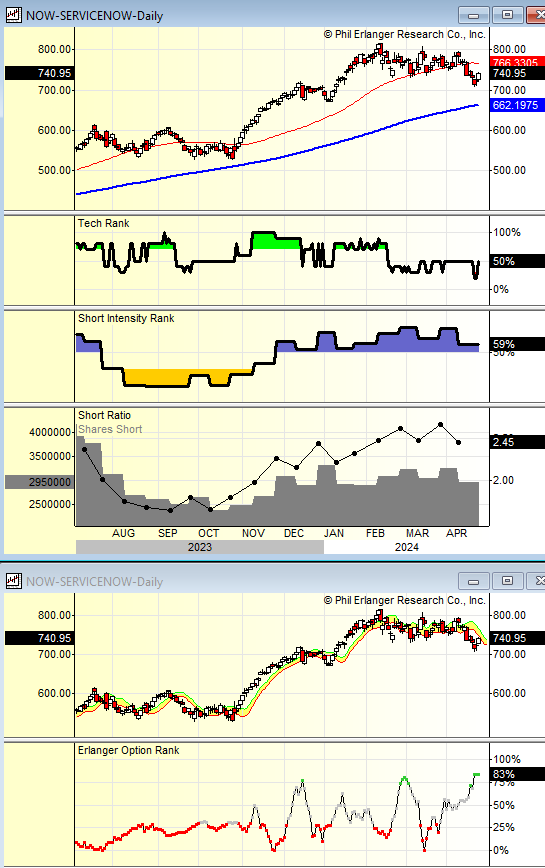
NOW Service Now has a toppy formation. with support at 730. I don’t have a strong view on this one to make a call. I would probably lean short.
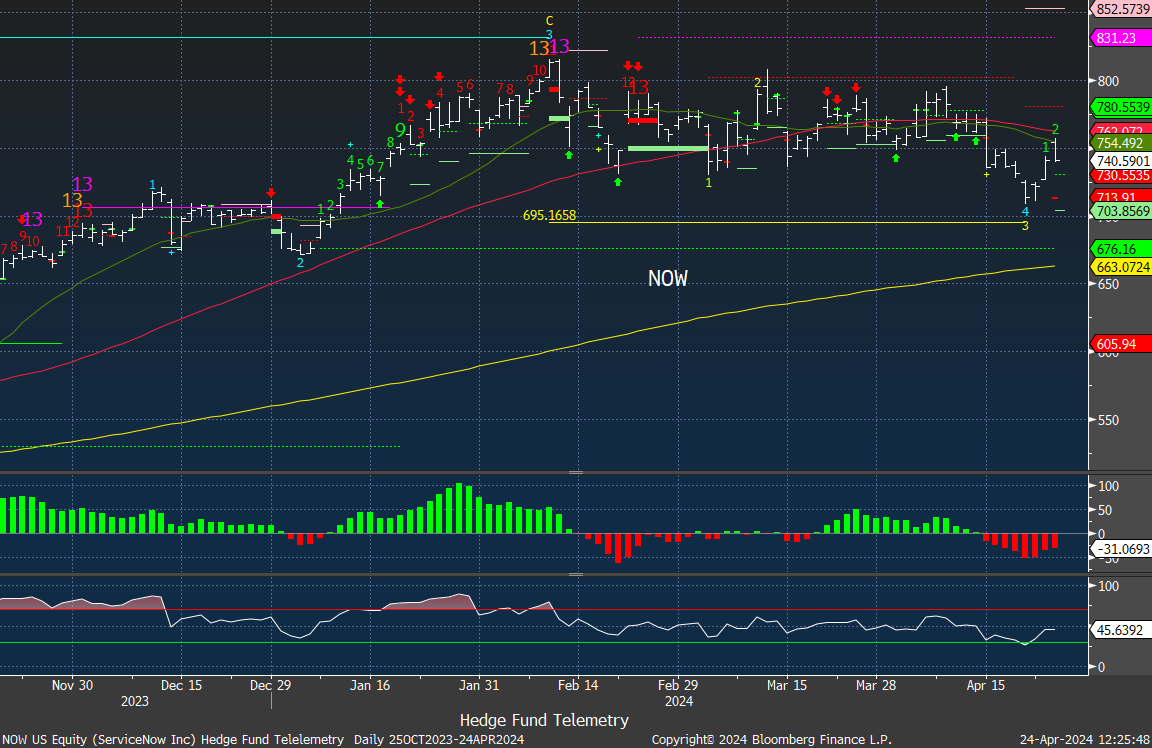
The implied move is 5.36%
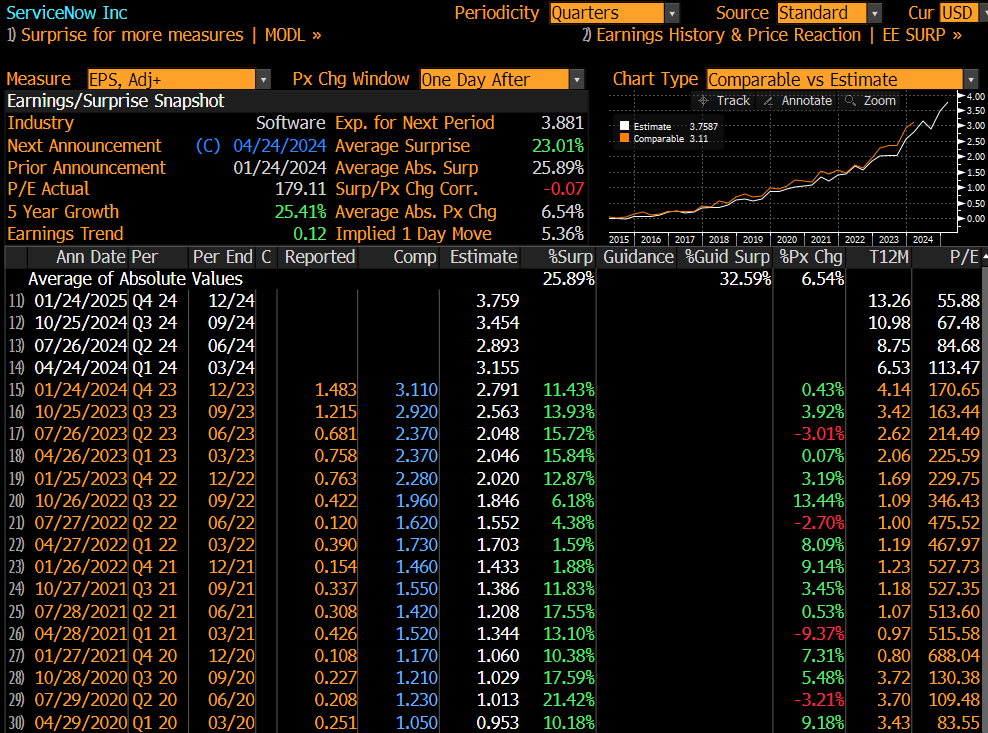
Short interest has been steady with 2.45 days to cover. On the Options Rank there is recent heavy put buying (also due to it being a 700 stock)
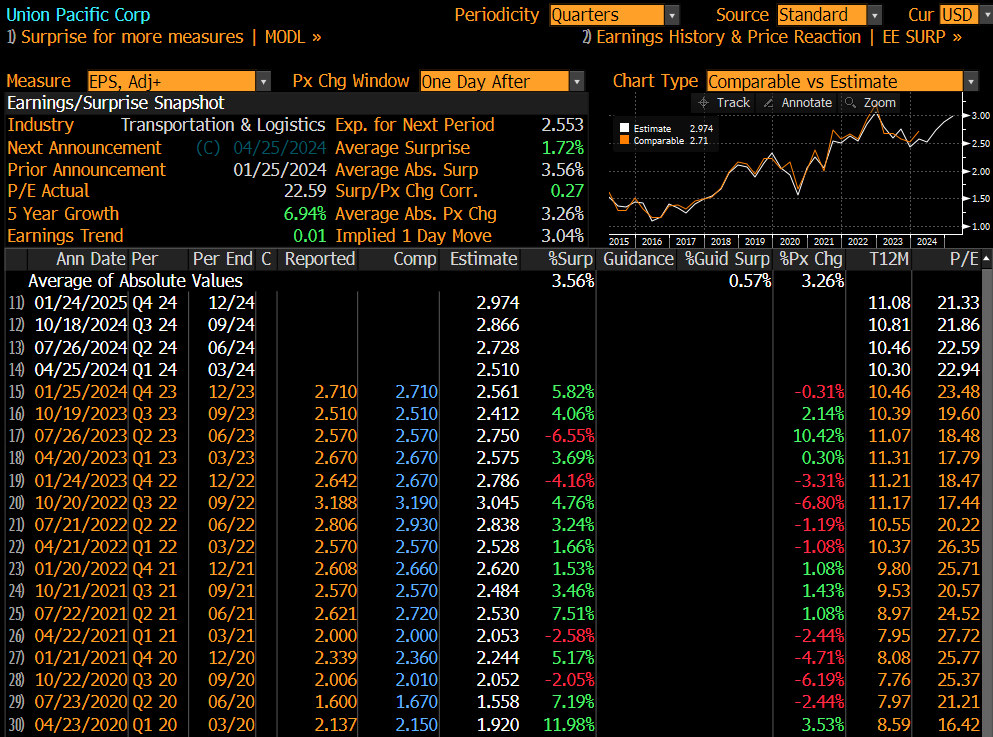
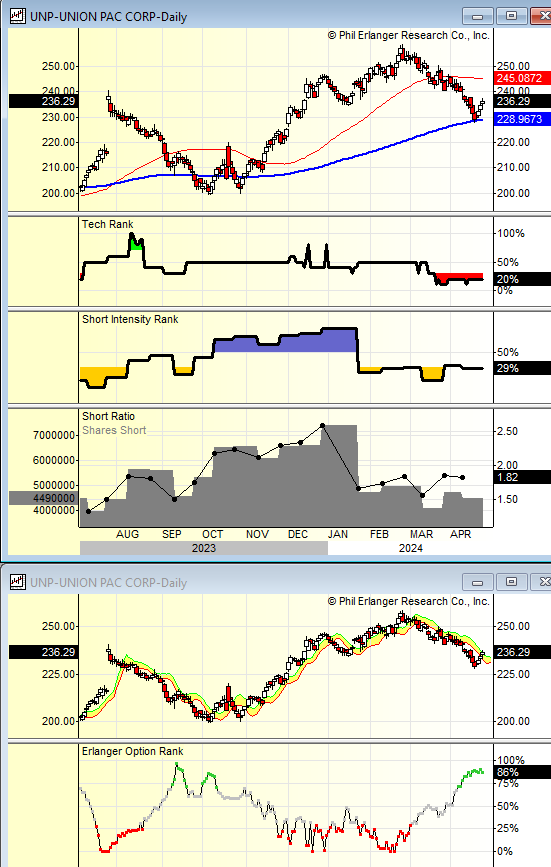
UNP, like other transports, has been fading since February. There is a downside Sequential Countdown in progress on day 5 of 13 and risk of breaking to a new low. I am going to add just a 1% sized short into this number as I see heavy put buyers, which concerns me as being too late.
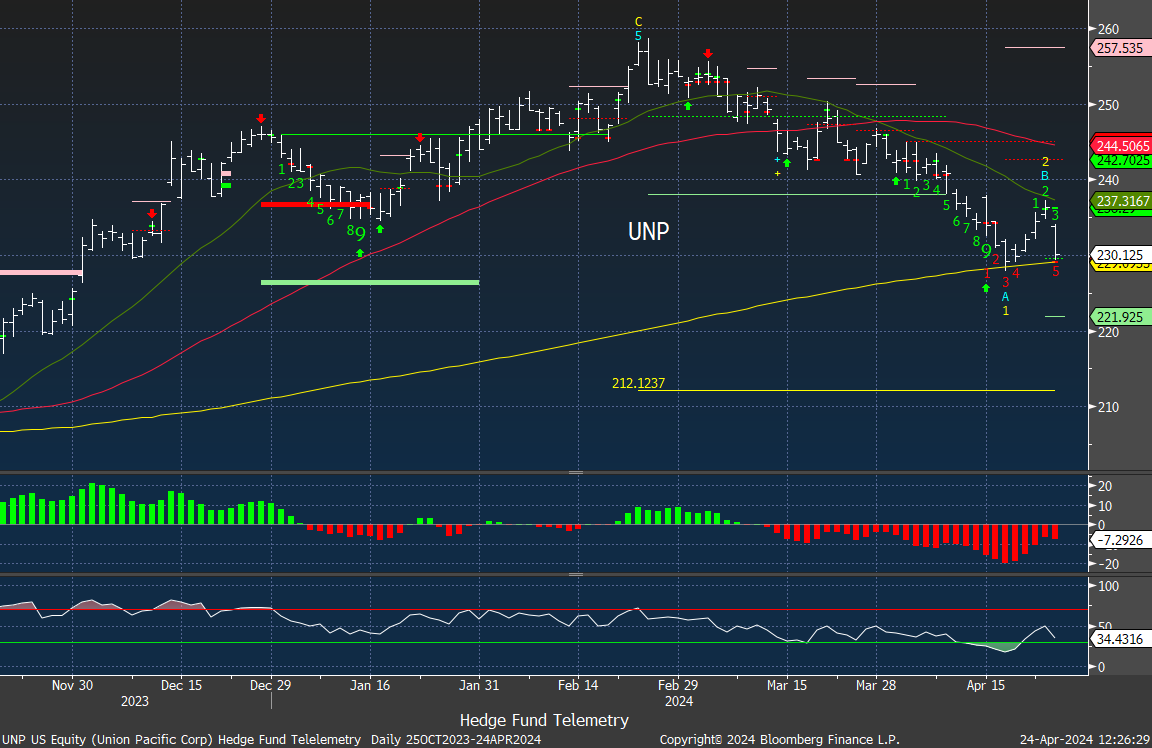
The implied move is 3%
Short interest is down this year with 1.82 days to cover. The Options Rank shows recent heavy put buying illustrated with the green dots. This has potential for a put squeeze higher.
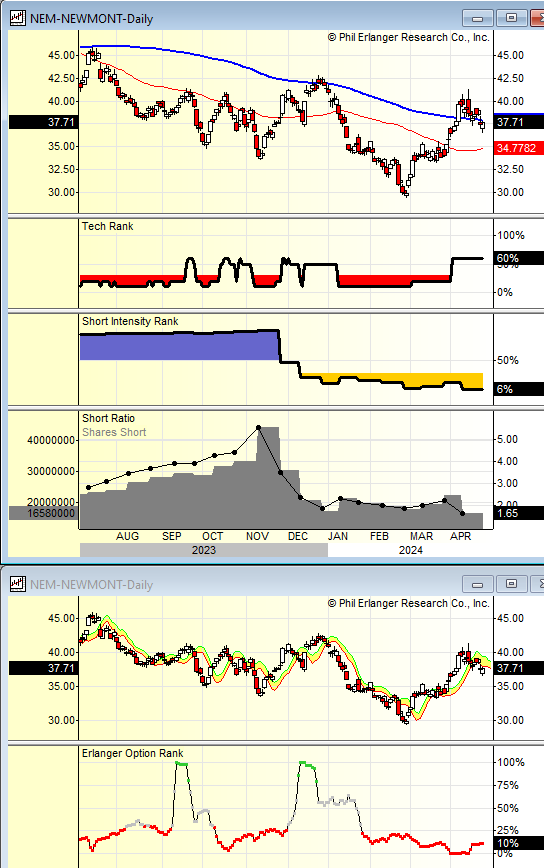
NEM has backed off with other gold miners. It’s at the 200 day and has a pending upside Sequential on day 11 of 13. Considering they tend to not trade well after earnings and short interest is low I don’t see an upside squeeze. I will sit this on the sidelines.
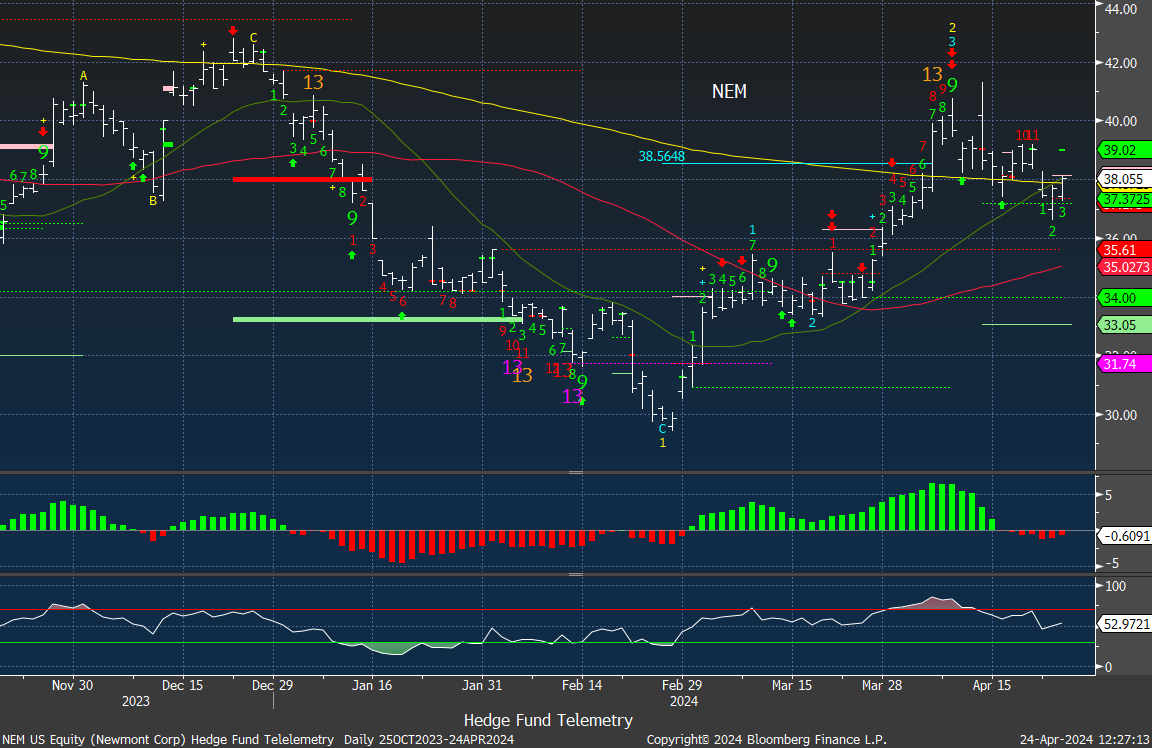
The implied move is 3.14% with more down days after earning that up.
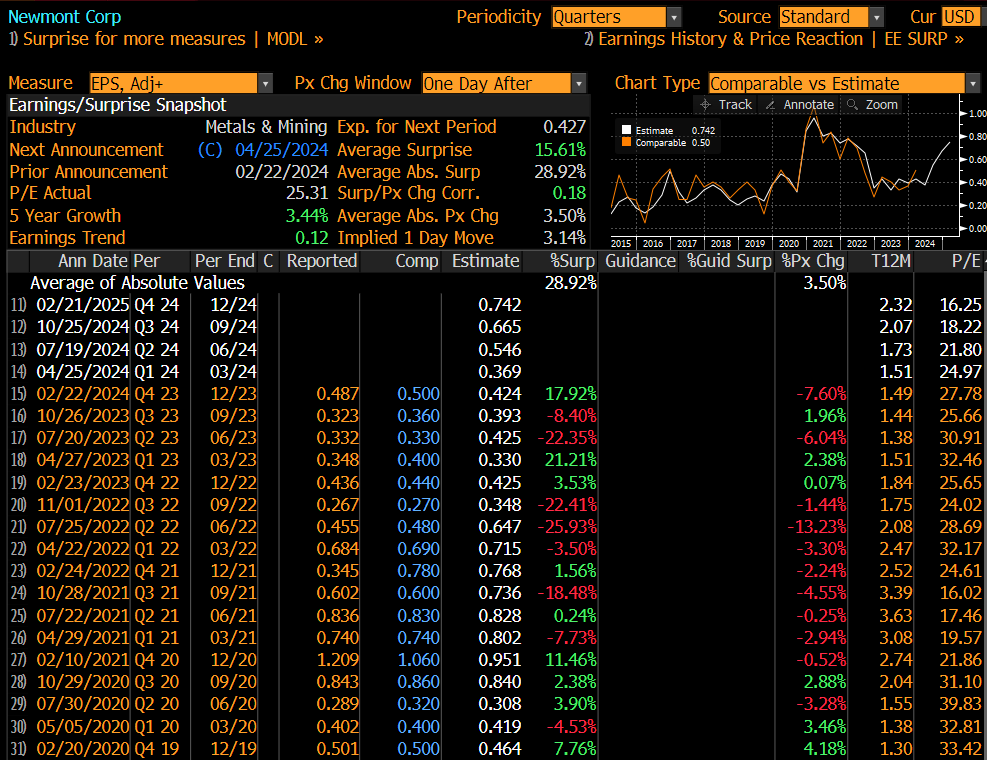
Short interest is very low with 1.65 days to cover.
The bar is high for CAT as it has moved substantially since the last report. I will stick with my 2% sized short added higher.
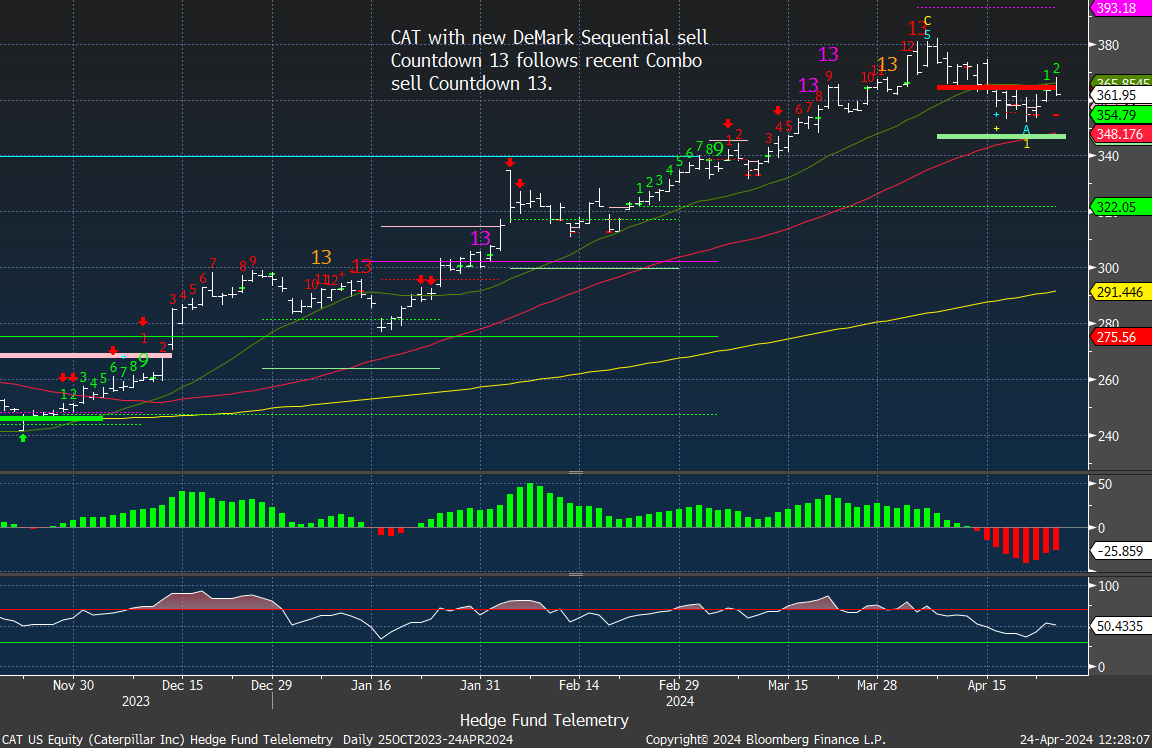
The implied move is 4.37%
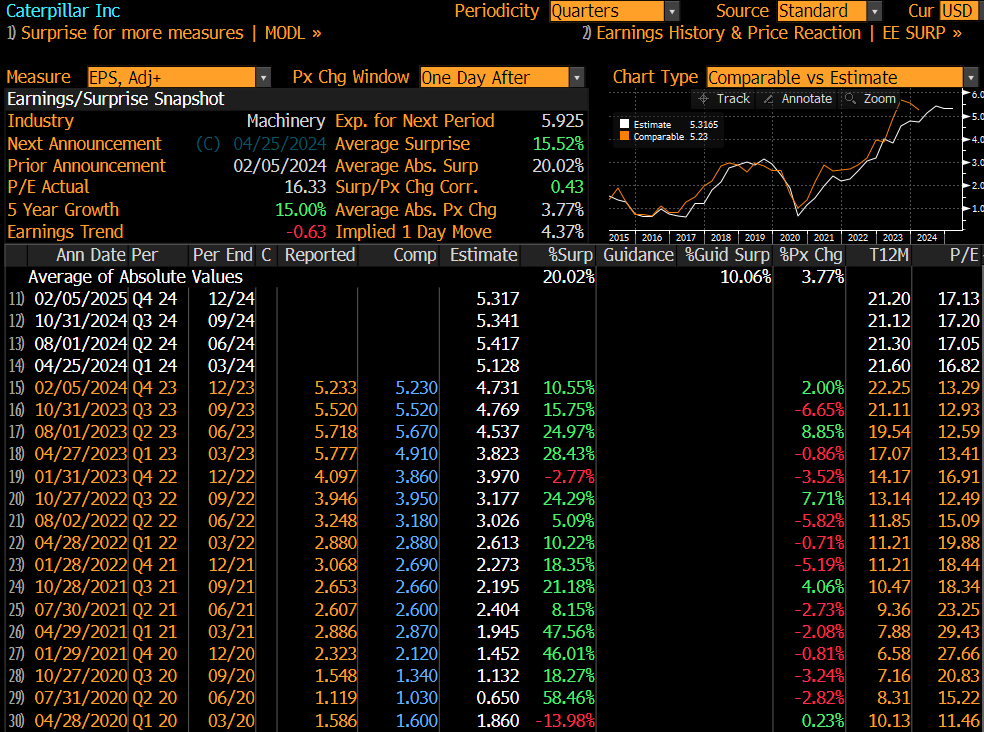
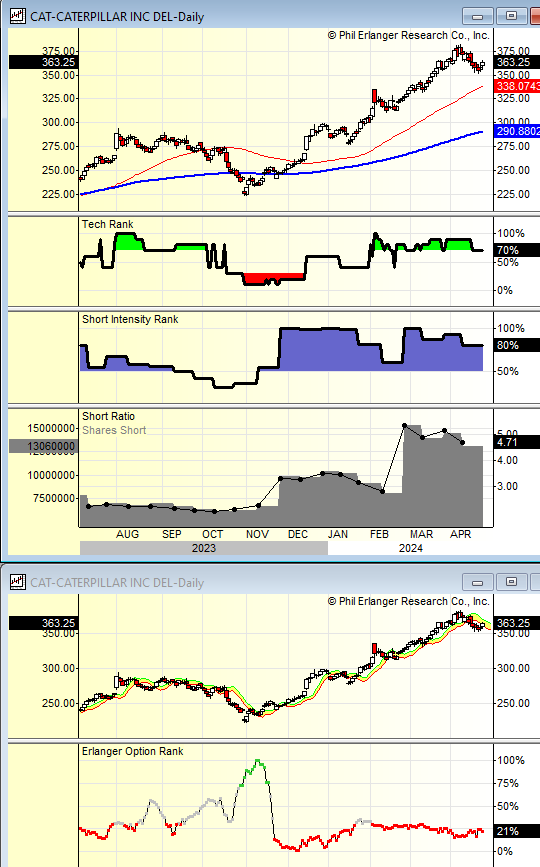
Short interest remains elevated although slightly off February highs. 4.7 days to cover is high. On the Options Rank there has been persistent call buying illustrated with the red dots.
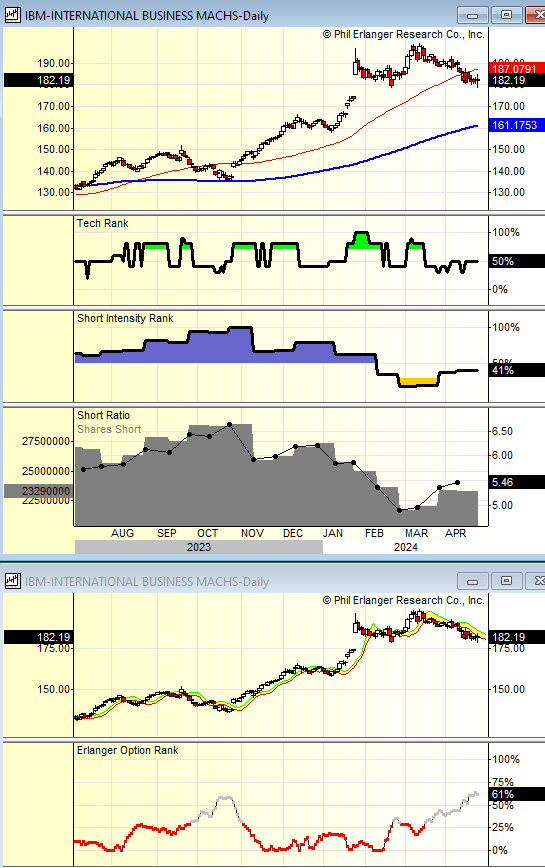
IBM is another that looks toppy after peaking near 200 with a Sequential 13. Breaking the 180 level is the risk and I will add a 2% sized short into this report.
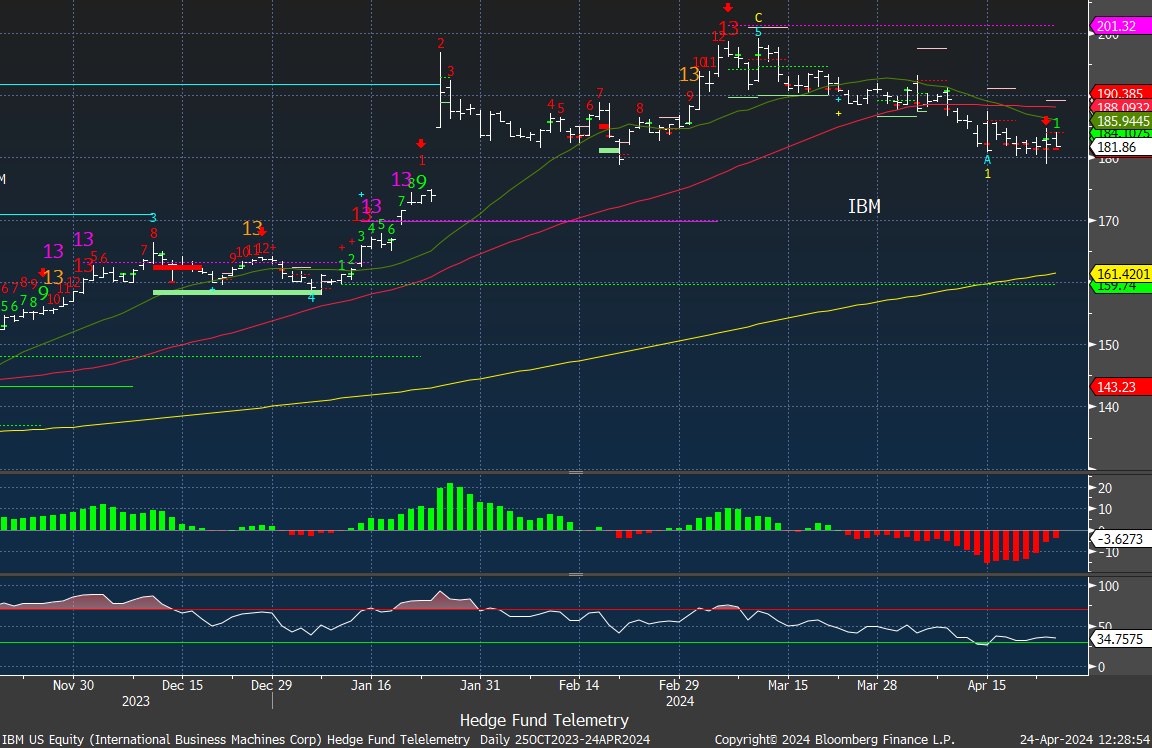
The implied move is 5.3%.
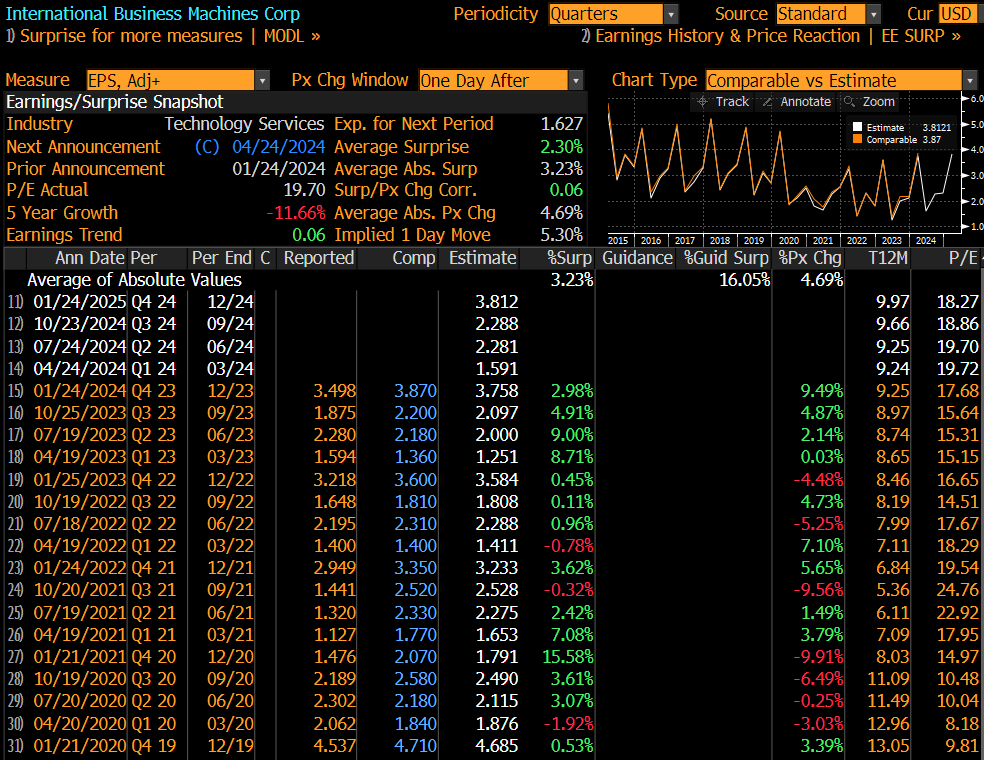
Short interest is lower than Q4 last year although the days to cover is 5.46 days. Partly due to lack of volume. The Options Rank has seen more recent put buying but it’s not heavy.
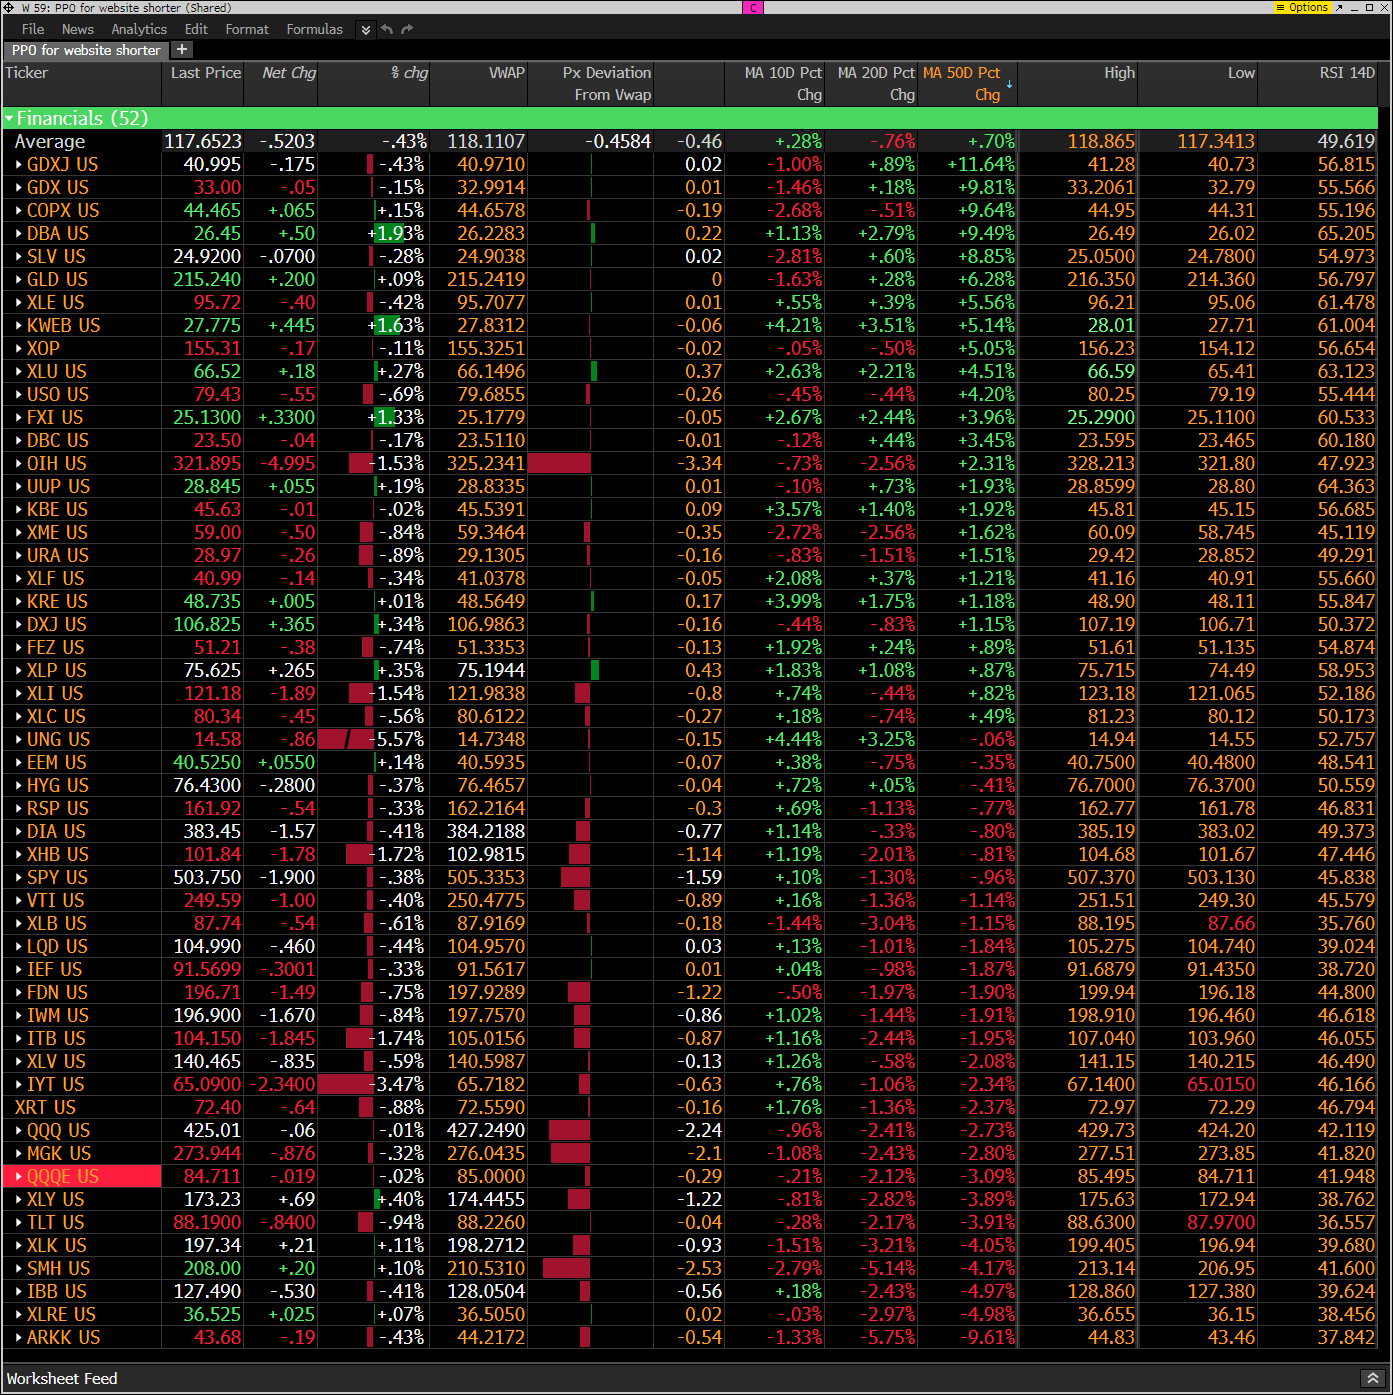
PPO monitor
The PPO monitor (percentage price oscillator) force ranks ETFs by percentage above/below the 50-day moving average. For information on this monitor, please refer to this primer. This monitor and others are offered to Hedge Fund Telemetry subscribers on Bloomberg. The last two days saw those on the lower half bounce fairly hard – a sign of mean reversion which could be stalling.
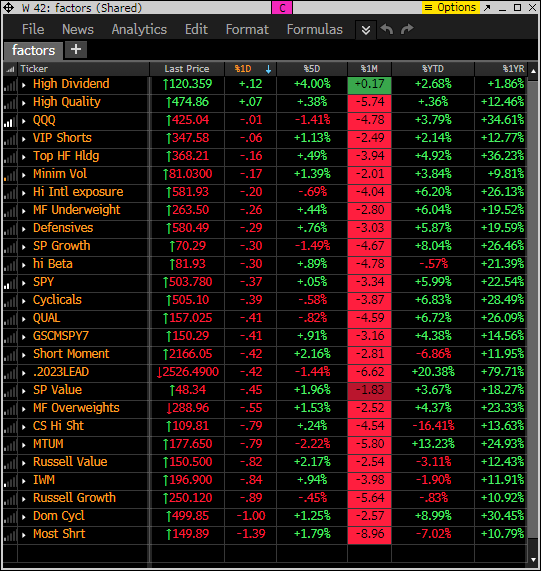
Index ETF and select factor performance
This monitor with various markets and factors ranks today’s performance with 5-day, 1-month, and 1-year rolling performance YTD. Mostly a down day.
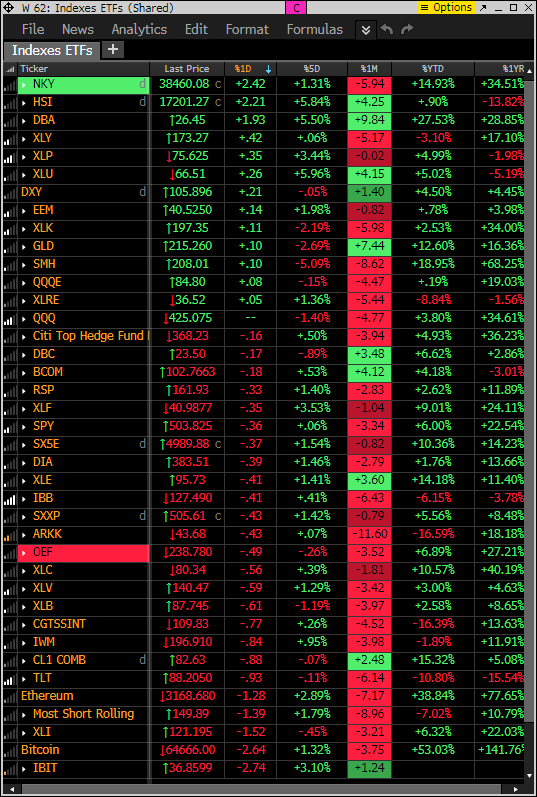
This similar monitor with major ETFs has mostly everything in the US down or moderately higher. Crypto trading heavy again.
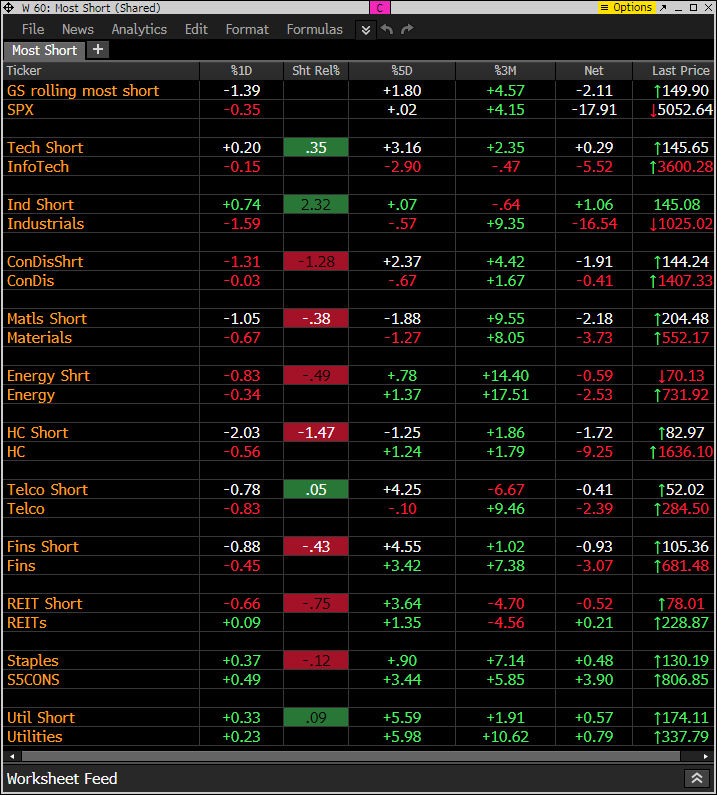
Goldman Sachs Most Shorted baskets vs. S&P Indexes
This monitor has the S&P indexes and the Goldman Sachs most shorted baskets. After yesterday’s squeeze higher short baskets are settling down.
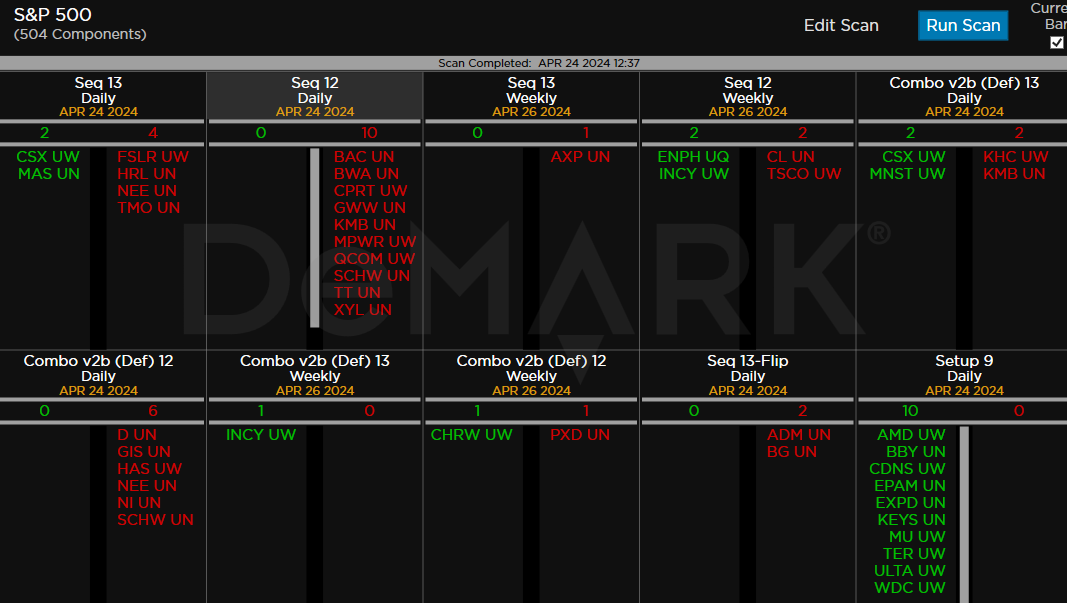
DeMark Observations
Within the S&P 500, the DeMark Sequential and Combo Countdown 13s and 12/13s on daily and weekly periods. Green = buy Setups/Countdowns, Red = sell Setups/Countdowns. Price flips are helpful to see reversals up (green) and down (red) for idea generation. The extra letters at the end of the symbols are just a Bloomberg thing. Worth noting: With the bounce several sell Countdown 13’s are developing. CSX with both Sequential and Combo buy Countdown 13’s.
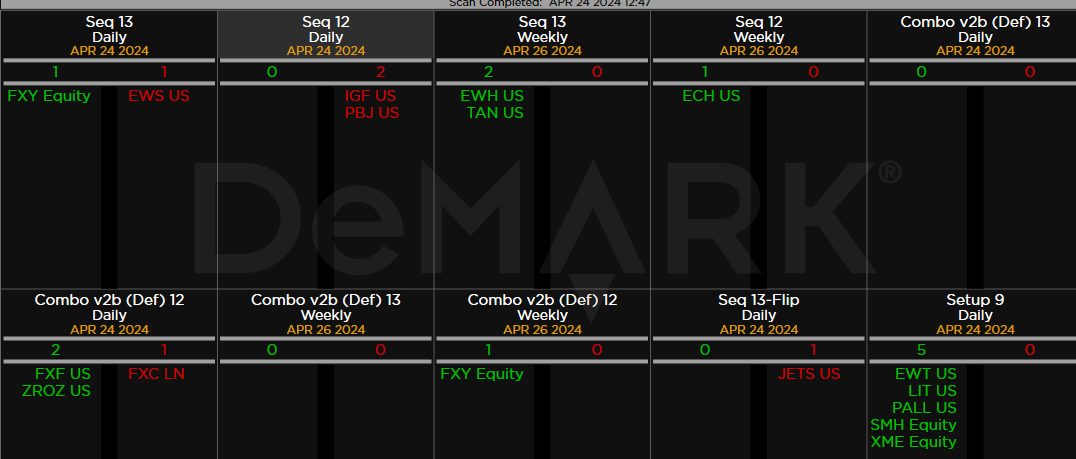
Major ETFs among a 160+ ETF universe.
If you have any questions or comments, please email us. Data sources: Bloomberg, DeMark Analytics, Goldman Sachs, Street Account, Vital Knowledge, Daily Sentiment Index, and Erlanger Research