
Quick Market Views
Both equity and bond markets are sinking after this morning’s economic data. Essentially, weak growth, hot inflation, and tight labor. The Fed Funds futures are now pushing the first Fed rate cut out to November, with only 75% odds of a second cut by end of January 2025. Here’s the data:
The US GDP for Q1 fell short of expectations, coming in at +1.6%, down from +3.4% in Q3 and below the consensus +2.5% forecast. Personal consumption rose 2.5%, about 50bps below the consensus forecast of 3% (goods demand dropped 0.4% while services rose 4%). Despite the weaker growth performance, inflation in Q1 ran hot, with the headline PCE rising 3.1% (10bps ahead of the consensus 3% forecast) while core spiked 3.7% (30bps ahead of the consensus 3.4% forecast). In addition to the hot inflation, weekly claims numbers reflected tight labor conditions, with initial claims at 207K (vs. the consensus 215K) while continuing fell to 1.781MM (vs. the consensus 1.814MM).
And today, I am confirmed for Real Vision’s Daily Briefing at the close. This will be the last note today as I added all the previews on this note.
Stocks: A big gap down after META’s drop after worries about them spending like they did with the “Metaverse.” Markets are trying to claw back the losses however breadth is very weak with NYSE down 2100 issues and Nasdaq down 1900 issues. The usual suspects Mag 7 isn’t helping the market indexes as today it’s Mag 1 with NVDA up nearly 3%. Another big earnings after hours session with MSFT, GOOGL and INTC. I have some previews below.
Bonds: The bond market didn’t like the economic data with rates moving higher again. 2’s traded above 5% earlier and are up 6bps still, 10’s are up 5bps, and 30’s up 4bps. Risk remains rates can and might move even higher.
Commodities: Mixed action with no strong trend today. Energy is down small. Copper up 1%, Gold and Silver are little changed.
Currencies: US Dollar Index reversed earlier gains and is down 0.15%. Bitcoin is also little changed.
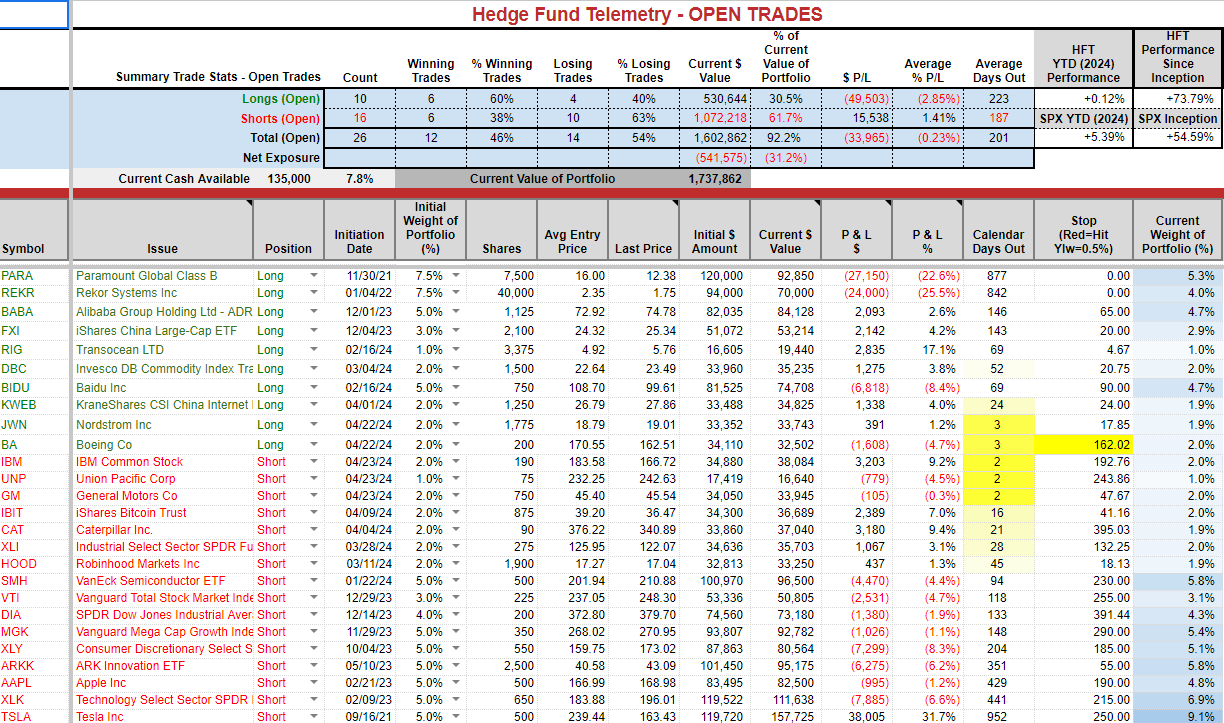
Trade Ideas Sheet: A few changes.
Changes:
- BA had both S&P and Moody’s cut their credit rating and the stock moved lower yesterday and today. It’s off the lows today, and I will sell this one with a 4.5% loss and move on.
- UNP gapped up on decent earnings and has stalled. I will double it up to 2% and use a 245 stop. I think it might fade in the coming days.
- I will cover the IBM short with a 9% gain
- I will cover the CAT short with a 9.6% gain
- I will cover HOOD with a 1.5% gain as I’m not seeing downside continuation.
- I will add a new 1% weight short position with MHK and add back another try with a 2% weighted long position with INTC ahead of earnings later.
Thoughts: The market still seems too eager to buy every dip. I wrote below and wanted to reiterate this – If MSFT breaks today’s low on earnings (which I am not sure if it does) it could give back YTD gains and trap a lot of buyers who bought all year.
US Market Indexes and Sentiment
Here is a primer on how we use Daily Sentiment Index charts. Bond, currency, and commodity sentiment are posted on the website.
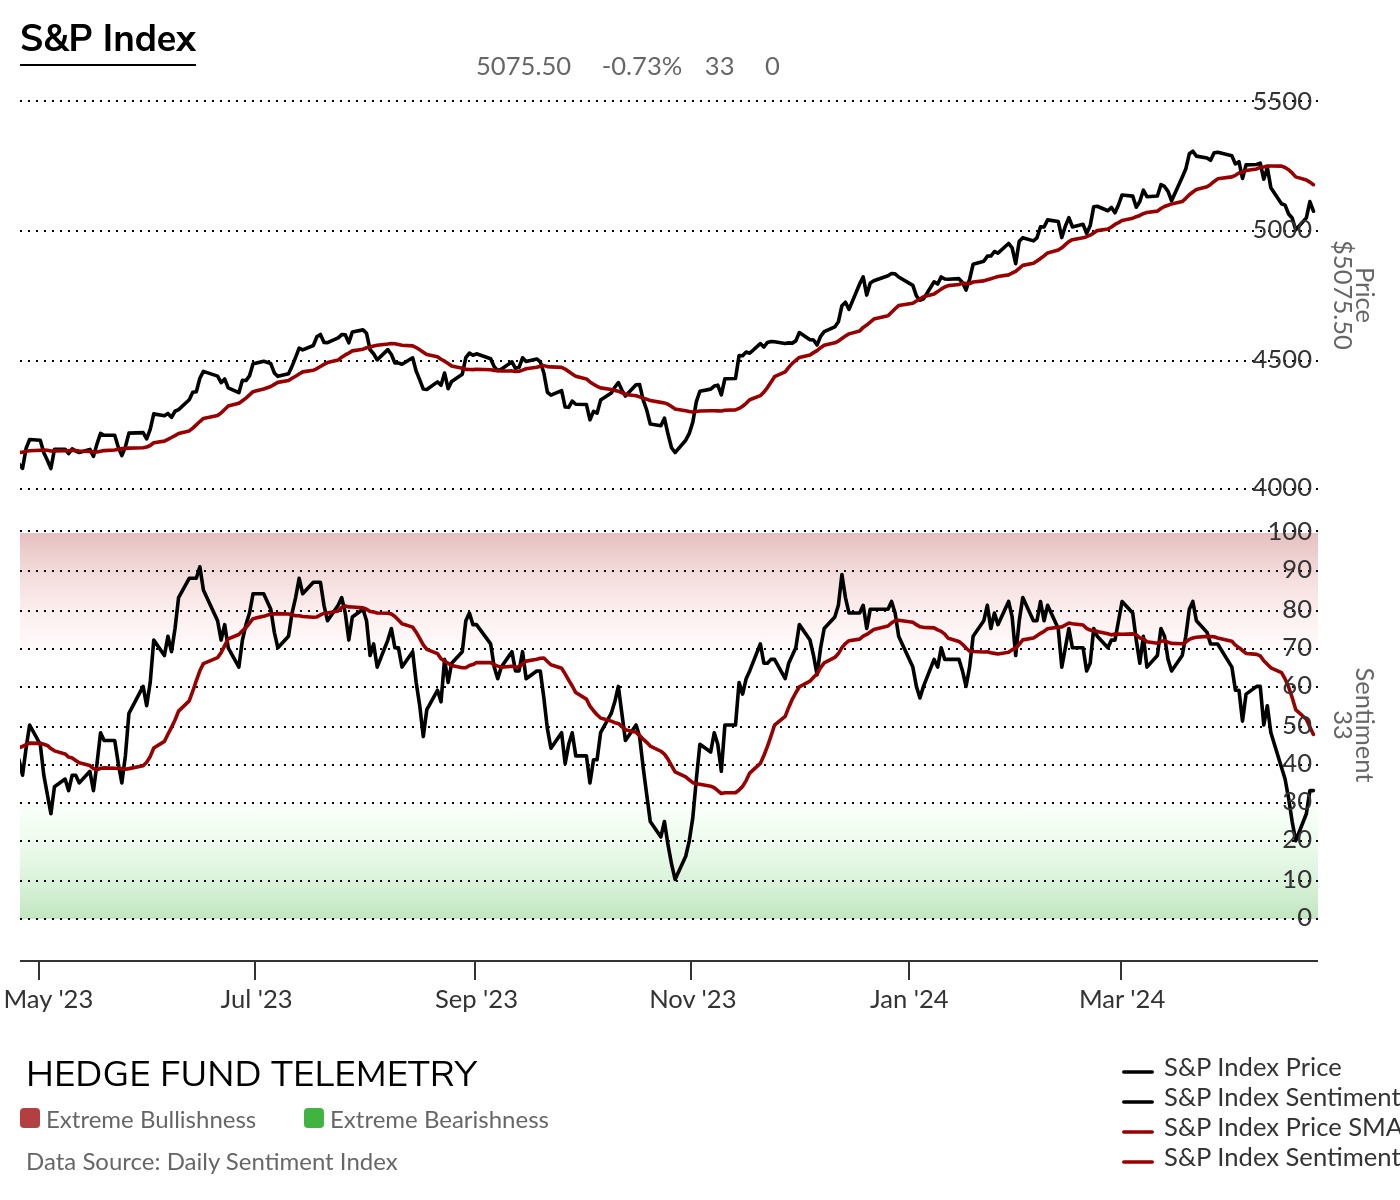
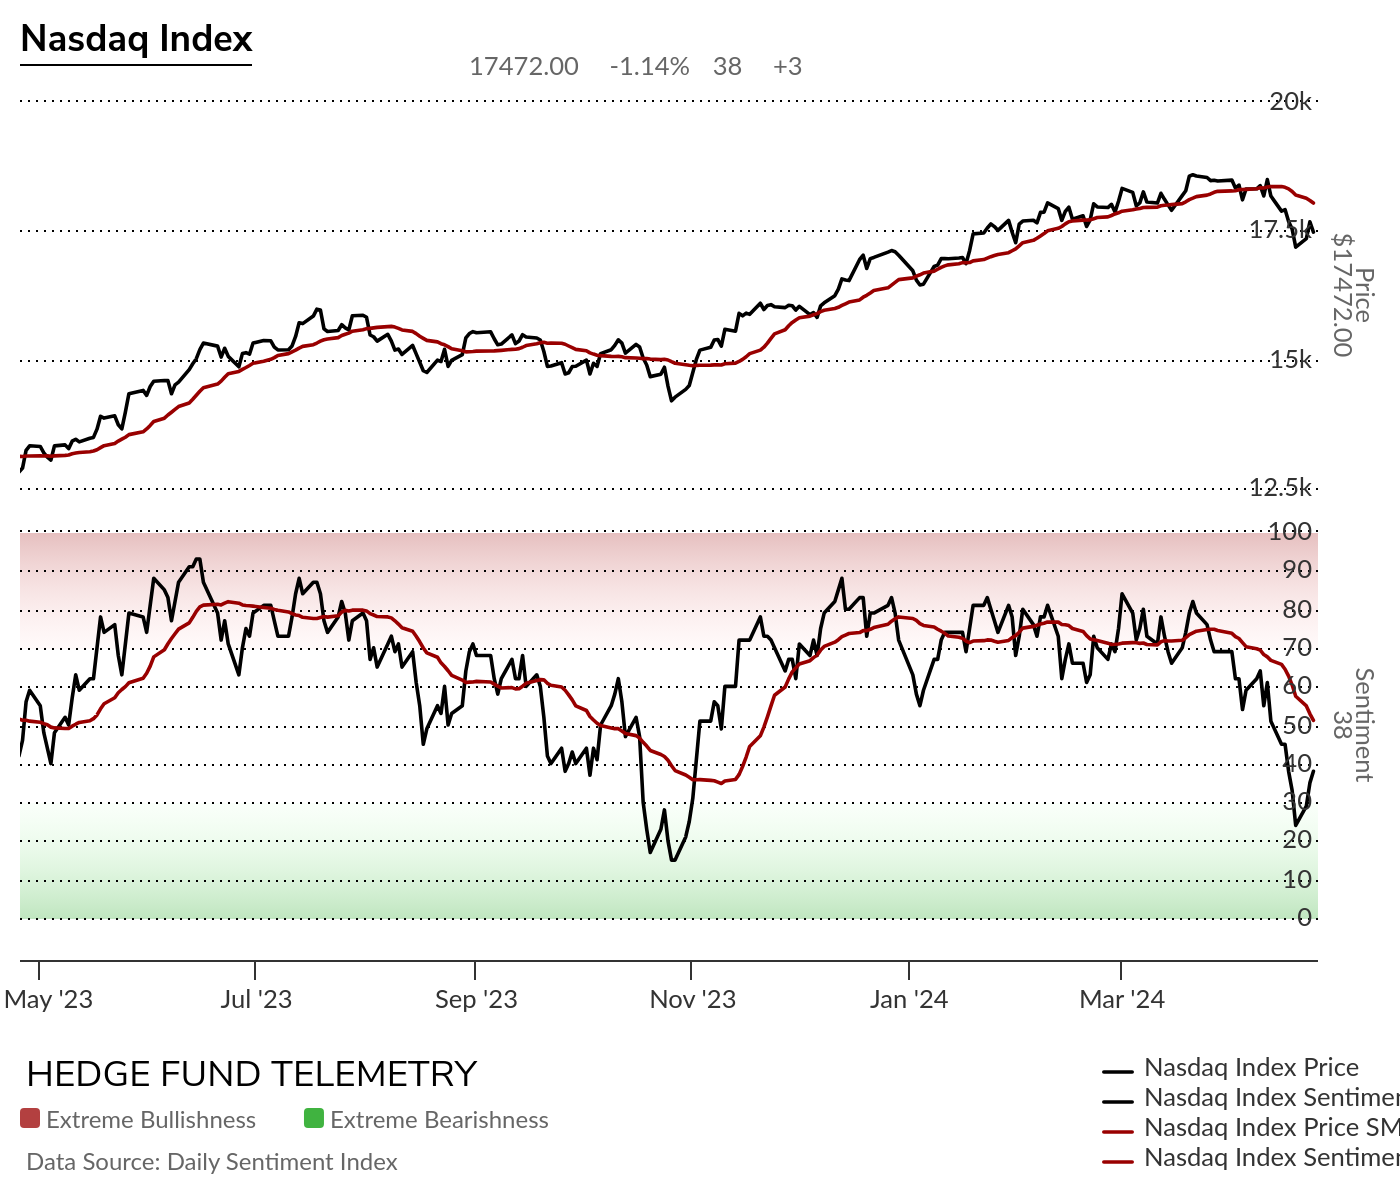
S&P bullish sentiment and Nasdaq bullish sentiment were little changed
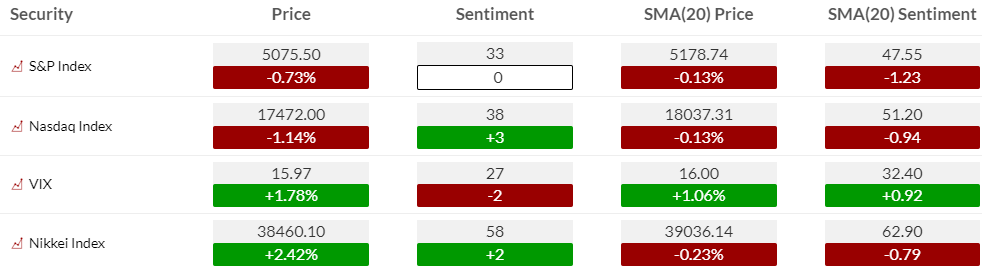
S&P and Nasdaq bullish sentiment
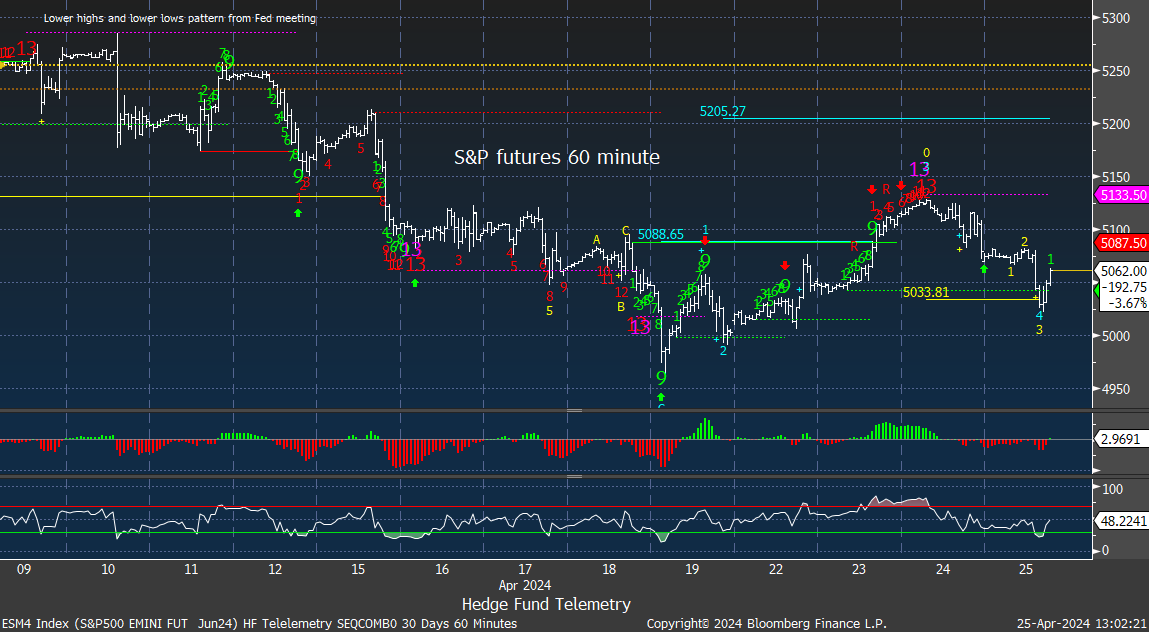
Here is a primer on the DeMark Setup and Sequential indicators.
S&P futures 60-minute tactical time frame hit the downside wave 3 target. 5000 is support and 5100 is resistance.
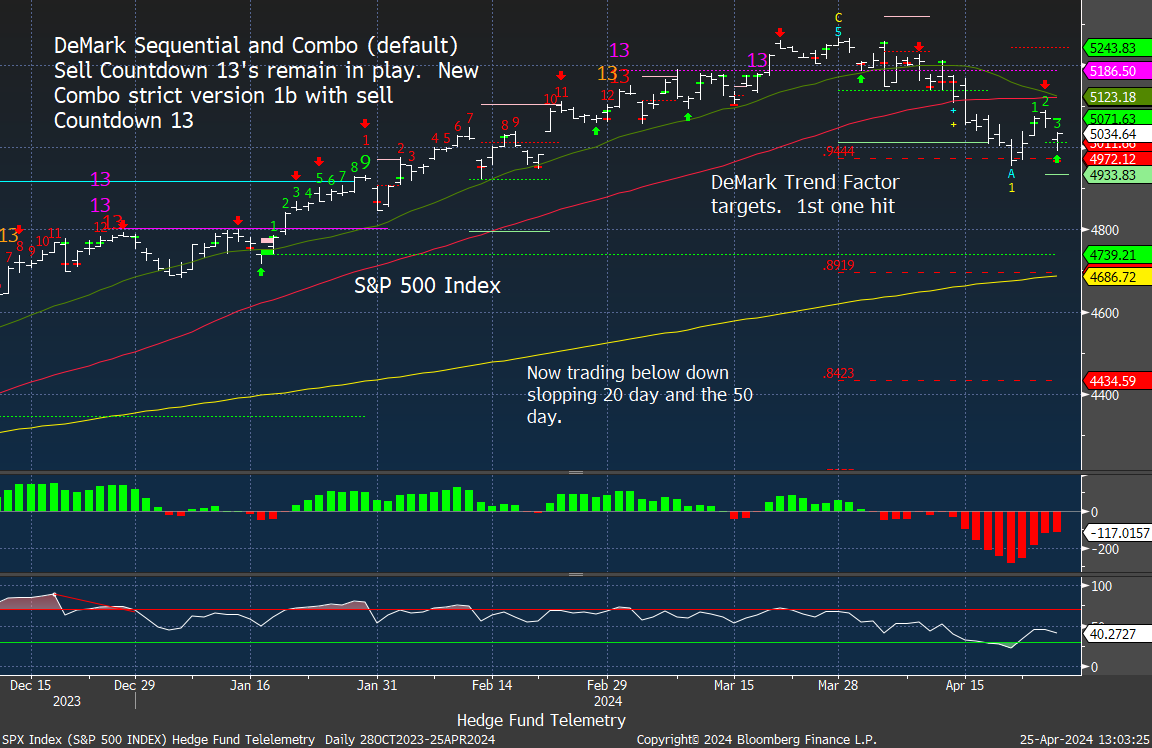
S&P 500 Index daily gapped up yesterday and closed below the open and vice versa gapped down and is trading above the open. People remain very eager to buy all dips. Breaking 5000 will likely get a deeper move with CTA selling breaking the medium term levels.
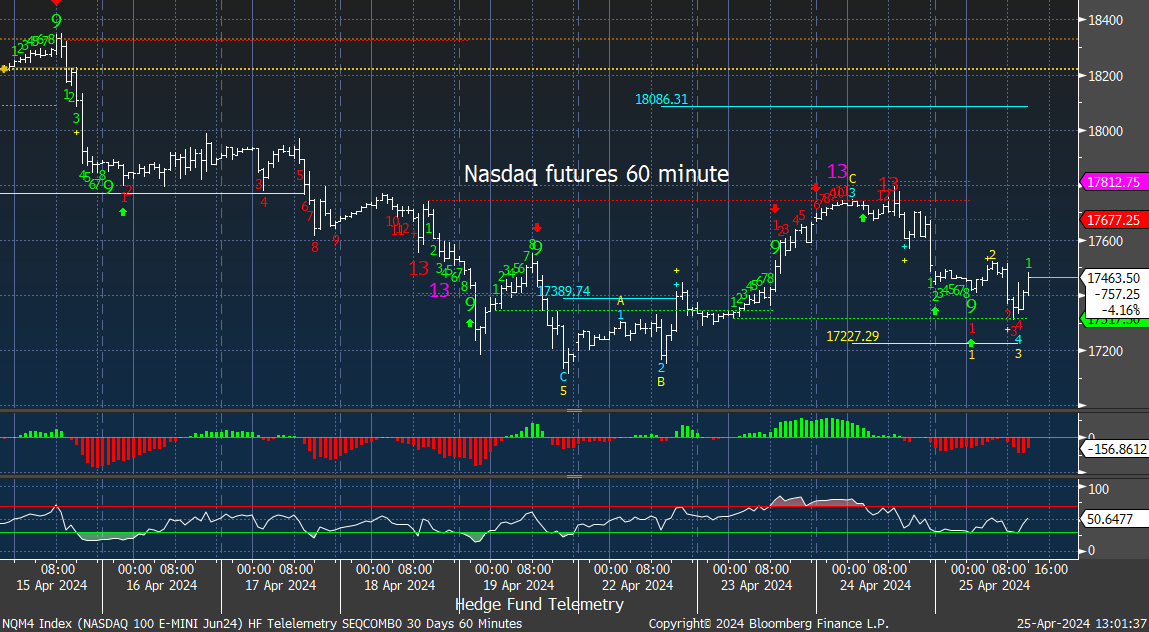
Nasdaq 100 futures 60-minute tactical time frame choppy but well off highs pre Meta.
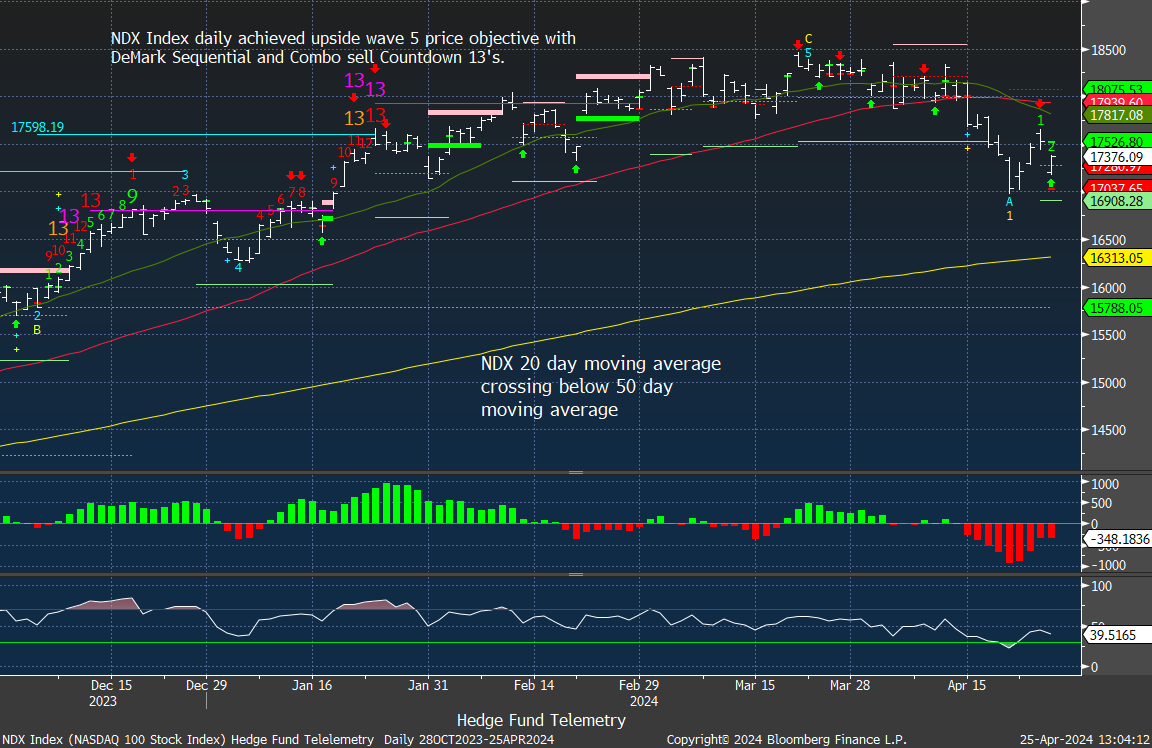
Nasdaq 100 Index daily reversed lower off the gap up yesterday and reversed higher off the gap lower today. Breaking 17k support is the risk.
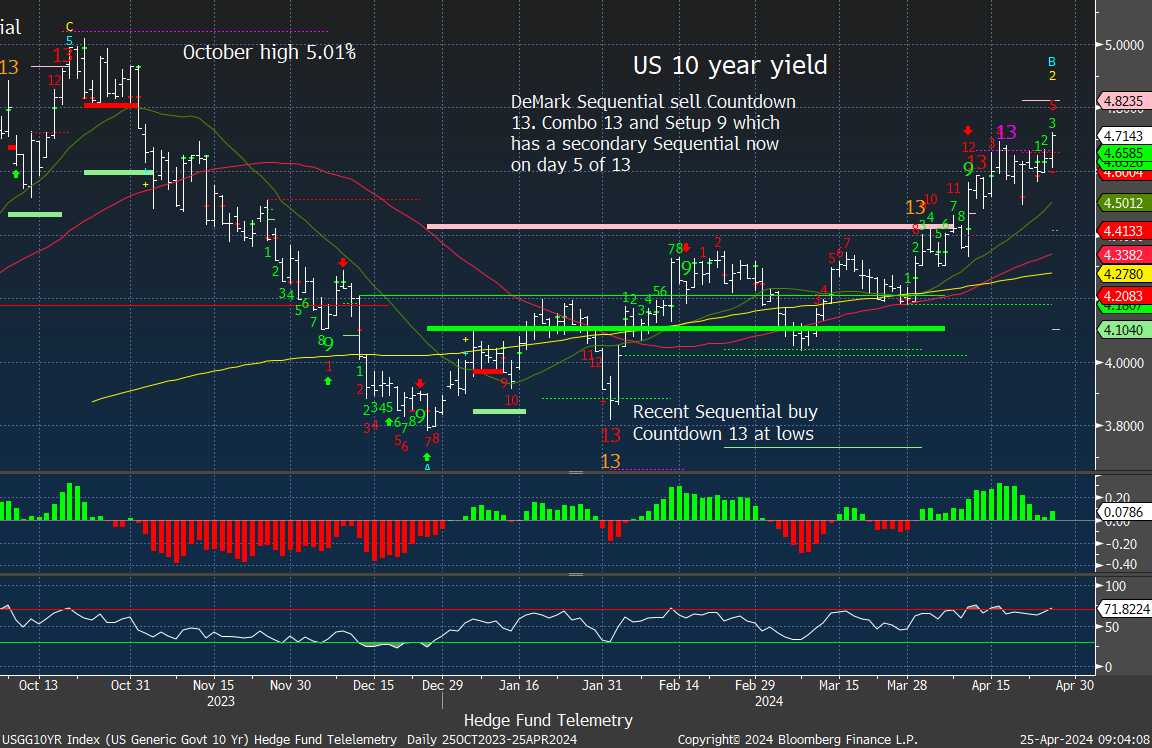
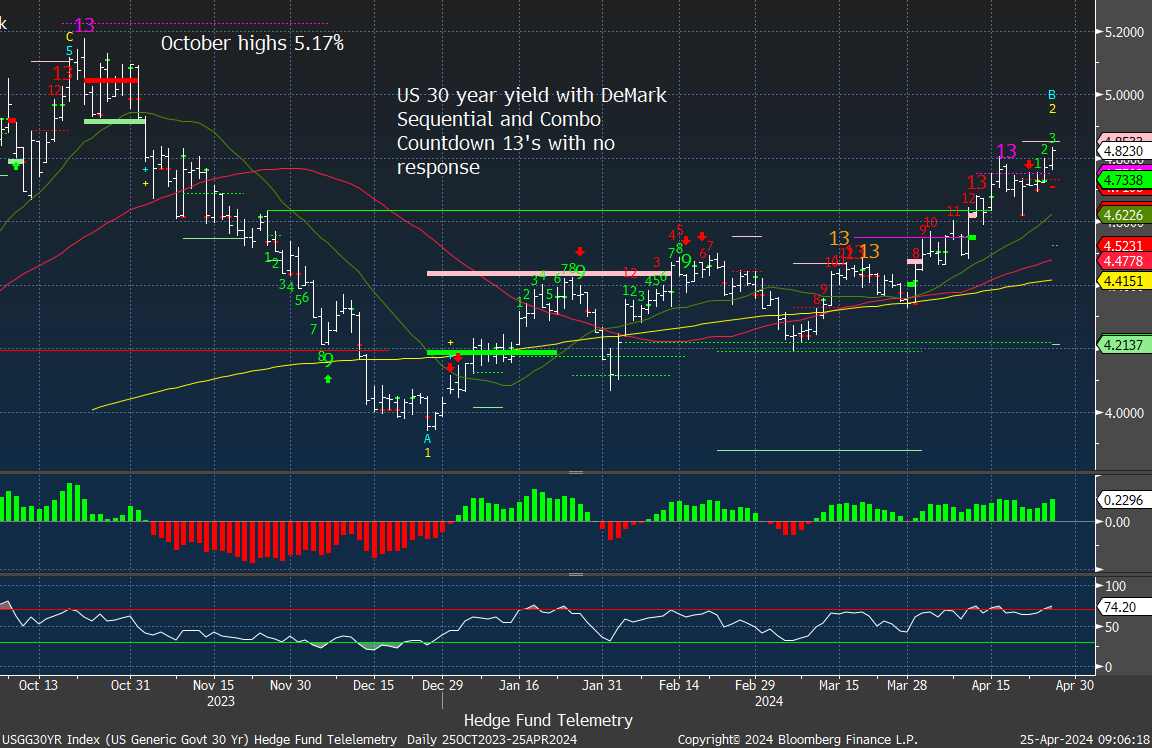
rates continue higher
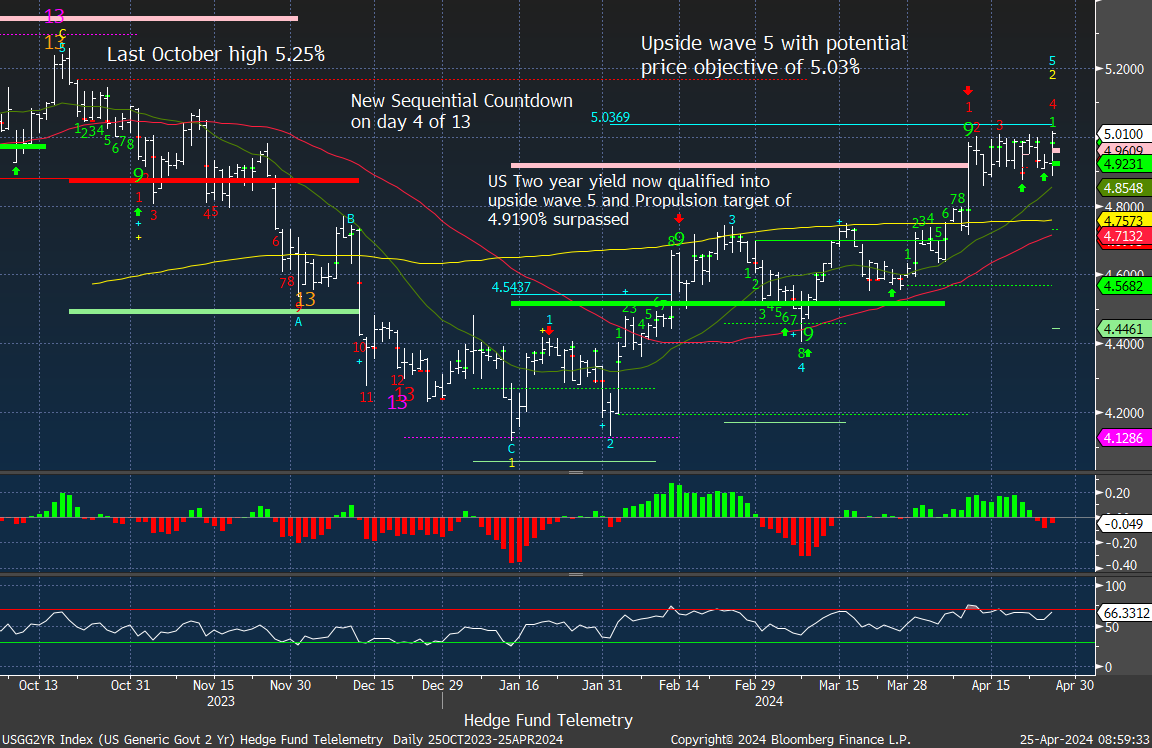
I have had a negative bias on bonds with the turn in early February. Today’s economic data is seeing rates move to new highs for this move. 2’s have a Sequential on day 4 of 13, 10’s had Sequential and Combo sell Countdown 13’s which stalled the trend briefly while there was two Setup 9’s and thus a secondary Sequential on day 5 of 13. 30’s did have 13’s too and have not seen any stall or reversal – possibly failing. Could we see the October highs again? Recall I mentioned Treasury Secretary Yellen will be announcing the quarterly refunding announcement next week and she ‘might’ and ‘could’ cause a squeeze in the bond market.
Trade Ideas Sheet
Pre changes
earnings previews
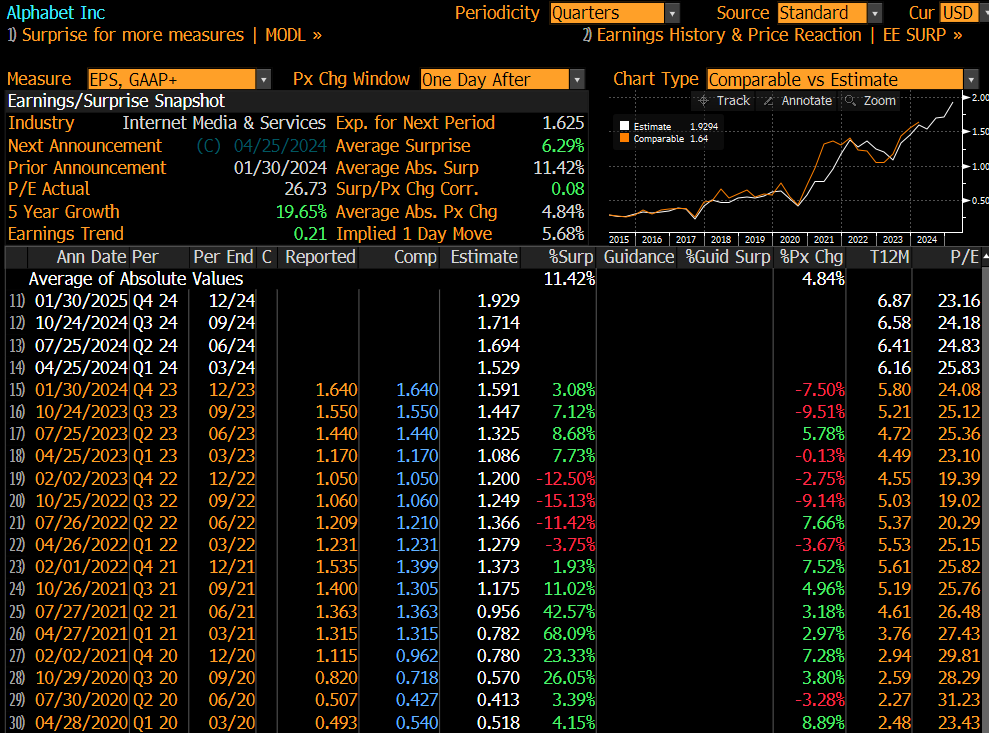
GOOGL Alphabet reports after the close today and is an interesting one as it has seen the last two quarters surprise the market on the downside, but the market has seemingly not cared and rallies it up into the reports. This is a company with the luxury of reporting almost any number they want as they have a lot of levers they can pull. I would rather look to buy this lower if possible. I don’t have the stomach or conviction with the data to add as a short.
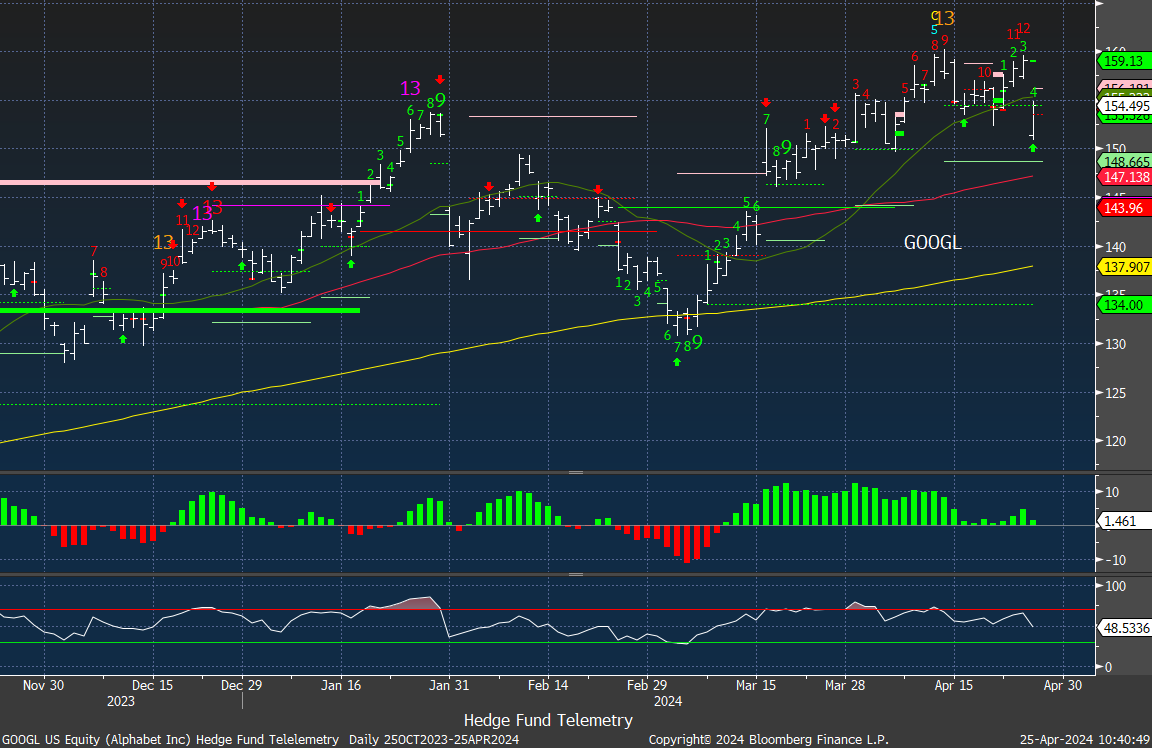
The implied move is 5.68% and has seen two weak day-after trades in the last reports.
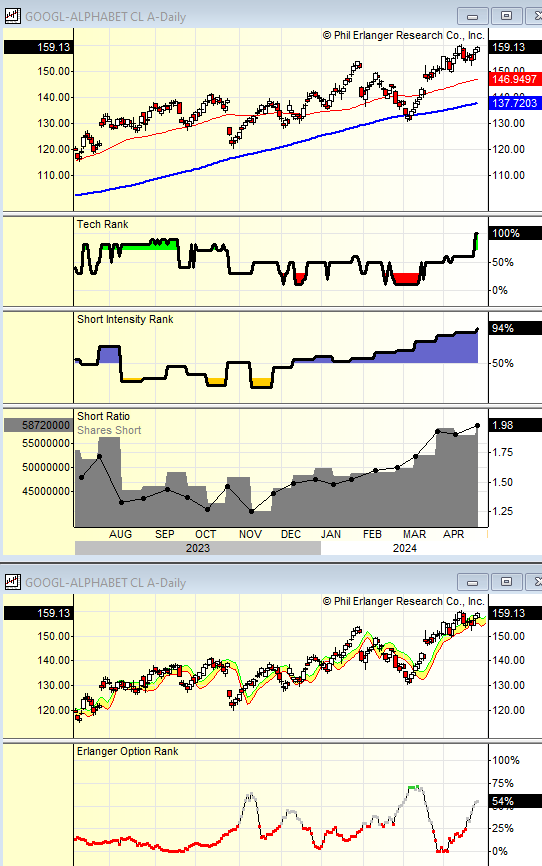
GOOGL short interest is relatively high with 2 days to cover. Recent heavy call buying on the Options Rank with the red dots has moved more neutral with more put buying which isn’t extreme.
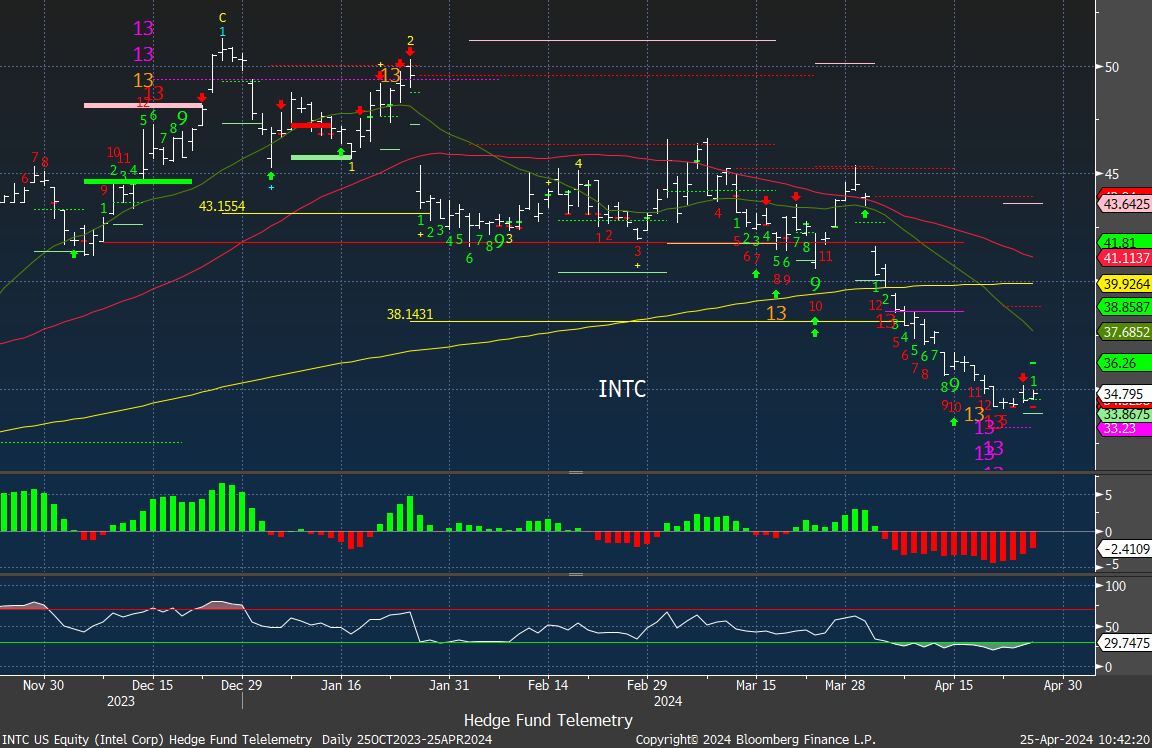
I tried buying the first Sequential 13 and quickly ditched the idea (happily with small loss). The setup now with new Sequential and Combo 13’s with RSI very oversold and shorts and put buyers active could see a relief bounce. Expectations are very low. I will add a new 2% long position and give it another shot.
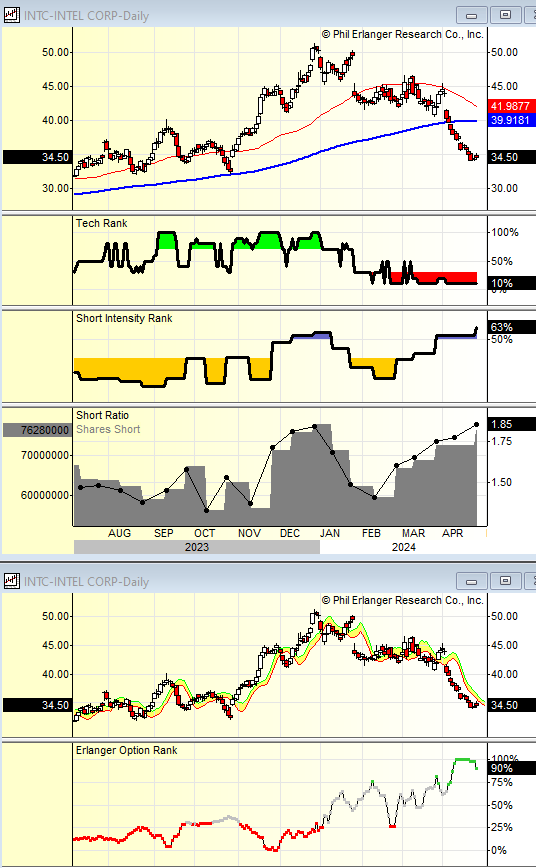
The implied move is high for INTC 7%.
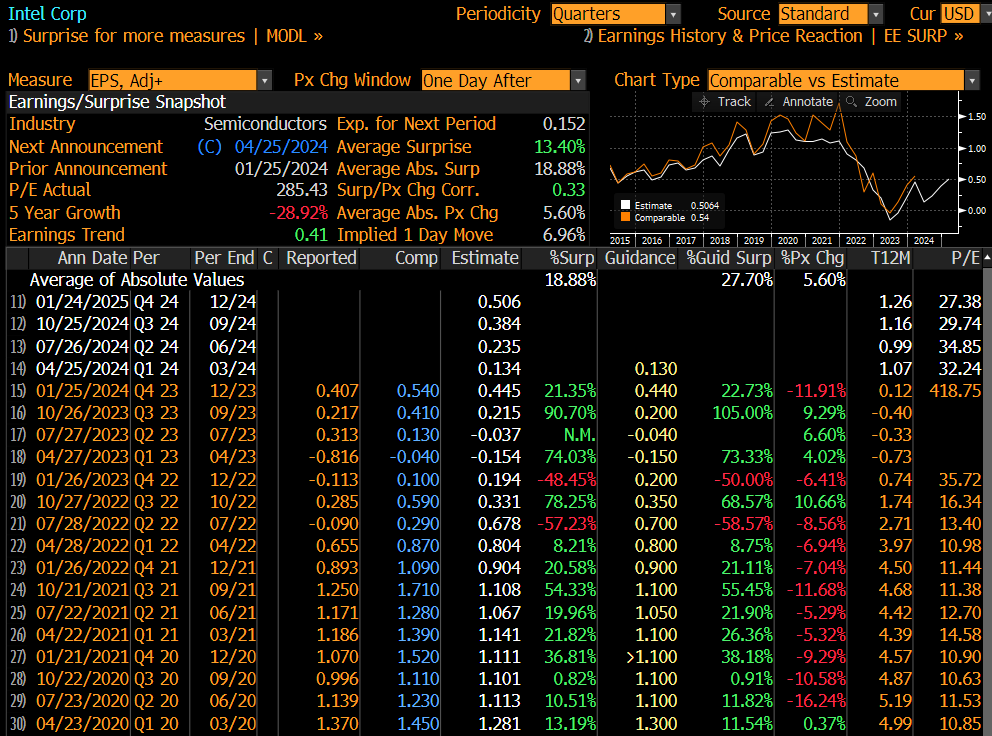
Intel’s short interest has been building in this down move with 1.85 days to cover the highest in over a year. There has also been heavy put buying on the Options Rank with the green dots. This has upside squeeze potential.
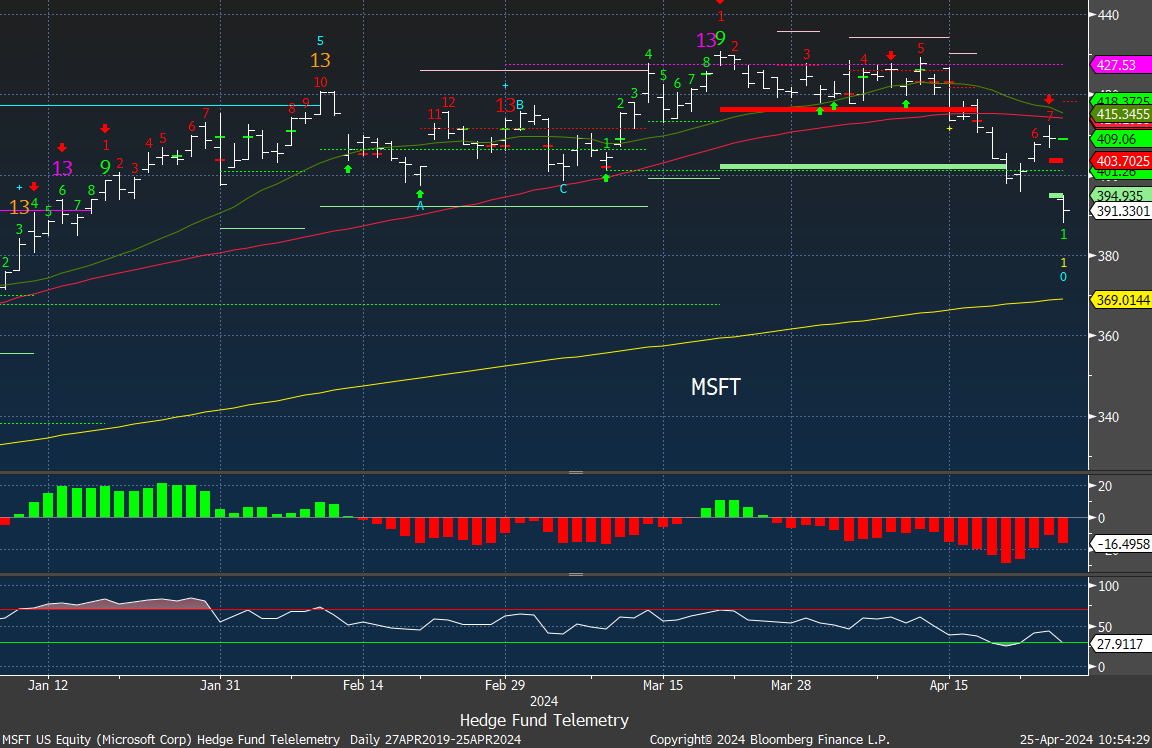
MSFT like META had a toppy pattern and todays’ gap down broke some levels making a new intraday low going back to January. The bar after today’s gap down is a lot lower however if anything is off on the report or guidance this will move lower trapping everyone who bought this for most of this year. That is the risk lower on a more intermediate term With that in mind I would rather trade this or examine it after the report.
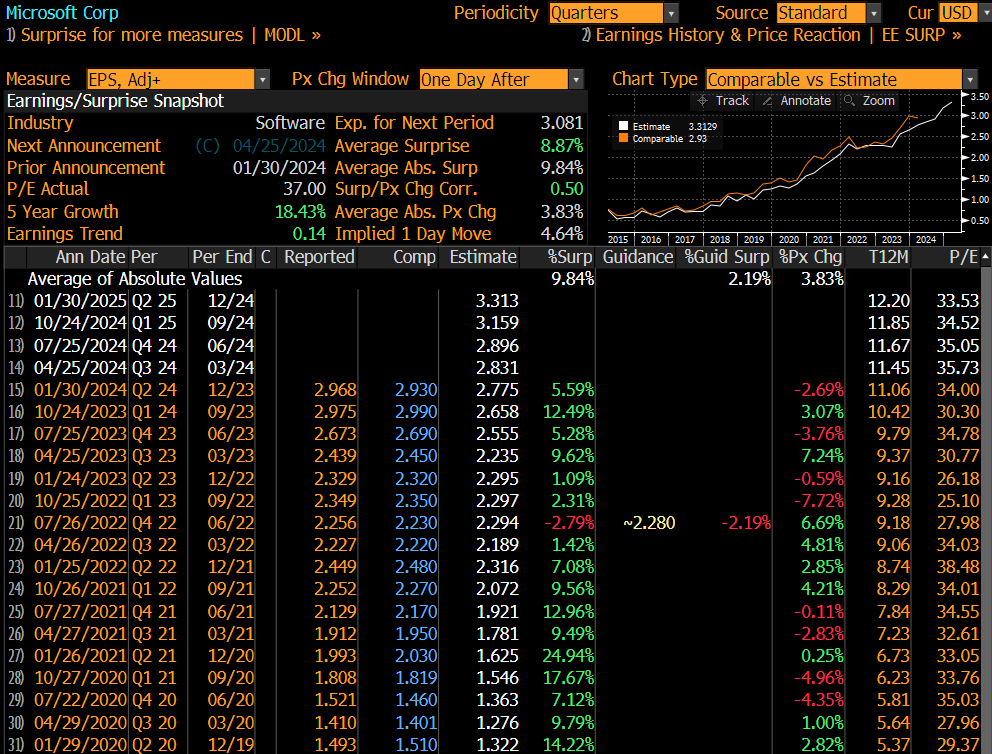
The implied move is a little higher now vs the average move. 4.64% is expected.
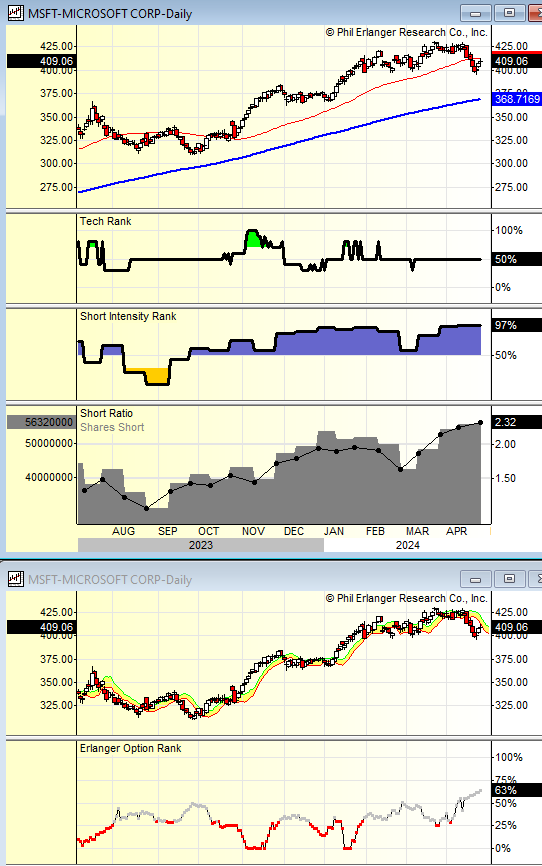
MSFT short interest is high for them with 2.3 days to cover. On the Options Rank it has moved more towards put buying recently.
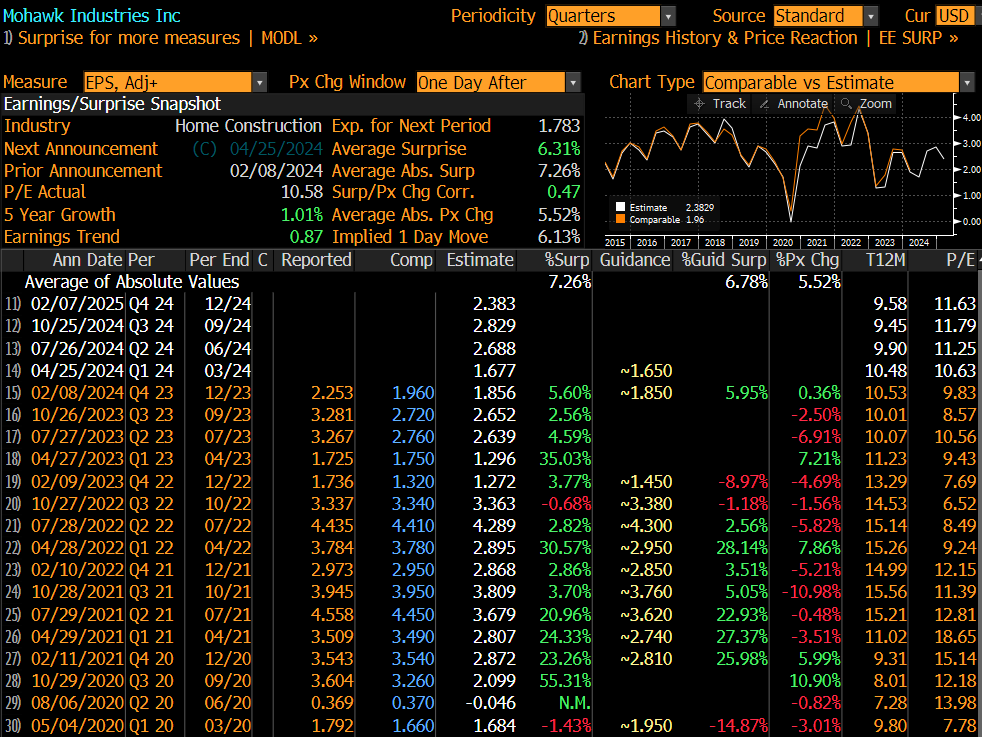
MHK Mohawk makes building products and has seen a decent drop. There is a downside DeMark Sequential Countdown on day 5 of 13 at support. I will add a small 1% sized short mostly due to the Sequential in progress. And some comps have also has seen declines.
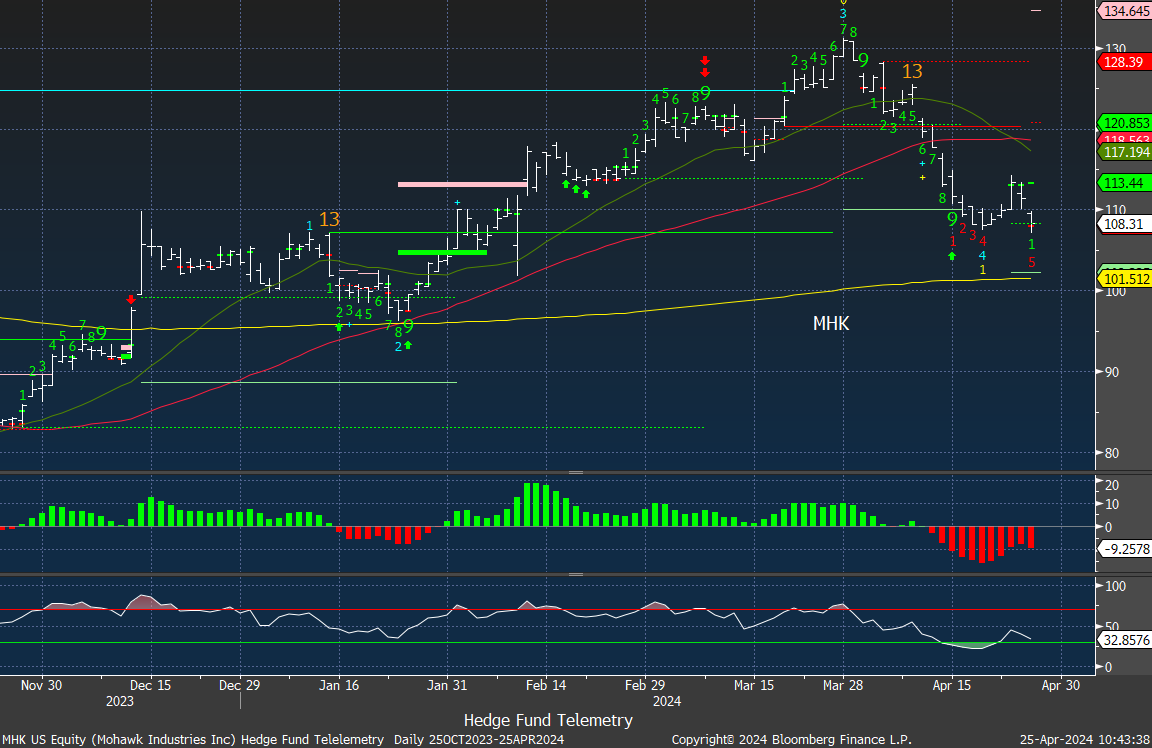
The implied move is 6%
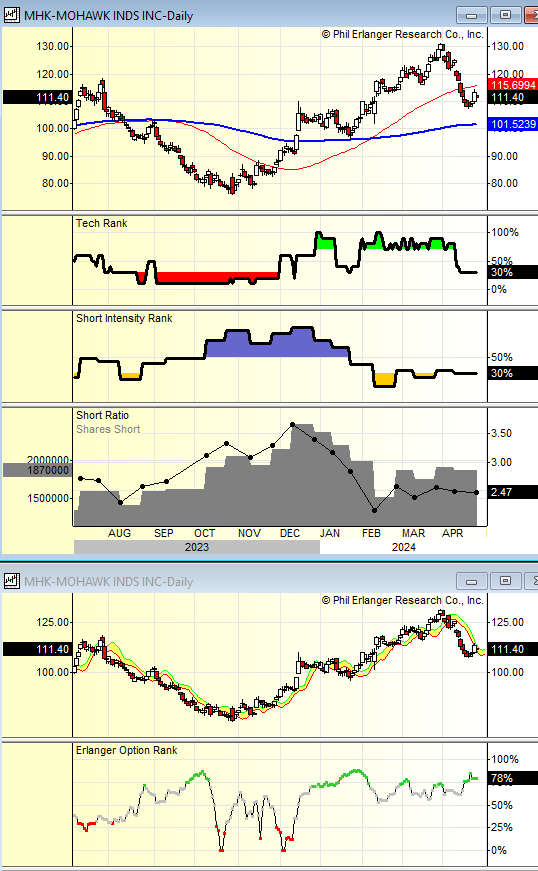
Short interest has declined from late last year squeezing people out. The days to cover is now 2.5 days. The Options Rank shows heavy put buying with the green dots.
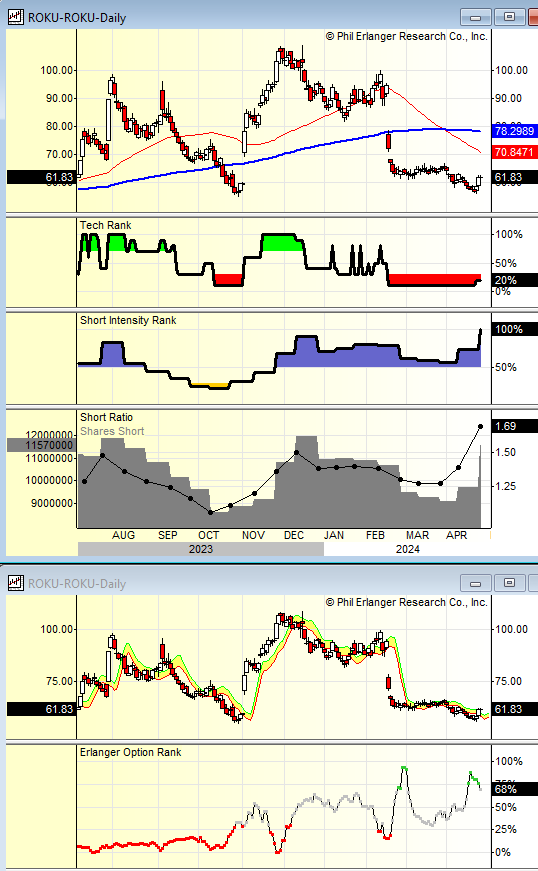
ROKU has been trying to make a base after gapping down big after the last earnings report. There is a new Combo 13 and a Sequential pending on day 10 of 13. I’ll sit on the sidelines with this one.
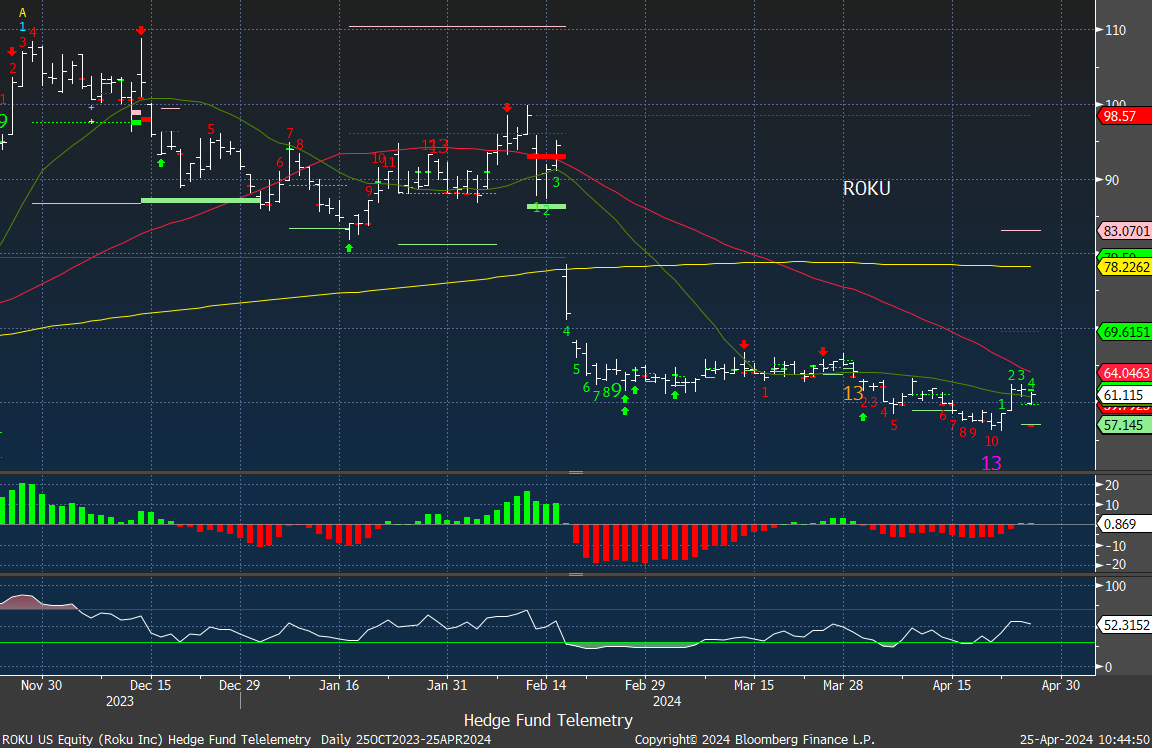
ROKU has seen huge upside and downside moves in the last three quarters. The implied move is 13%. I’d rather pass on this with the unpredicable large implied move.
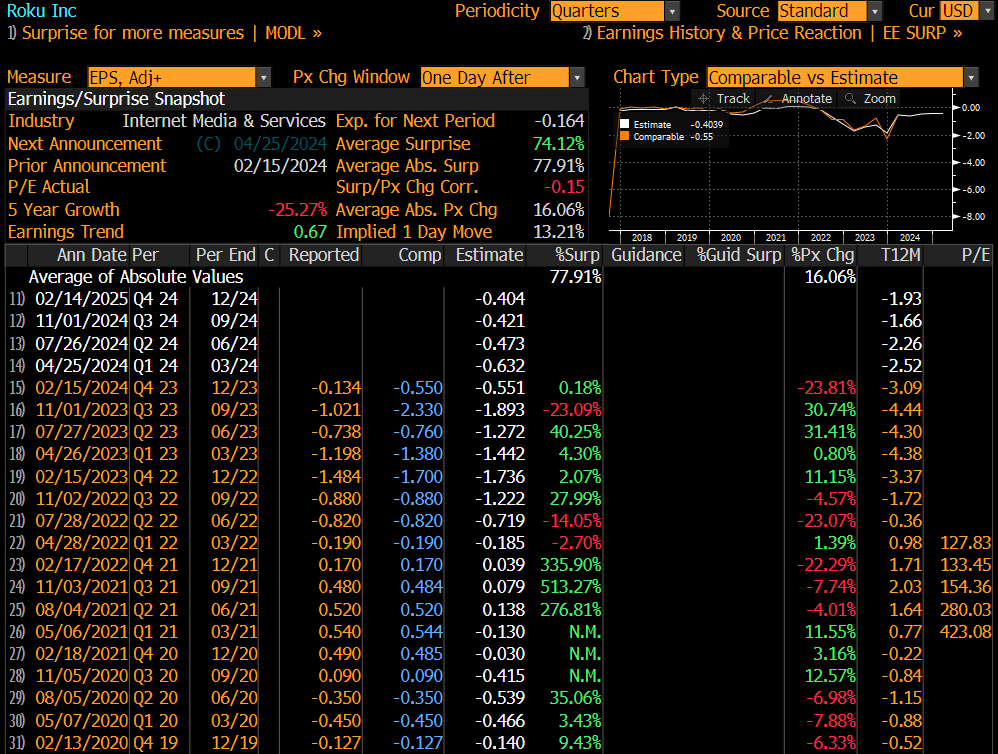
Short interest last quarter was moderately high and the shorts won. Short interest has spiked recently with 1.7 days to cover. There was heavy call buying on the Options Rank ahead of that earnings report with the red dots. Now there has been heavy put buying recently with the green dots.
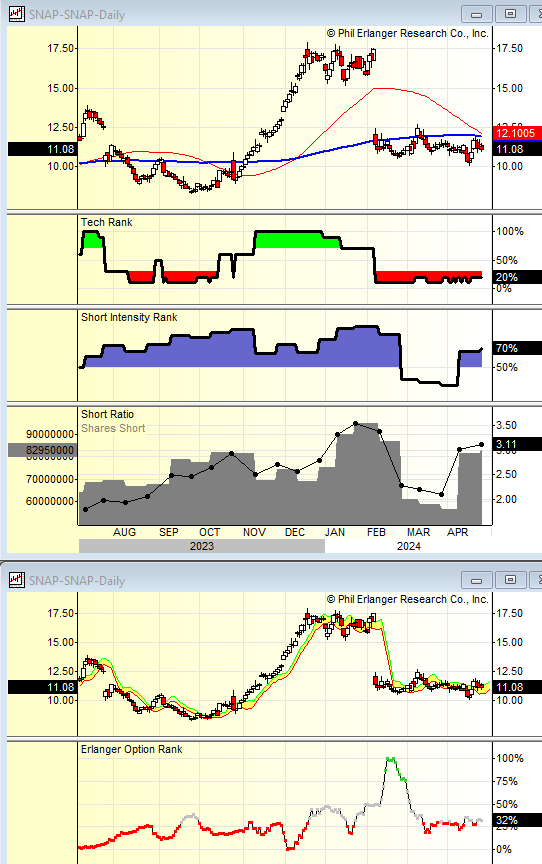
SNAP is a no go stock for earnings at it never is easy to get the positioning right. See below.
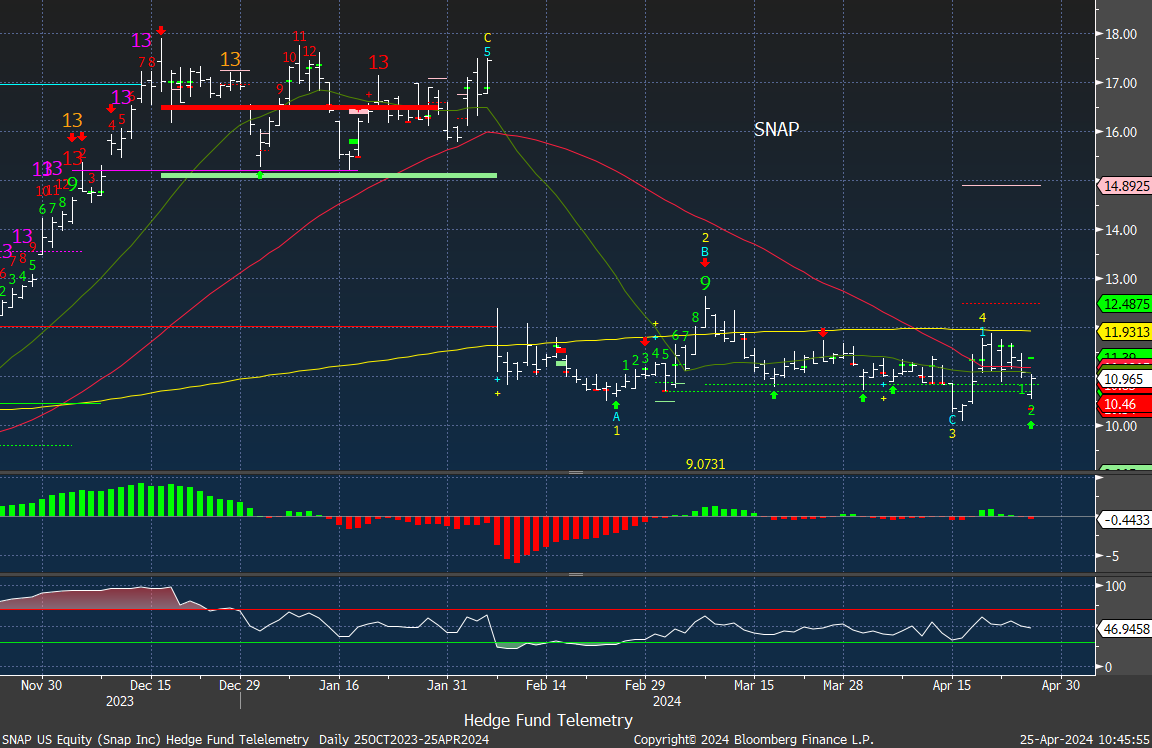
SNAP ALWAYS has an implied move that is super high. Nearly 22%. This is not worth trading because it can and usually moves in a wild (month making or month destroying) move.
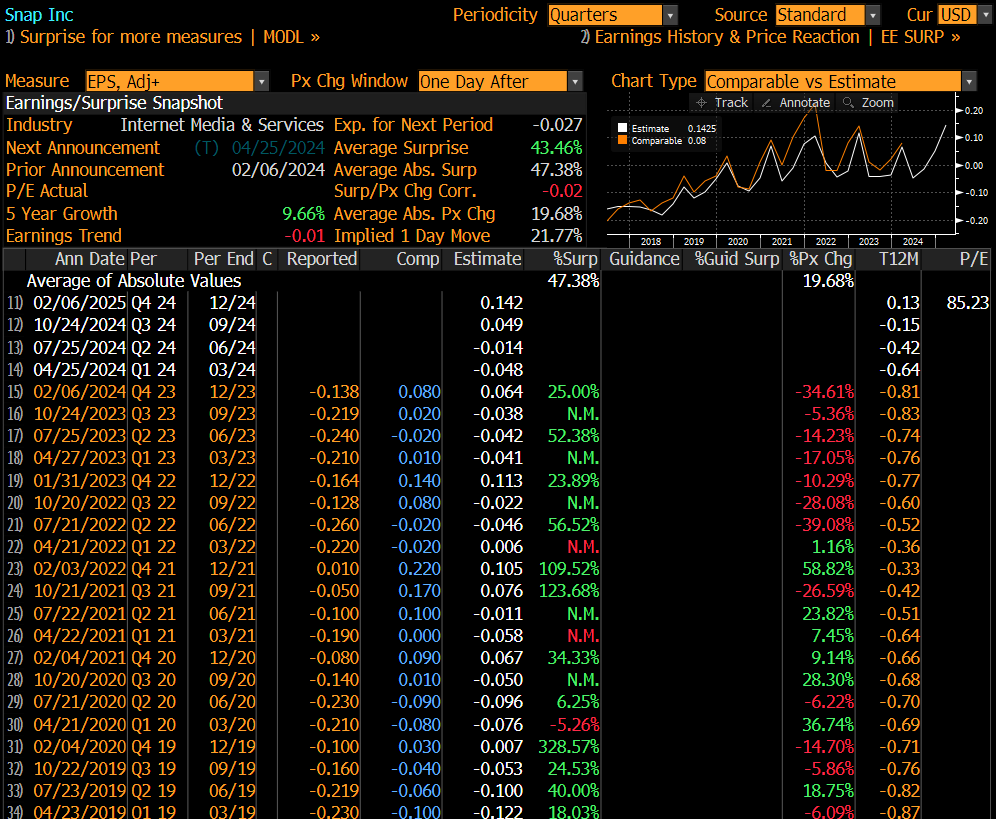
SNAP had high short interest last quarter and the shorts won big time yet there was heavy call buying too and they lost. After the gap down put buying was seen on the Options Rank which was like calling an insurance company looking for insurance when your house is on fire. There is now moderately high call buying with red dots again.
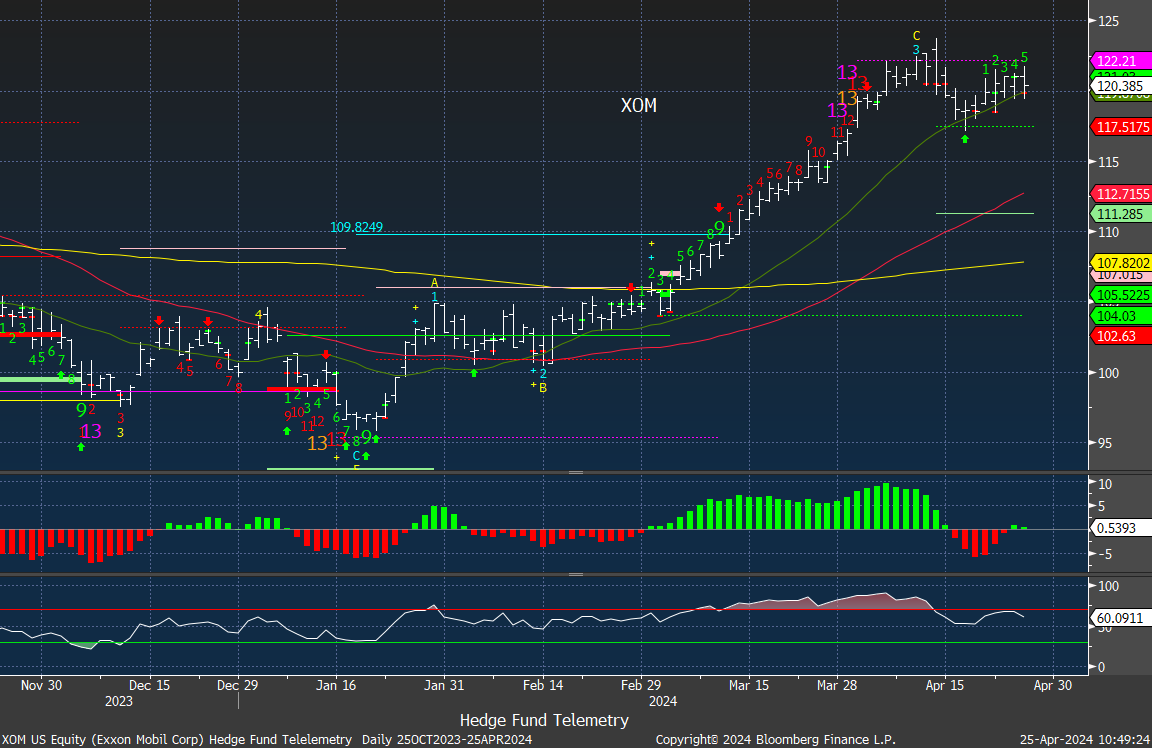
XOM stalled at the highs after recent DeMark sell Countdown 13’s. Shorts are involved while call buying is high countering the setup. I’d like to buy this on dips to the 50 day if it can get there. Sidelines for the report.
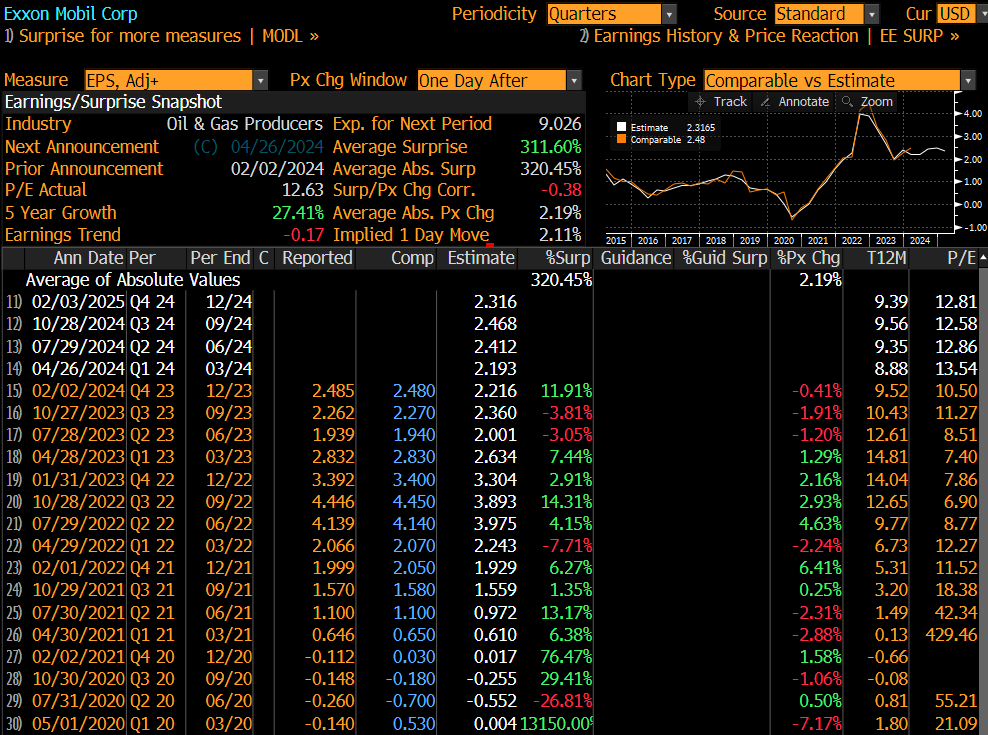
The implied move is relatively low at 2.11% considering others in the market
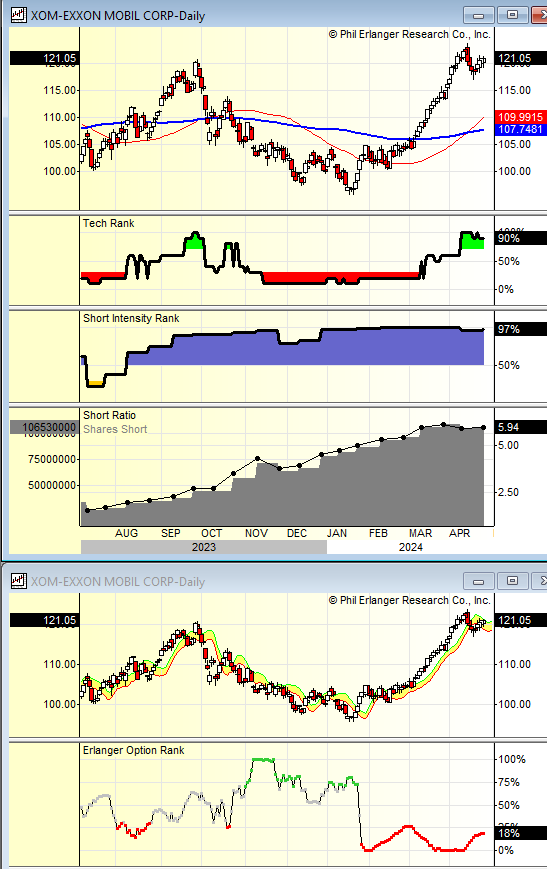
Short interest has been very high with nearly 6 days to cover. Countering this a little is the heavy call buying with the red dots on the Option Rank.
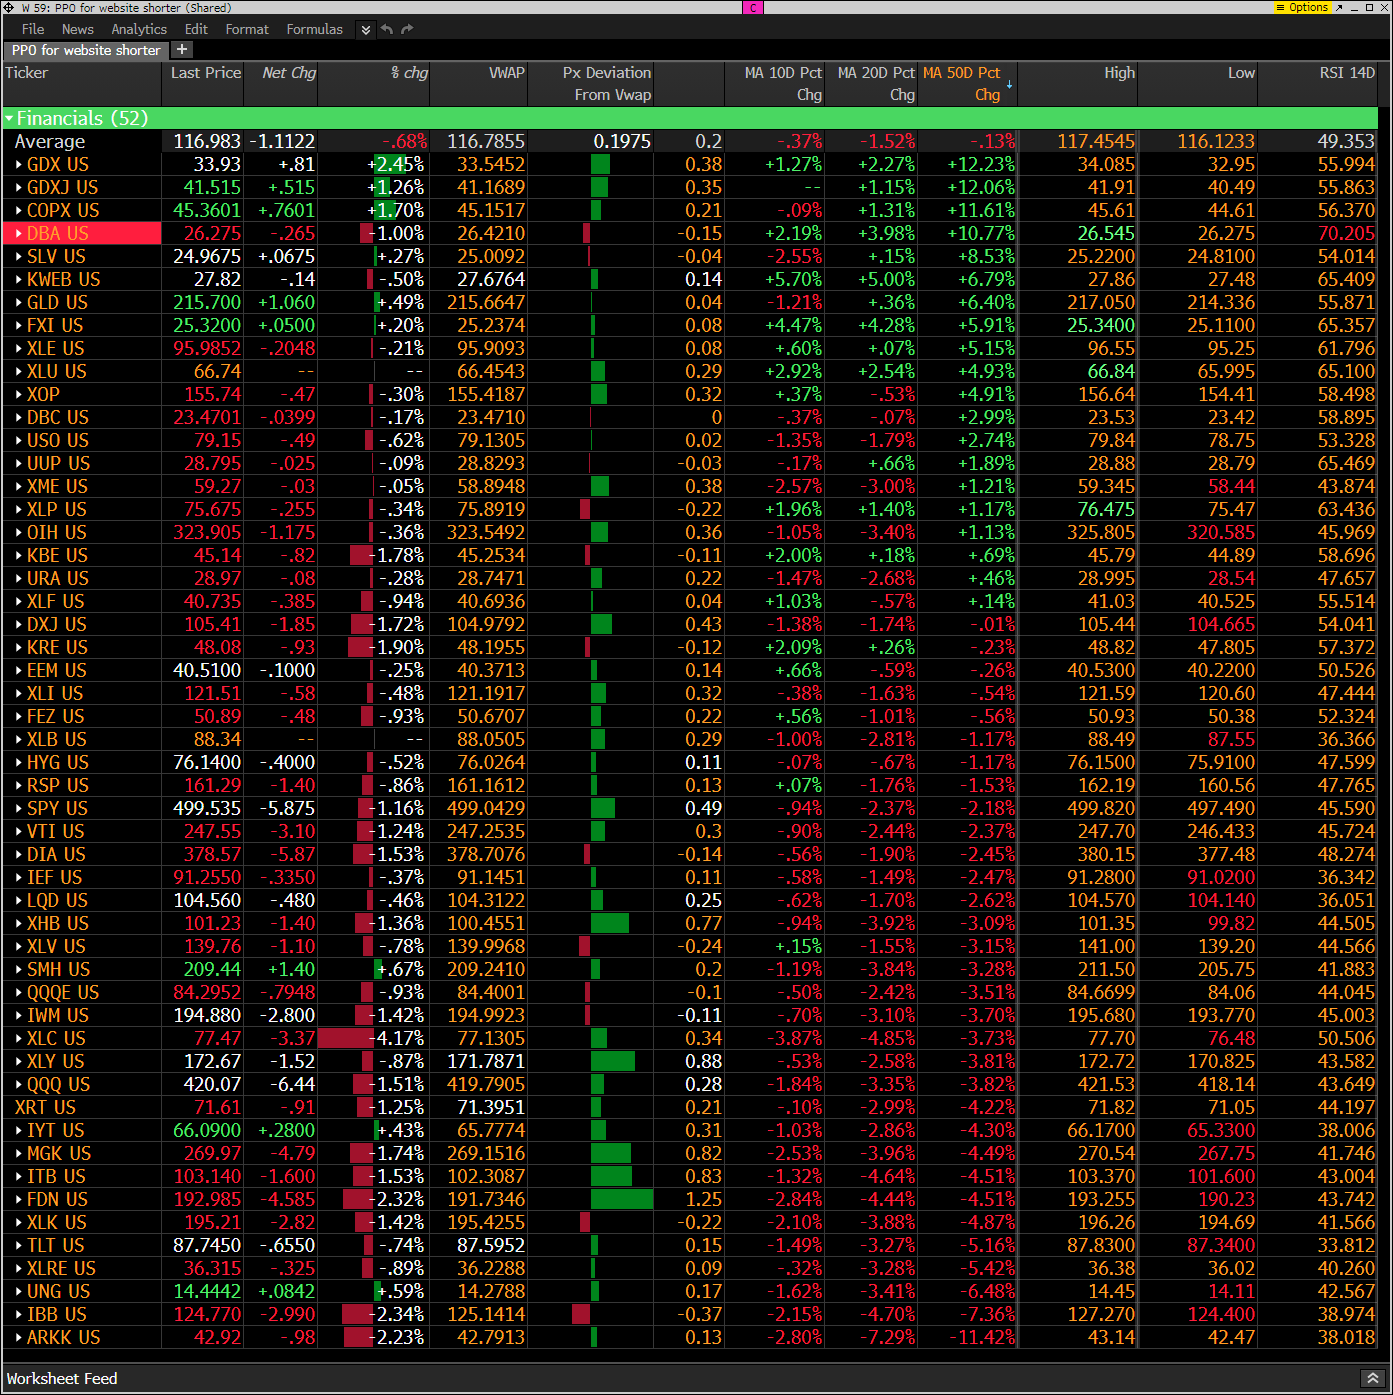
Hedge Fund Telemetry ETF Percentage Price Oscillator Monitor
The PPO monitor (percentage price oscillator) force ranks ETFs by percentage above/below the 50-day moving average. For information on this monitor, please refer to this primer. This monitor and others are offered to Hedge Fund Telemetry subscribers on Bloomberg. Midday action seens most sectors down on the day with prices above today’s VWAP levels. Gap downs often see this type of underlying buying. If the VWAP levels break later today there will be trapped buy the dip buyers.
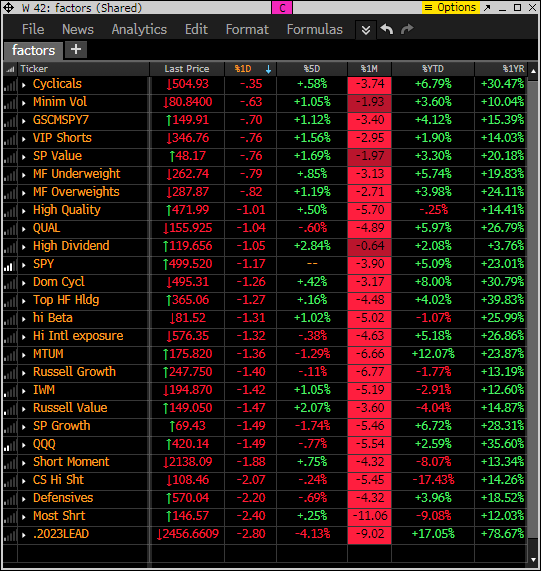
Index ETF and select factor performance
This monitor with various markets and factors ranks today’s performance with 5-day, 1-month, and 1-year rolling performance YTD. Down across the board. Mag 7 down the most today and last 5 day rolling period.
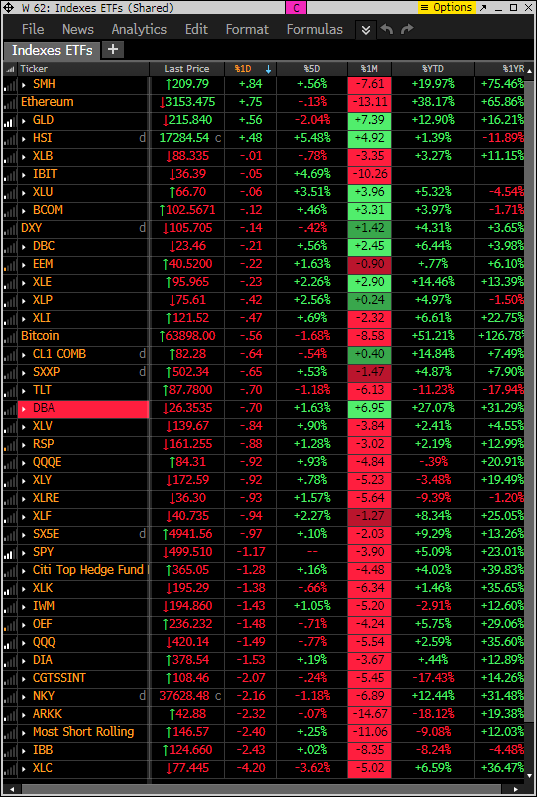
This is a similar monitor with major ETFs shows mostly a weak day with Semi’s and gold leading.
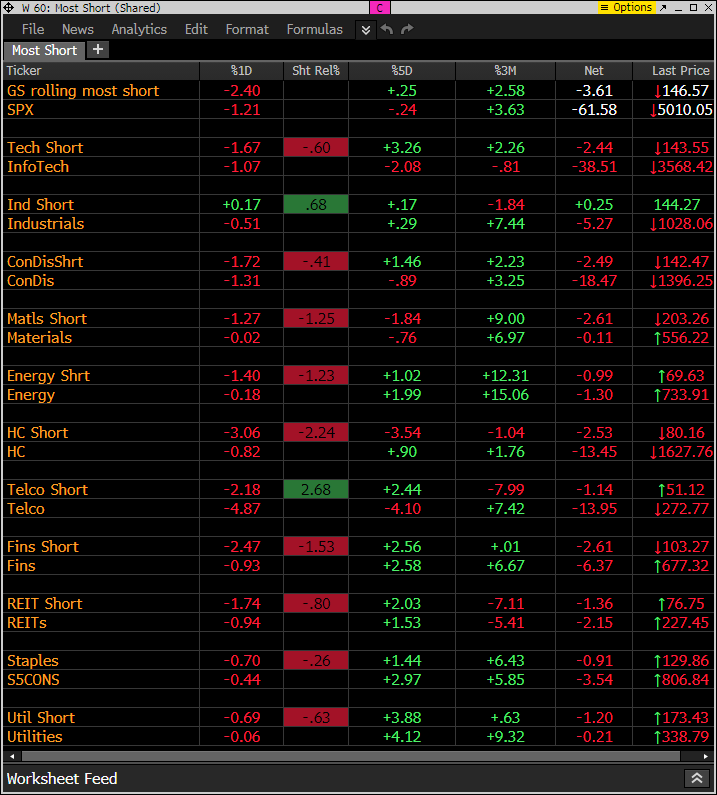
Goldman Sachs Most Shorted baskets vs. S&P Indexes
This monitor has the S&P indexes and the Goldman Sachs most shorted baskets. Short baskets are mostly lower vs index action which is also weak too.
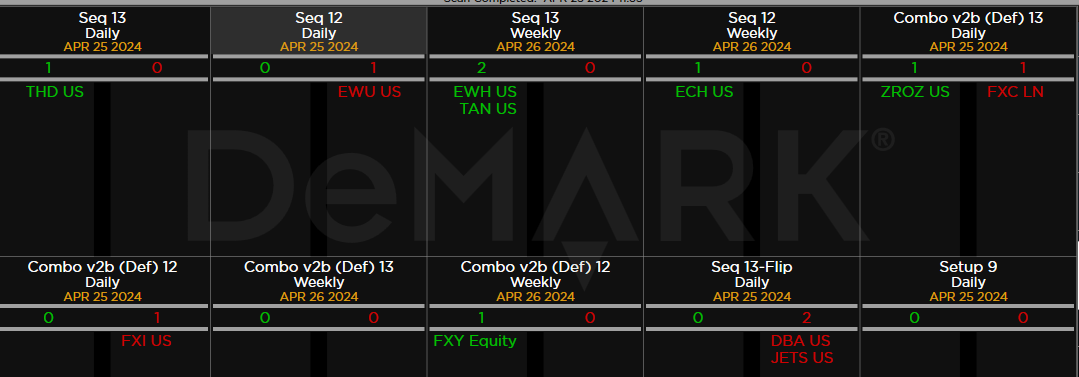
DeMark Observations
Within the S&P 500, the DeMark Sequential and Combo Countdown 13s and 12/13s on daily and weekly periods. Green = buy Setups/Countdowns, Red = sell Setups/Countdowns. Price flips are helpful to see reversals up (green) and down (red) for idea generation. The extra letters at the end of the symbols are just a Bloomberg thing. Worth noting: Not a lot of signals and with markets off highs and recent lows there is mixed action. Watch the price flips up in green and down in red. With continuation the odds are good for upside/downside trades.
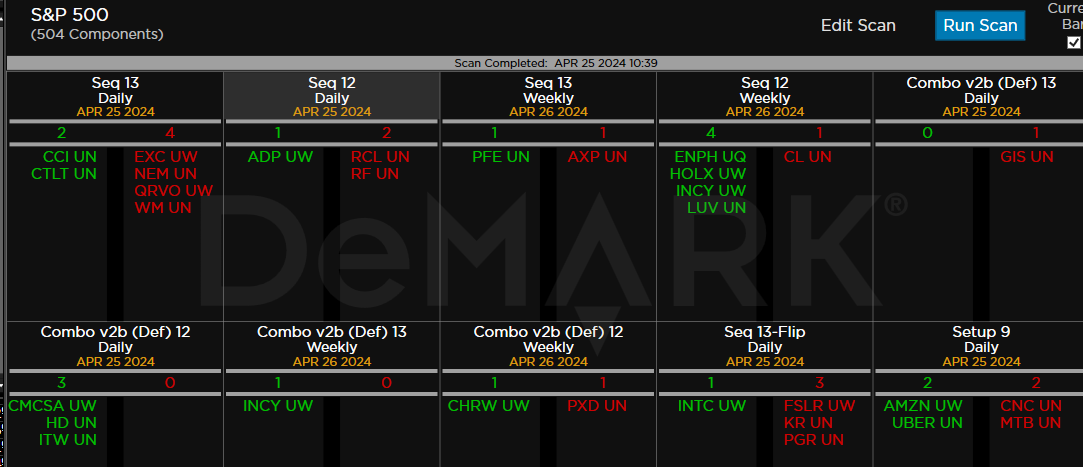
Major ETFs among a 160+ ETF universe.
If you have any questions or comments, please email us. Data sources: Bloomberg, DeMark Analytics, Goldman Sachs, Street Account, Vital Knowledge, Daily Sentiment Index, and Erlanger Research