
In The Wizard of Oz, when Dorothy and her pals finally meet Oz, it was, to say the least, a letdown. The Great Wizard of Oz is an ordinary man hiding behind a curtain. He doesn’t get Dorothy back home (it’s a good thing she didn’t get on his balloon), and the Scarecrow, Tinman, and Lion figure out they have what they thought they were missing all their lives.

Investors have been like this donkey for several years, buying and chasing overvalued stocks ahead of the new Central Bank stimulus, which is now coming soon.

Powell told the world today that “The time has come” for the Fed to start cutting rates.
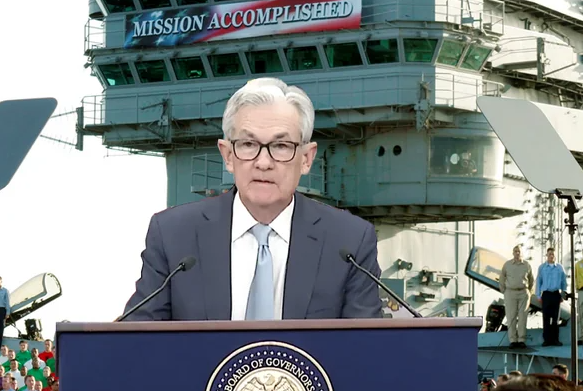
The Fed pivots historically have seen bear markets begin. The “Don’t fight the Fed” mantra has been violated as people have bought stocks with the Fed in a restrictive stance. And now with the Fed starting a cutting cycle is this like meeting Oz and investors will be soon disappointed with the effectiveness of preventing more job loss and economic weakness?

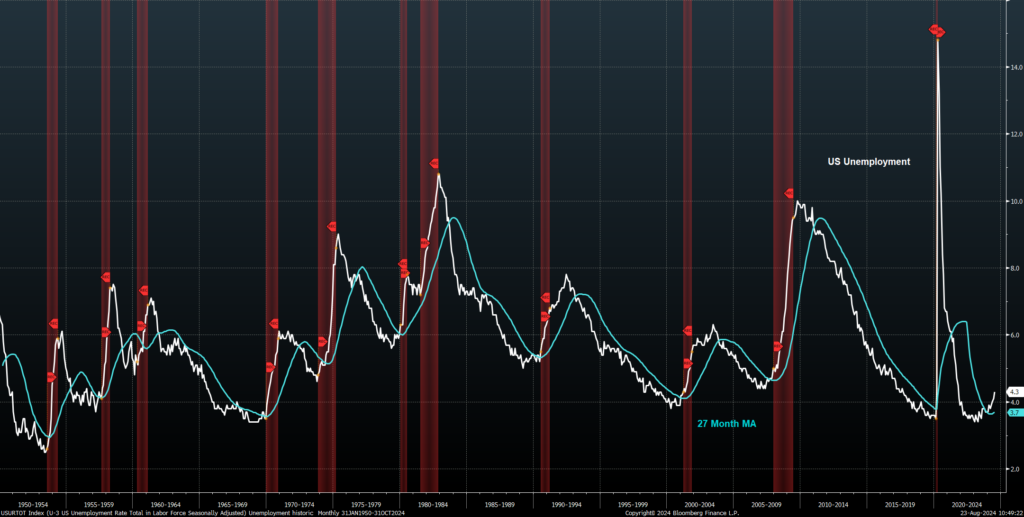
My friend Julian Brigden sent me this chart of the US unemployment rate showing a hook higher above the 27-month moving average. Every time, employment has continued to increase with a recession following. I’ve said often that when unemployment starts to turn up or down, it lasts considerably longer than most expect – multiple quarters or even years. Current market participants expect rate cuts to work the same as during the quick Covid unemployment spike, I presume. “We do not seek or welcome further cooling in labor market conditions.” Powell said, adding that the slowdown in the labor market was “unmistakable.” This will put more pressure on the markets as a measure of the Fed rate cuts being effective.
My own “meeting Oz” experience was when a friend bought an Audi Sport Quattro, my dream car from the 1980s, as it was the benchmark world rally championship car. When I got to drive it, I was sadly incredibly disappointed. The steering was terrible, acceleration was lackluster, and turbo lag took forever to kick in. This is what I expected. For you rally fans enjoy.

Quick Market Views
Stocks: Short squeezing today is evident with the GS Most Shorted basket up 3.5% which has correlation with the Russell indexes. The Fed has laid out their cards expecting the path to 2% inflation to continue while containing job losses. This puts more pressure on future economic data where bad numbers will be seen not as market friendly. It’s been a very choppy day with S&P and Nasdaq 100 holding yesterday’s lows on several attempts on the downside. Liquidity is low with many out on vacation and we should expect the same next week.
Bonds: Rates are down after Powell’s speech. 2’s are down 8bps, 10’s down 3bps, and 30’s down 2bps. The 2/10 spread is steepening to -10bps.
Commodities: Very strong day across board with a few exceptions. Crude is up 2.75%, Natural Gas down 1.75%, Copper up 1.5%, Gold up 1%, and Silver up 2.5%
Currencies: US Dollar Index is down hard -0.75% with Euro and Pound strength. Yen is also stronger after Ueda’s hawkish comments. USDJPY is now at 144.50 and I’m old enough to remember when the strong yen caused all sorts of unwind chaos. Bitcoin is up nearly 3%
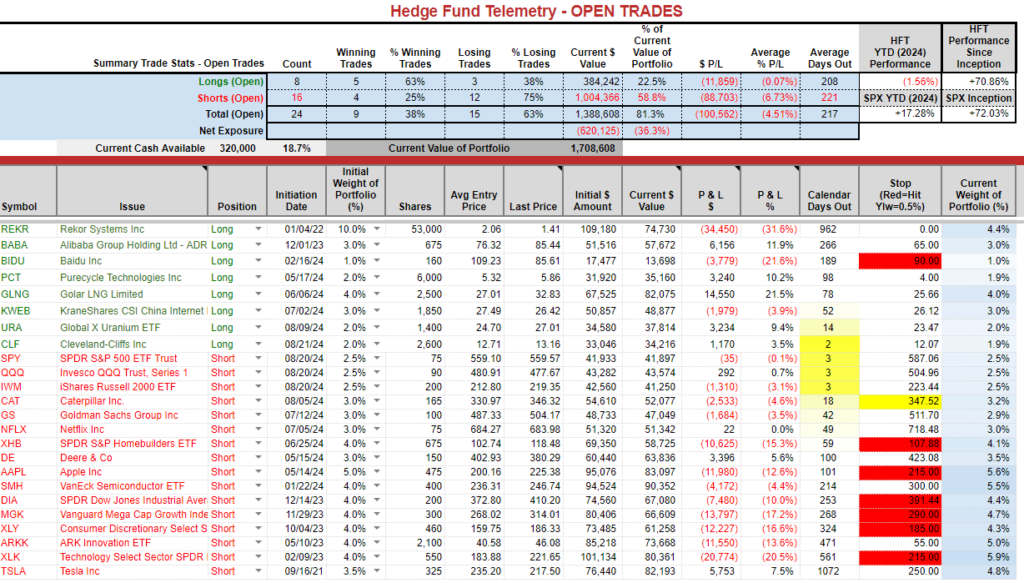
Trade Ideas Sheet: Net short 36%, Cash allocation 19%. Longs mitigating short underperformance
Changes: In this chop today I’d rather wait to do anything until next week when the market digests Powell pivot.
Thoughts: URA and CLF recent new longs doing well out of the gate and are still actionable. I still like adding if not short SPY and QQQ. I will probably add to these and IWM (when it gets the sell Setup 9) XHB is on day 11 of 13 with Sequential and will add with the 13. I took off some short exposure on the last dip (not enough I know) and will add there perhaps after NVDA next week.
US Market Indexes
Here is a primer on the DeMark Setup and Sequential indicators.
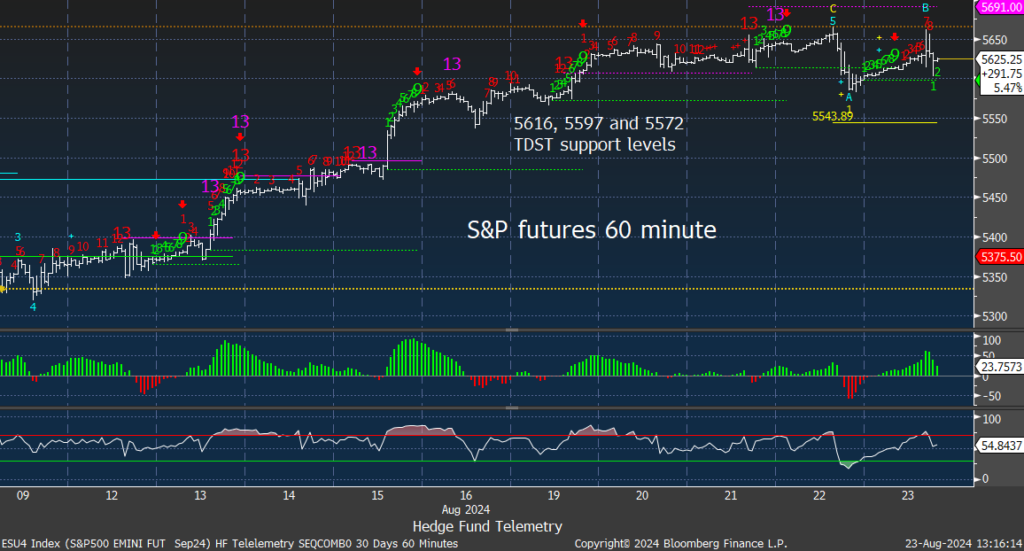
S&P futures 60-minute tactical time frame with choppy action today with a pending Sequential on hour bar 8 of 13. Watch the TDST Setup Trend green dotted line support
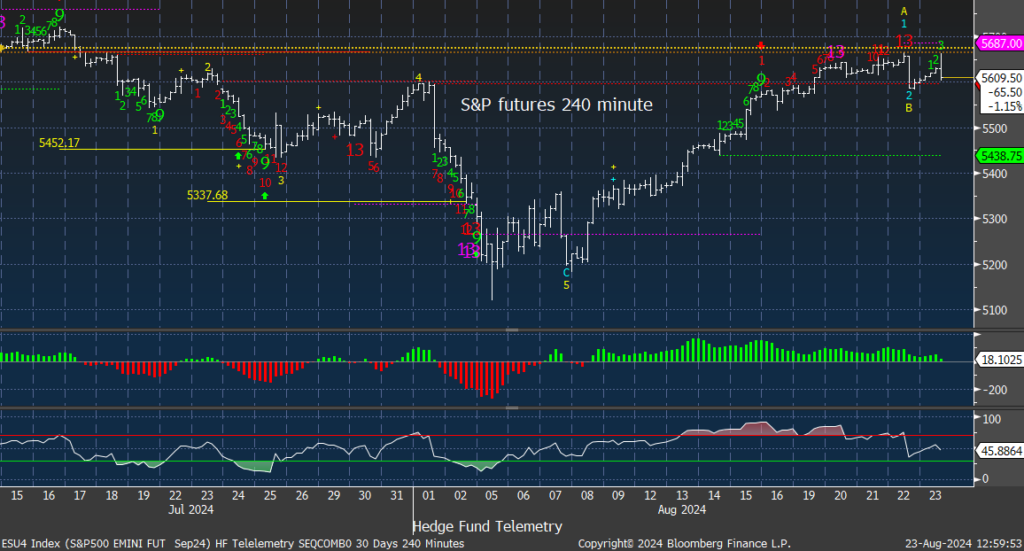
S&P futures 240-minute tactical time frame with a wide bar but holding yesterday’s low
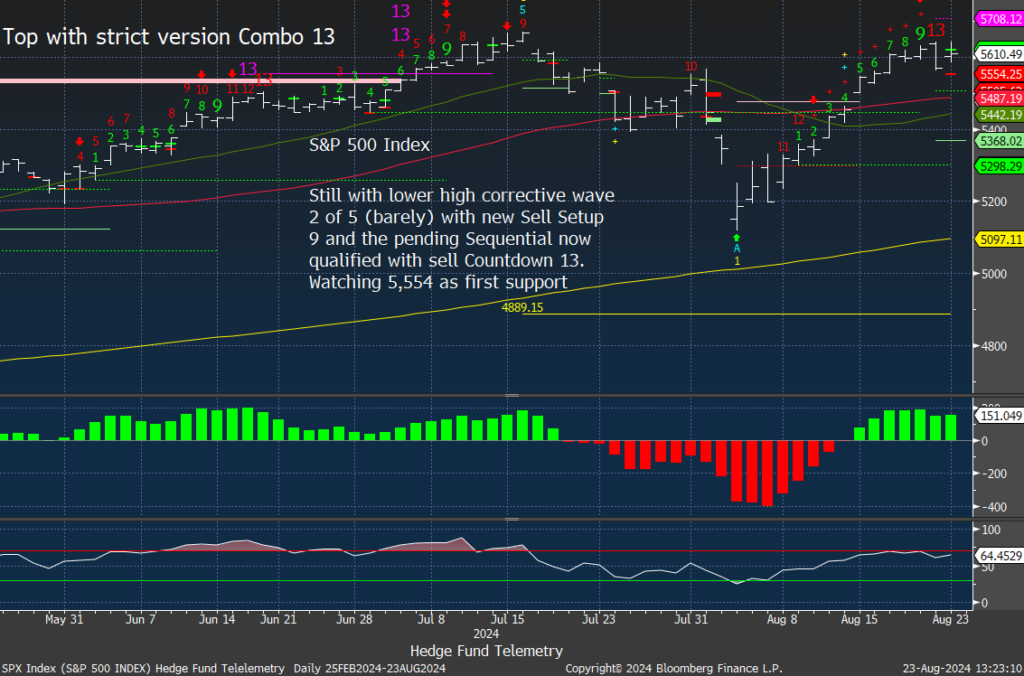
S&P 500 Index daily has the DeMark Sequential sell Countdown 13 and sell Setup 9 in play. 5,554 is an important level to watch. TD Reference : 4 day close off recent high
Nasdaq 100 futures 60-minute tactical time frame also has a pending Sequential on hour bar 7 of 13. Breaking the first TDST line would be a concern if this happens towards the close.

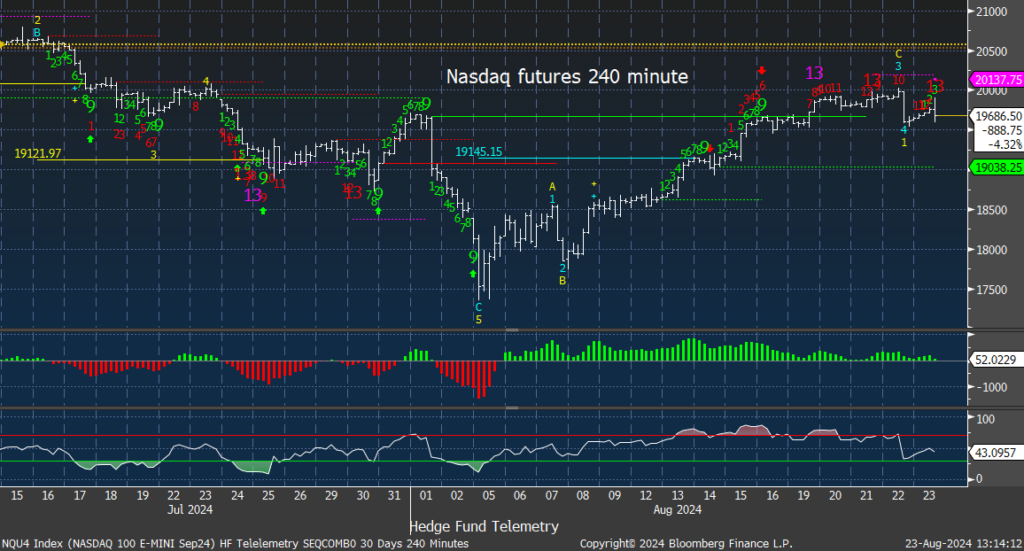
Nasdaq 100 futures 240-minute tactical time frame has a secondary Sequential sell Countdown 13, which is because there were two Setup 9’s, and Sequential countdowns can only start after completing Setup 9’s. Yesterday’s low so important
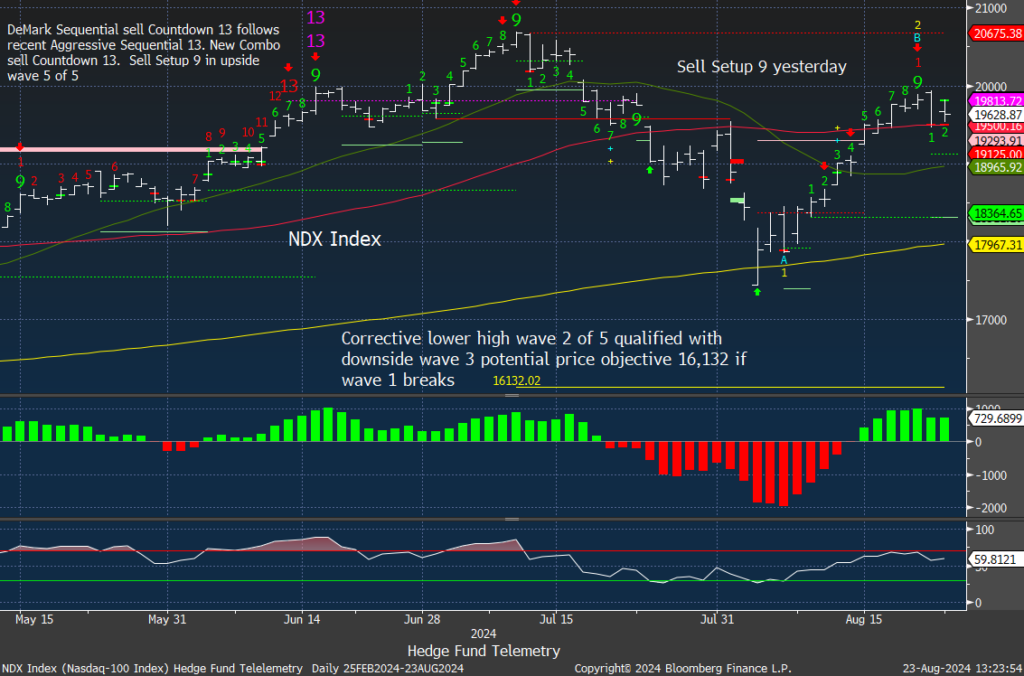
Nasdaq 100 Index daily off the highs and slightly below the opening price. 50 day was touched yesterday and is next week’s line in the sand.
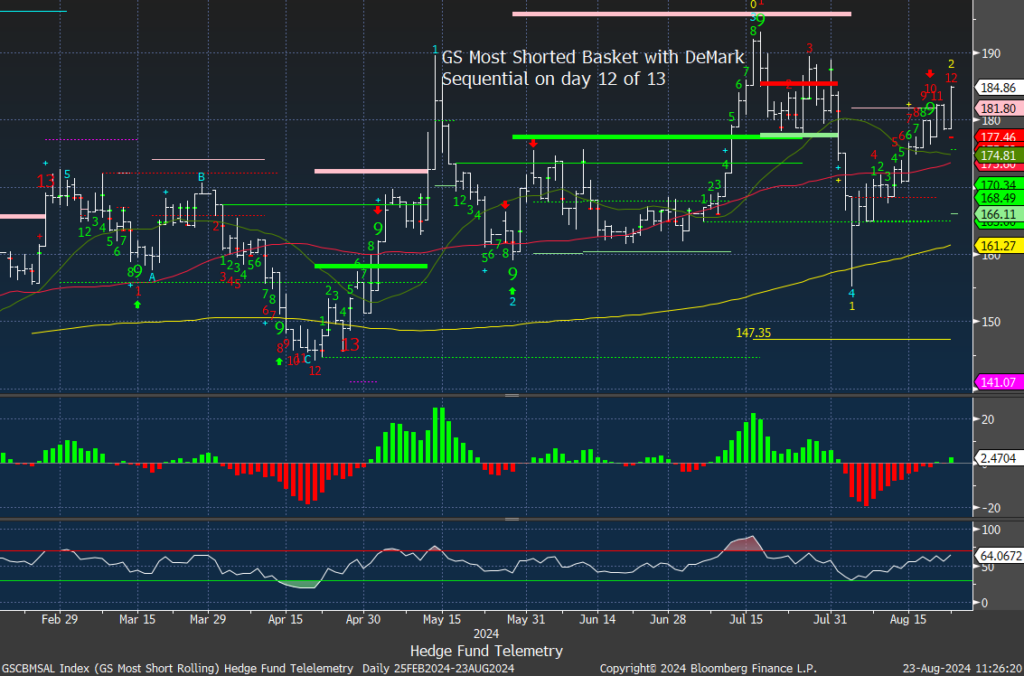
IWM Russell 2000 squeezing higher today with DeMark Sell Setup on day 7 of 9. There has been a lot of correlation with the Goldman Sachs Most Shorted basket which will get the Sequential sell Countdown 13 on Monday.

Trade Ideas Sheet
URA Uranium ETF is spiking today and the chart still looks very good. This is why:
(Bloomberg) — Kazakhstan, the world’s No. 1 uranium miner, cut its output plan for next year amid project delays and a lack of sulfuric acid needed to pump the radioactive metal from the ground.
Kazakhstan adjusted 2025 uranium production plans to 25,000 tons to 26,500 tons from “initial intentions” of 30,500 to 31,500 tons, state-run Kazatomprom said Friday in regulatory filings. The new 2025 plan implies about 12% growth compared with 2024 guidance of 22,500 tons to 23,500 tons, the company said.
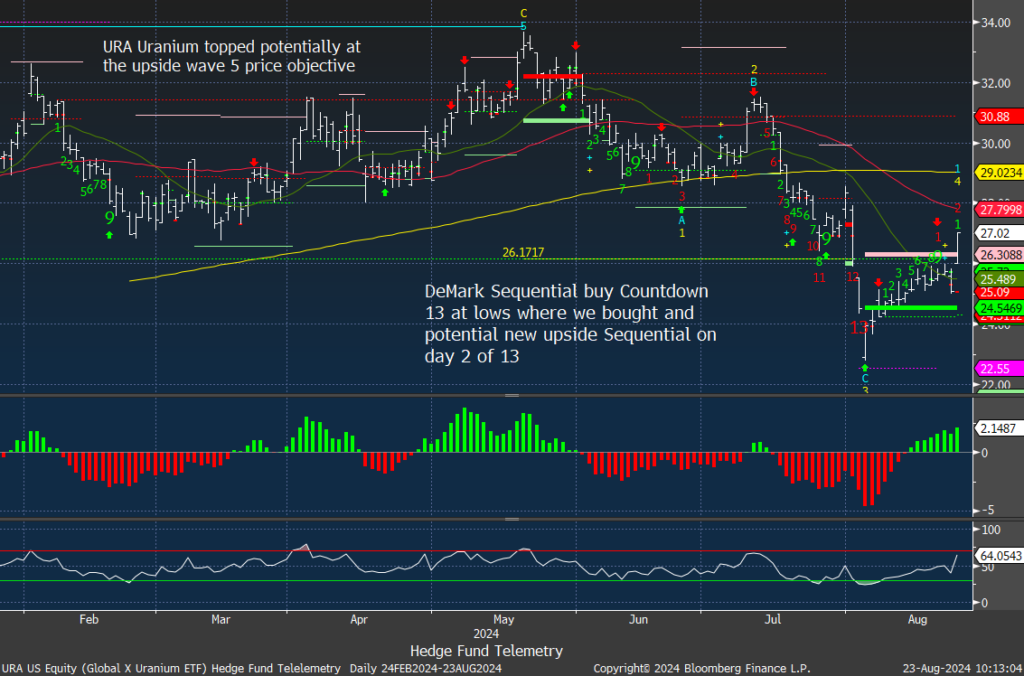
And as Borat from Kazakhstan would say “Very Nice”

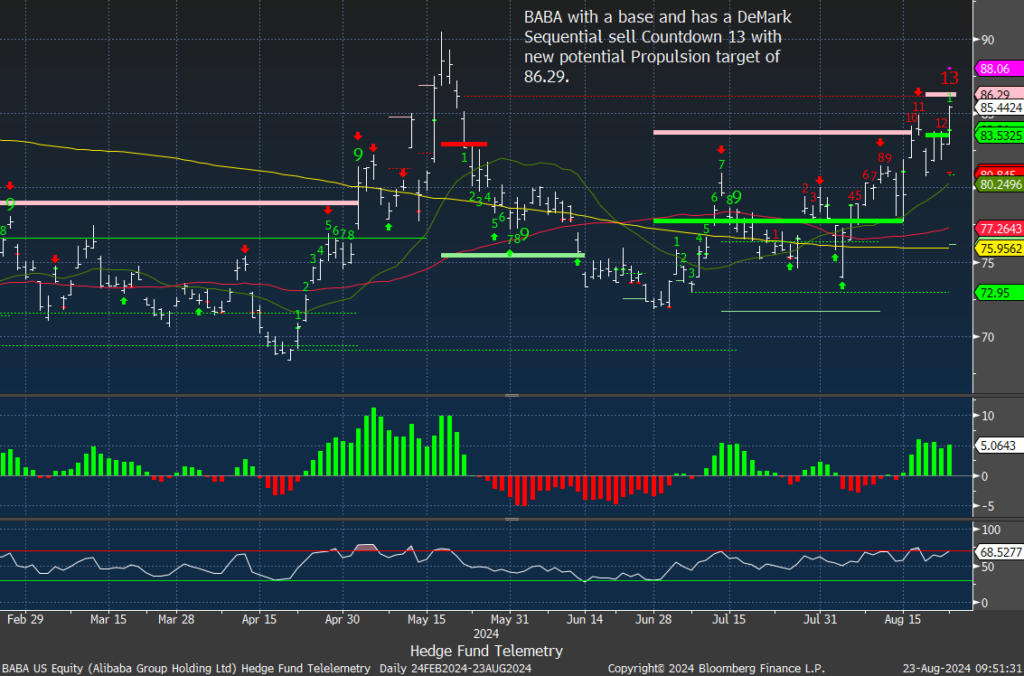
BABA is up today with the duel listing taking place on August 28th. This, however, does have the anticipated Sequential sell Countdown 13, so it could limit the upside. I trimmed some the other day and will hold what I have and see how this trades through the end of the month.
A few concerning charts to watch
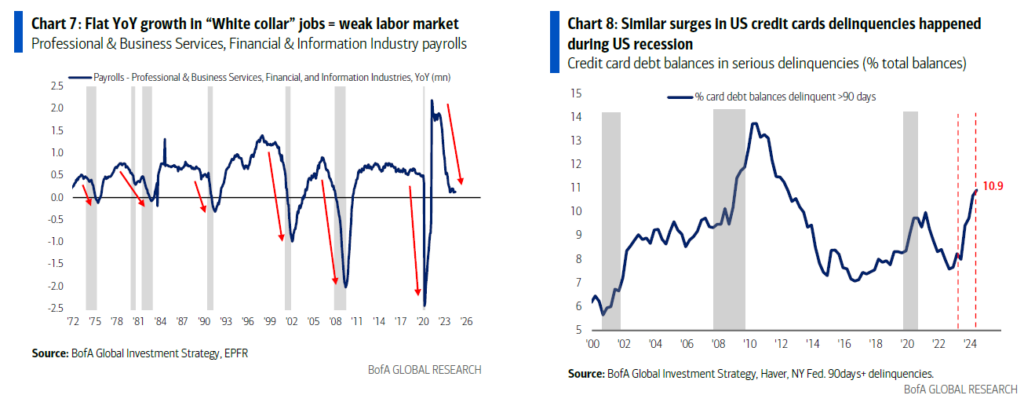
A few charts from Bank of America today add to the argument that the Fed should start cutting.
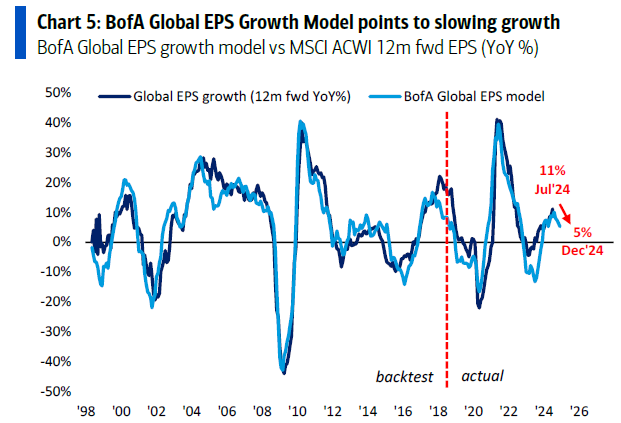
Weak labor market data with ‘white collar’ jobs (higher paying) and US credit card delinquencies increasing. Both of these charts add to the potential for a coming recession.
Tony Pasquareillo of GS posted a new note today. He typically has a generally optimistic view, but today was a bit more cautious for him with a “large dose of humility and open-mindedness.” Still sees a solid foundation in the markets but “risk-reward is not overly compelling right here. It’s still a bull market and the primary trend remains higher … but, I expect the trading environment will be choppy over the next three months … “
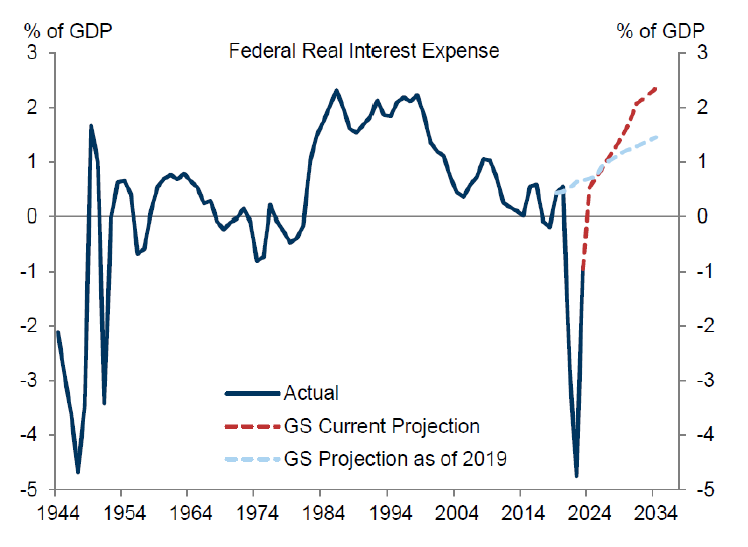
He posted these charts, which are on my mind as I consider two candidates with no policies to curb out-of-control government spending. I disdain both parties and candidates, and I’m not voting for the lesser of two evils. I respect your opinions; you can vote for whoever represents you best. These charts of US debt will sadly affect everyone.
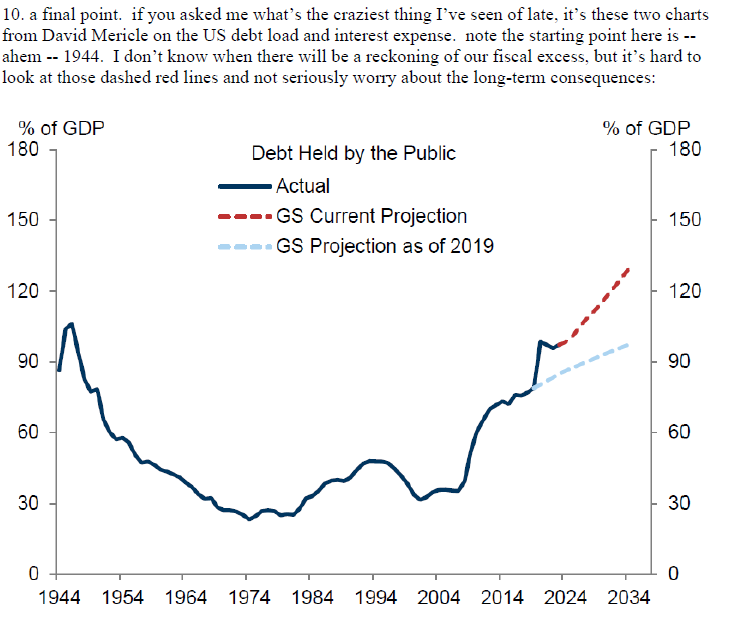
Both parties share responsibility for the out-of-control spending. To think that the current deficit is nearly $2 trillion, with a strong economy, the US debt is expanding by $1 trillion every 90 days. I project that by the next election in 2028, it will hit $50 trillion from $35 trillion.
Hedge Fund Telemetry ETF Percentage Price Oscillator Monitor
The PPO monitor (percentage price oscillator) force ranks ETFs by percentage above/below the 50-day moving average. For information on this monitor, please refer to this primer. This monitor and others are offered to Hedge Fund Telemetry subscribers on Bloomberg. There are a lot of strong gains today however, the SPY and QQQ and some others are trading below today’s VWAP levels

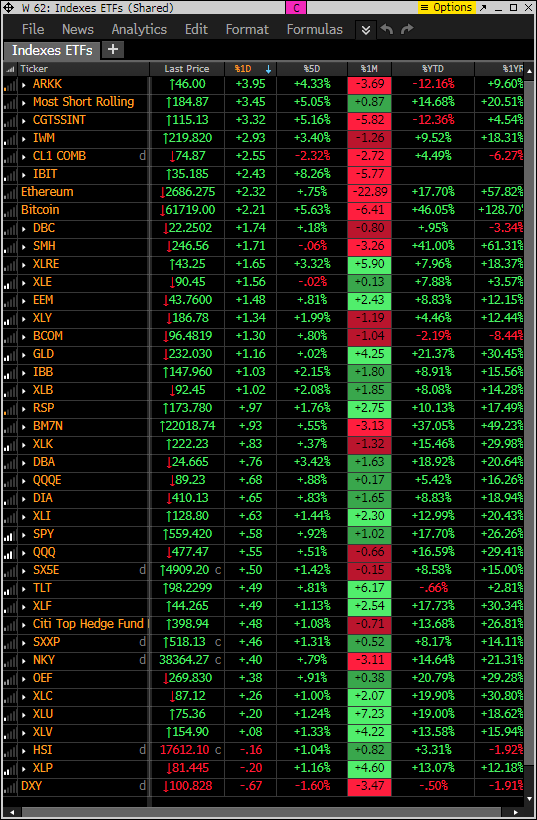
Index ETF and select factor performance
This monitor with various markets and factors ranks today’s performance with 5-day, 1-month, and 1-year rolling performance YTD. Short baskets are squeezing higher taking the Russell correlation with it.

This is a similar monitor with major ETFs. Apparently, ARKK likes Fed rate cuts.
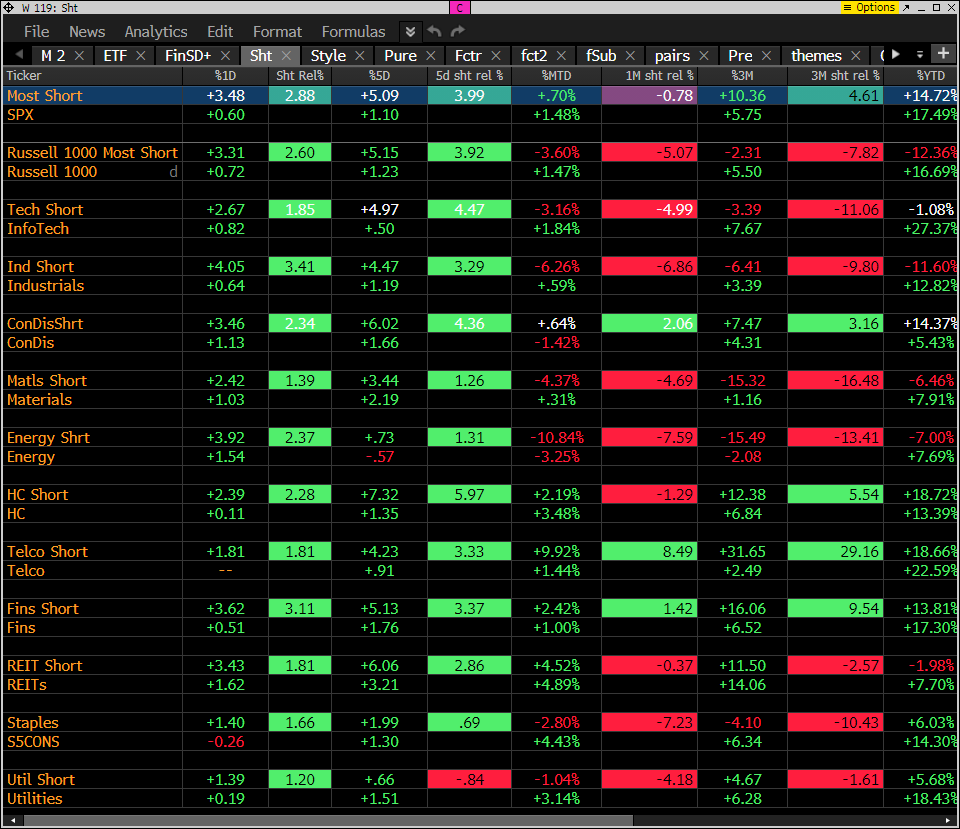
Goldman Sachs Most Shorted baskets vs. S&P Indexes
This monitor has the S&P indexes and the Goldman Sachs most shorted baskets. Clear short squeeze today with the most shorted basked up 3.5% with the S&P up only 0.6%. Russell 1000 most short basket up 3.3%
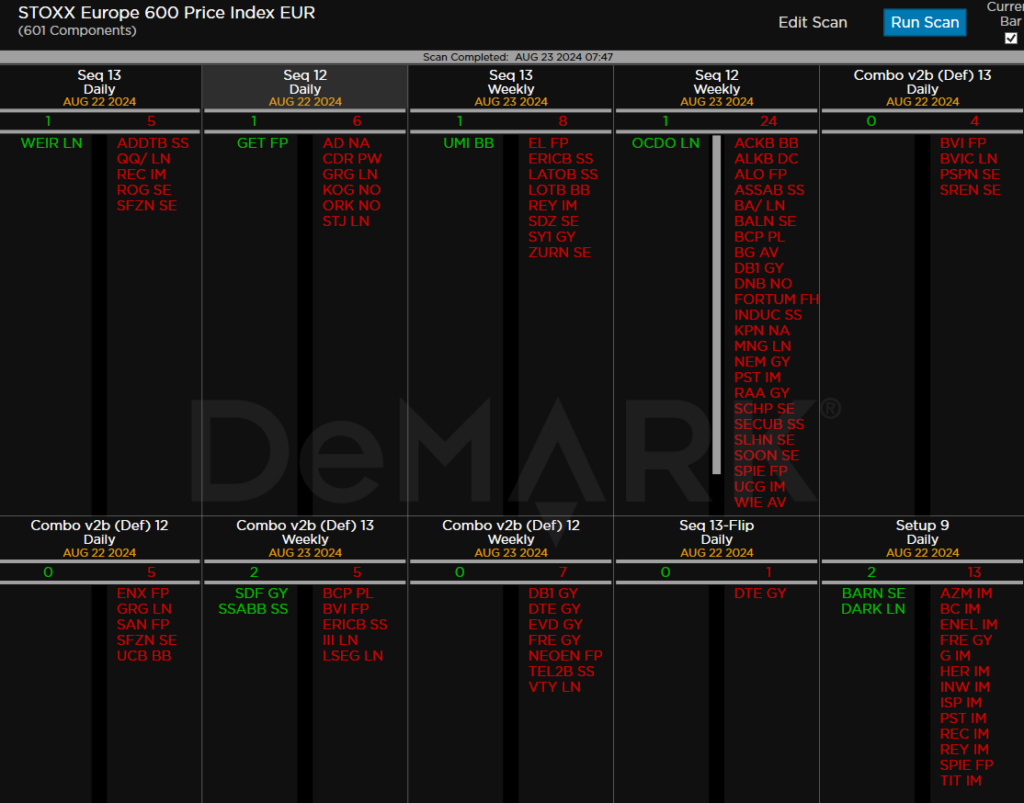
DeMark Observations
Within the S&P 500, the DeMark Sequential and Combo Countdown 13s and 12/13s on daily and weekly periods. Green = buy Setups/Countdowns, Red = sell Setups/Countdowns. Price flips are helpful to see reversals up (green) and down (red) for idea generation. The extra letters at the end of the symbols are just a Bloomberg thing. Worth noting: The majority of signals in the past week have been very concerning as there were over 200 new Sell Setup 9’s and continued high number of Sequential and Combo sell Countdown 13’s and on deck 12/13’s on both daily and weekly time frames.
Major ETFs among a 160+ ETF universe. Same story with the ETF list.

If you have any questions or comments, please email us. Data sources: Bloomberg, DeMark Analytics, Goldman Sachs, Street Account, Vital Knowledge, Daily Sentiment Index, and Erlanger Research