
It’s a market of haves and have not’s. Valuations on the mega-cap seemingly don’t matter, as there has been a persistent inflow regardless. I have a lot of stuff below to check out with a view of sectors and some good charts from GS with relative performance vs the S&P. You’ll see the haves and have-nots. This is a crazy and dangerous market. The most speculative I’ve ever seen.
It’s been an unreal chase higher, narrowly led by the mega-cap, while internals don’t look good, and many sectors have been declining. The amount of market cap gains on some is unsustainable and poses a huge risk. If this is a market with the music playing and people dancing, I’m afraid when the music stops the declines will see some of the largest market cap declines ever. With the S&P and now Nasdaq 100 both with weekly DeMark Sell Countdown 13’s, it’s hard to fathom the markets ever going down, but these are the signals that are always there at the tops and for those that can be remembered at the bottoms, too.
I’m on with Maggie Lake on her YouTube channel today at the close. Maggie was the host for the Real Vision Daily Briefing and is doing her own thing now. Hit the subscribe button for her channel and watch me today try to explain some of the stuff I’m seeing today and views for 2025.
TRADE IDEAS
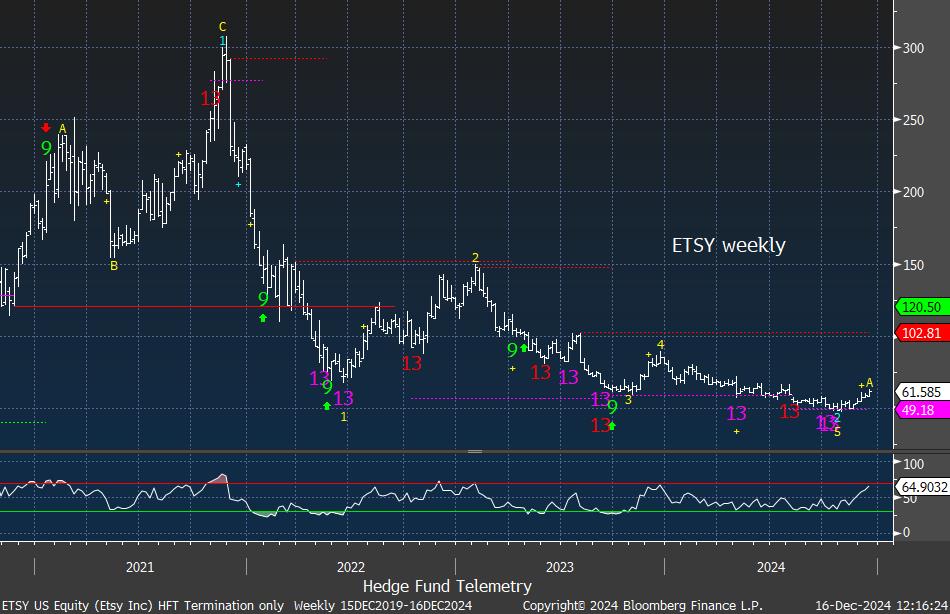
I’m adding ETSY as a new 2% long idea as I see the potential for a breakout over 60 working with upside Sequential in progress. The weekly below shows the oversold and deep move that has happened.

US MARKETS
S&P 500 futures 60-minute time frame
S&P daily has had a bunch of sell Countdown 13’s anad sell Setup 9’s with nominal pullbacks.
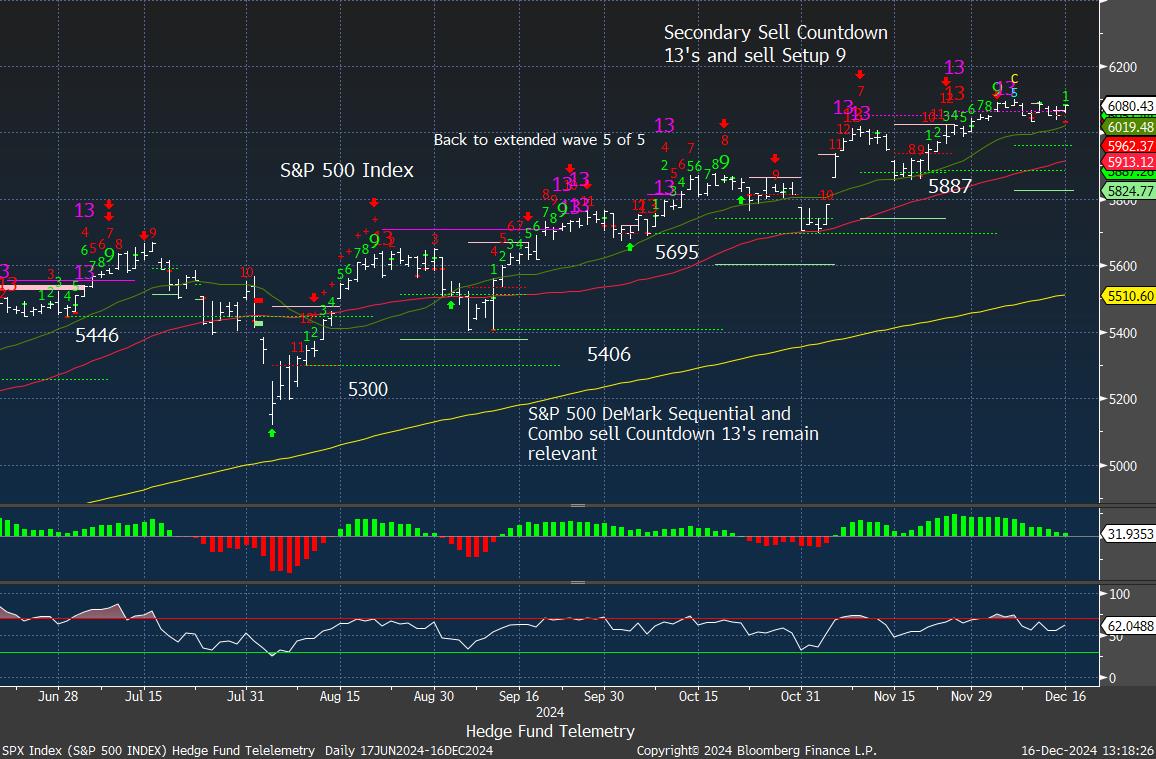
S&P weekly does have both Sequential and Combo 13’s at the highs. No roll over yet.

Nasdaq 100 daily grinding higher thanks to the Mag 7 – see all the stuff below on my view

The weekly NDX chart did qualify a new Sequential sell Countdown 13. This, if anything, should see some reversal in the coming weeks.

Russell 2000 daily has been fading

Dow Jones fading

2025 will be all about the mag 7
My friend Jim Bianco posted these charts of the Mag 7 weighting and impact for the S&P. The weighting is 34% of the index and as long as inflows come in the mag 7 get the majority of the inflows. It works until it doesn’t. If the Mag 7 starts to give way on the downside (it will) and with massive market caps now the damage could be significant. All of the Mag 7 are at valuations that are at or near all time highs. One of the things on my growing list that I expect for 2025 is unprecedented market cap declines. Tesla, for example, is up nearly $700 billion since the election and now nearly at $1.5 trillion just since the election with a business not growing. What will happen if $1 trillion in market cap is lost?


US SECTOR ETF FOCUS
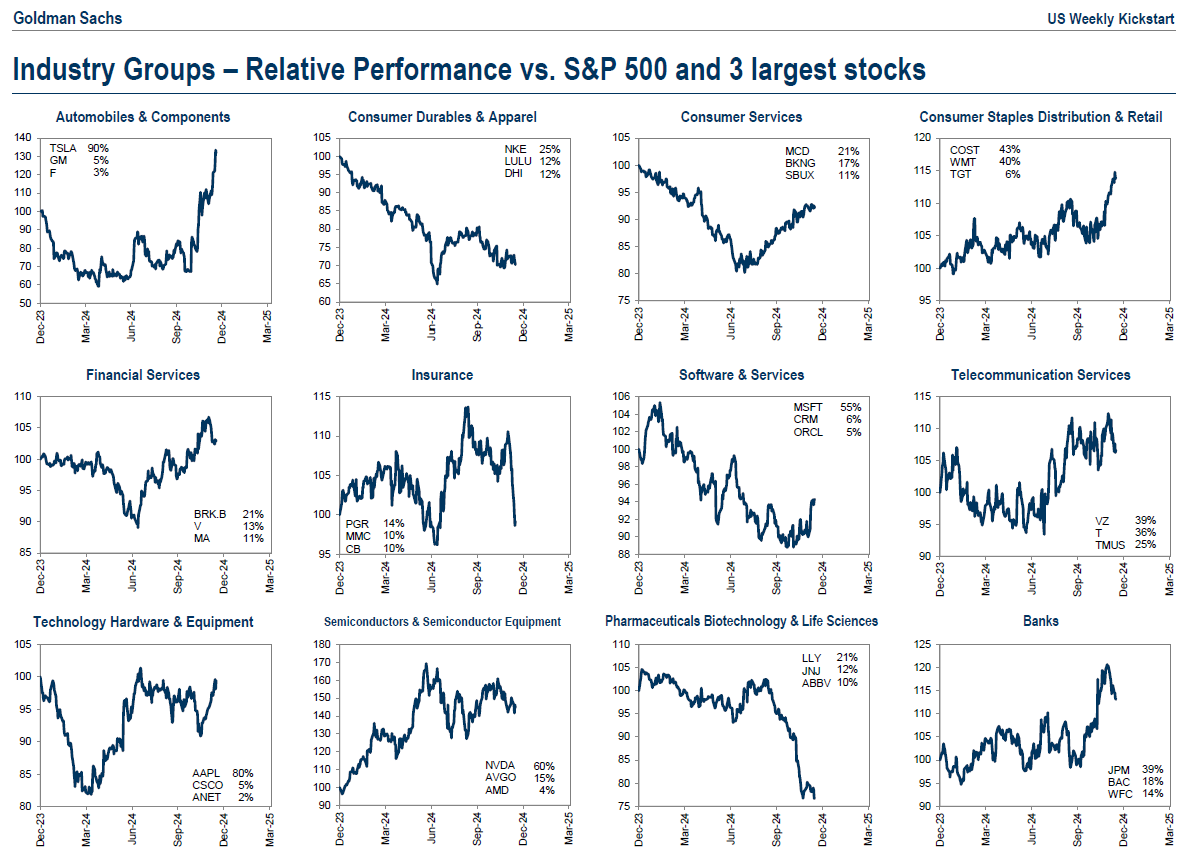
Goldman Sachs had some good sector charts that I thought I’d share. The relative performance vs the S&P really has just a few sectors outperforming and the top stock within those leaders have outperformed in an unsustainable fashion in my opinion. If this is a bull market, it’s narrow.


Here are my charts with comments on charts. It shows a lot of haves and have not’s
XLK Technology

XLY Consumer Discretionary

XLI Industrials

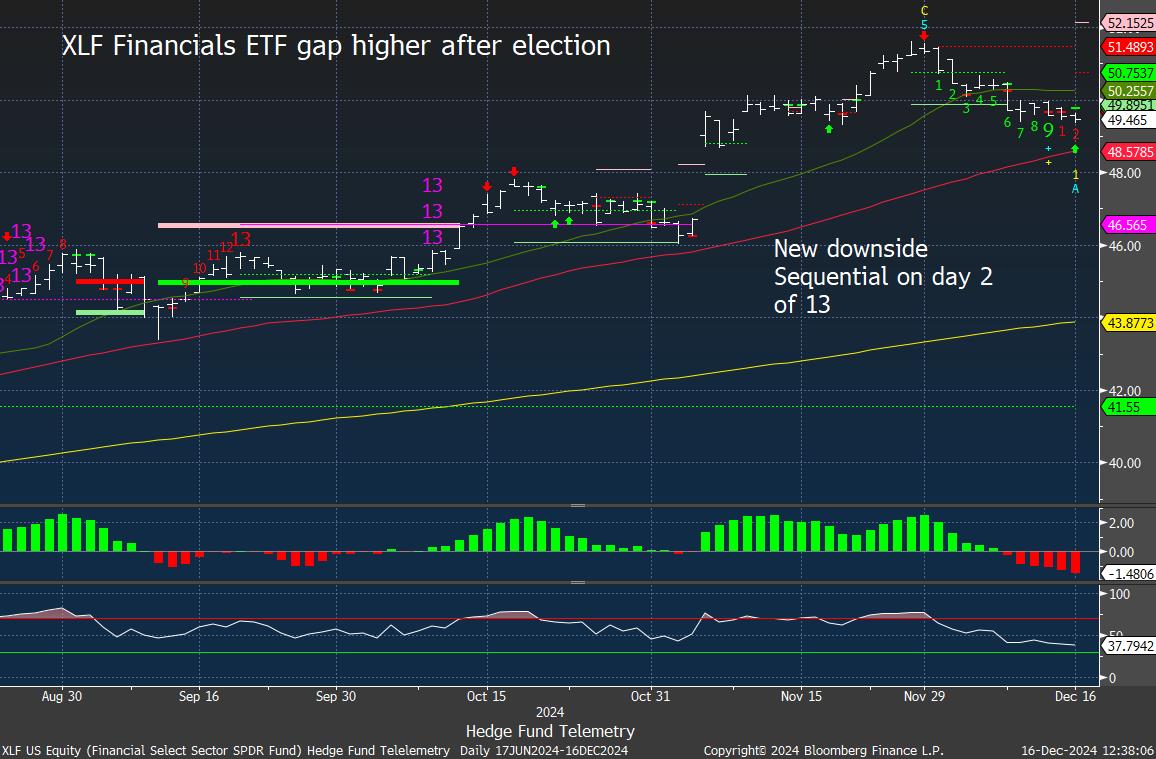
XLF Financials
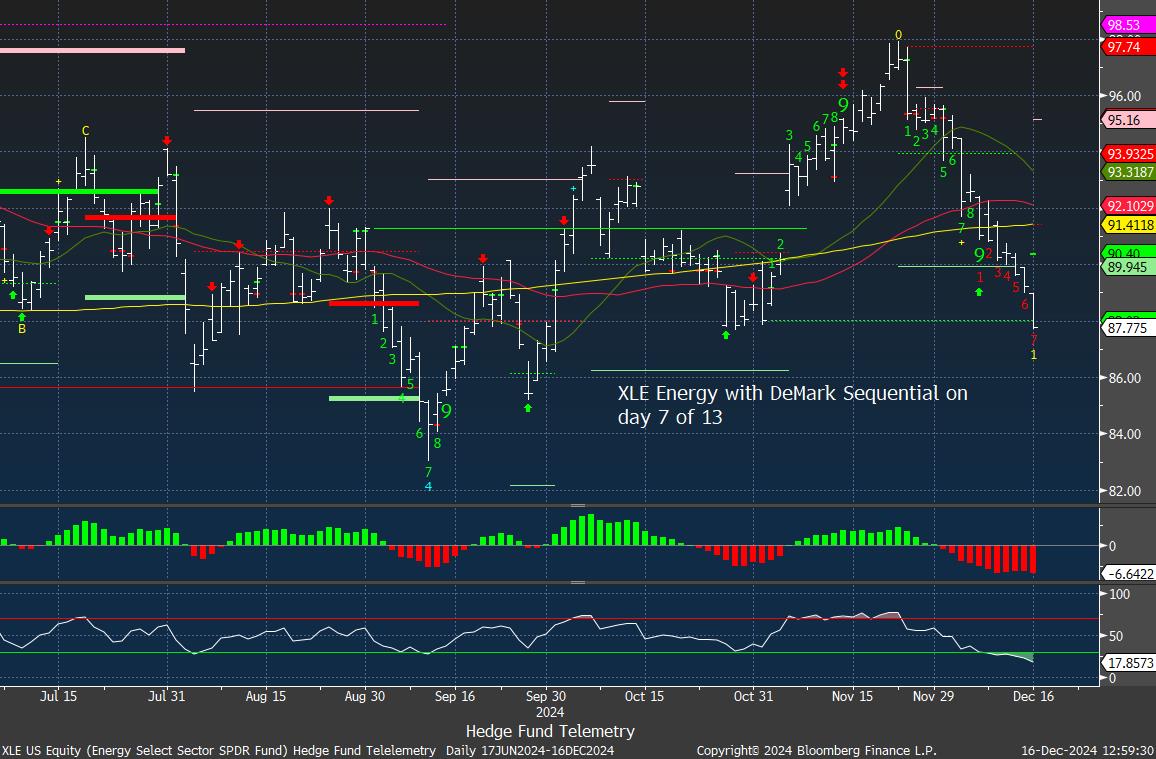
XLE Energy
XLV Healthcare

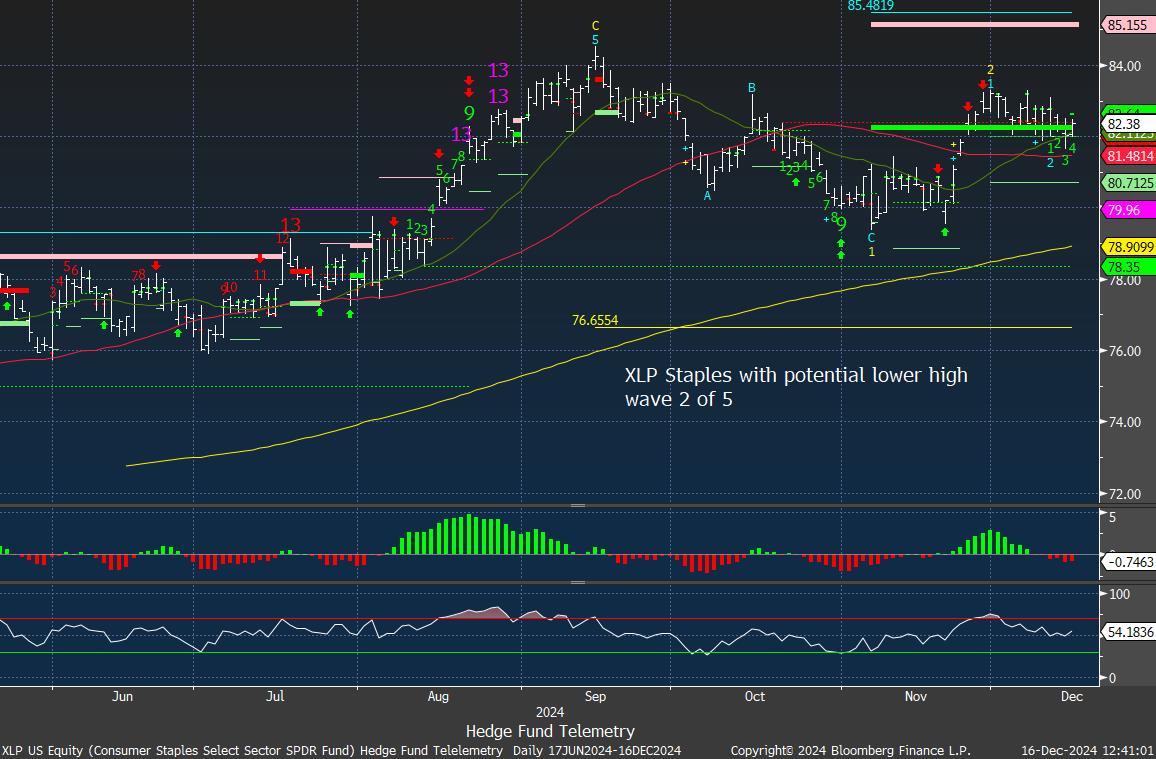
XLP Consumer Staples
XLC Communications Services

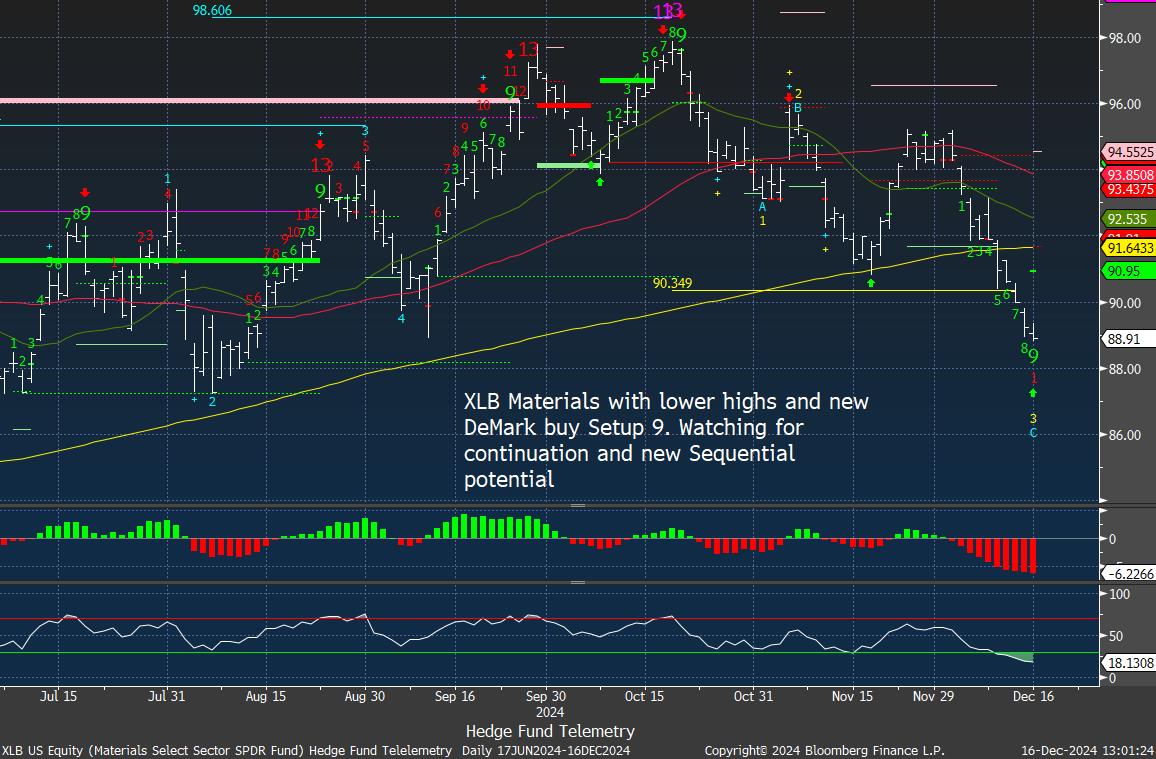
XLB Materials
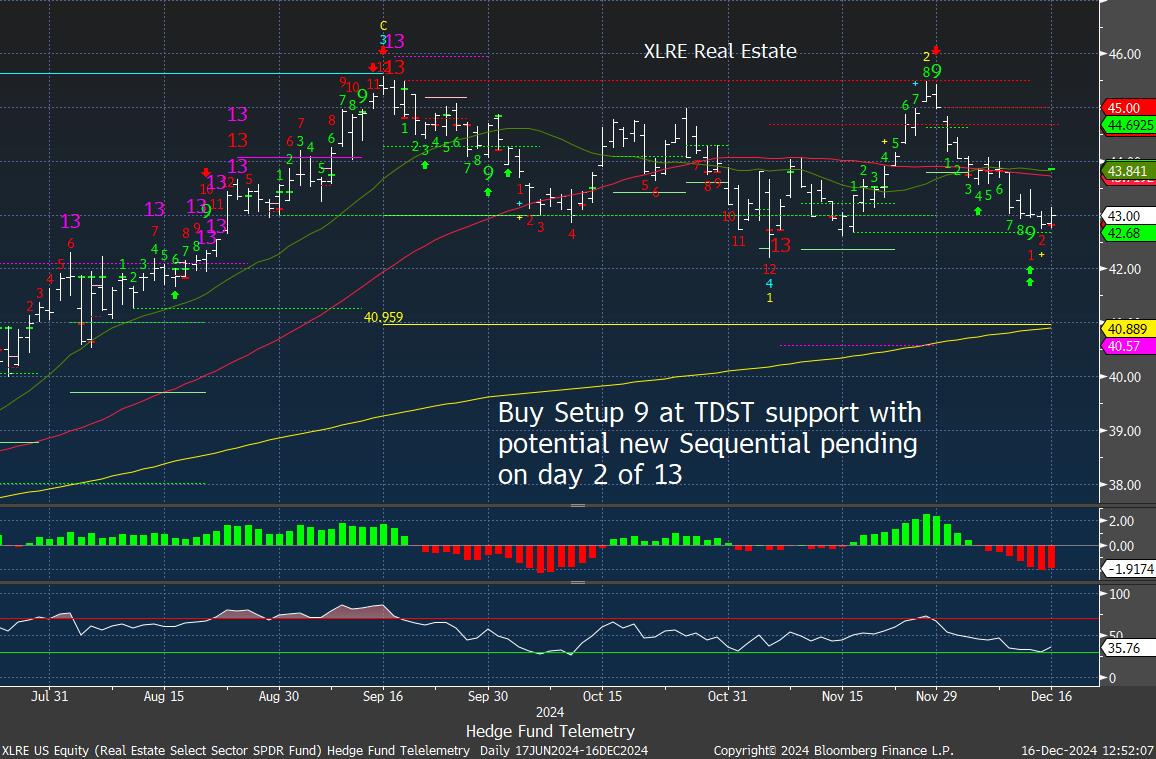
XLRE Real Estate
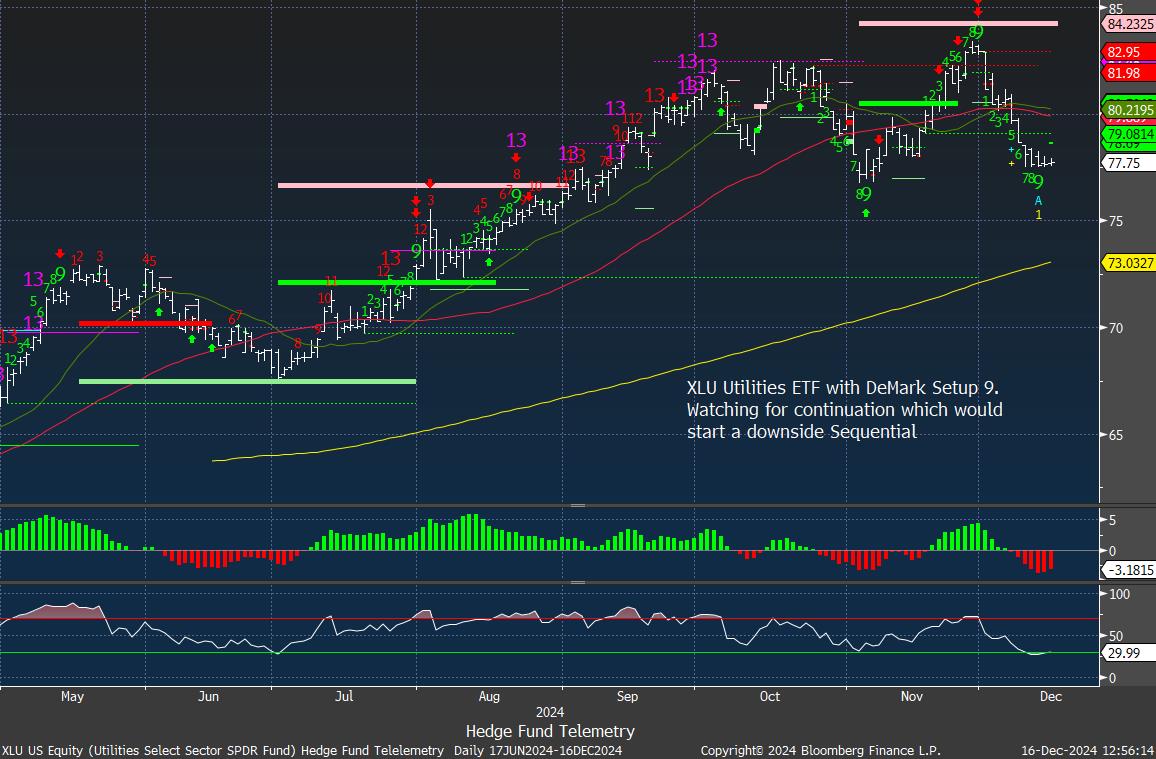
XLU Utilities
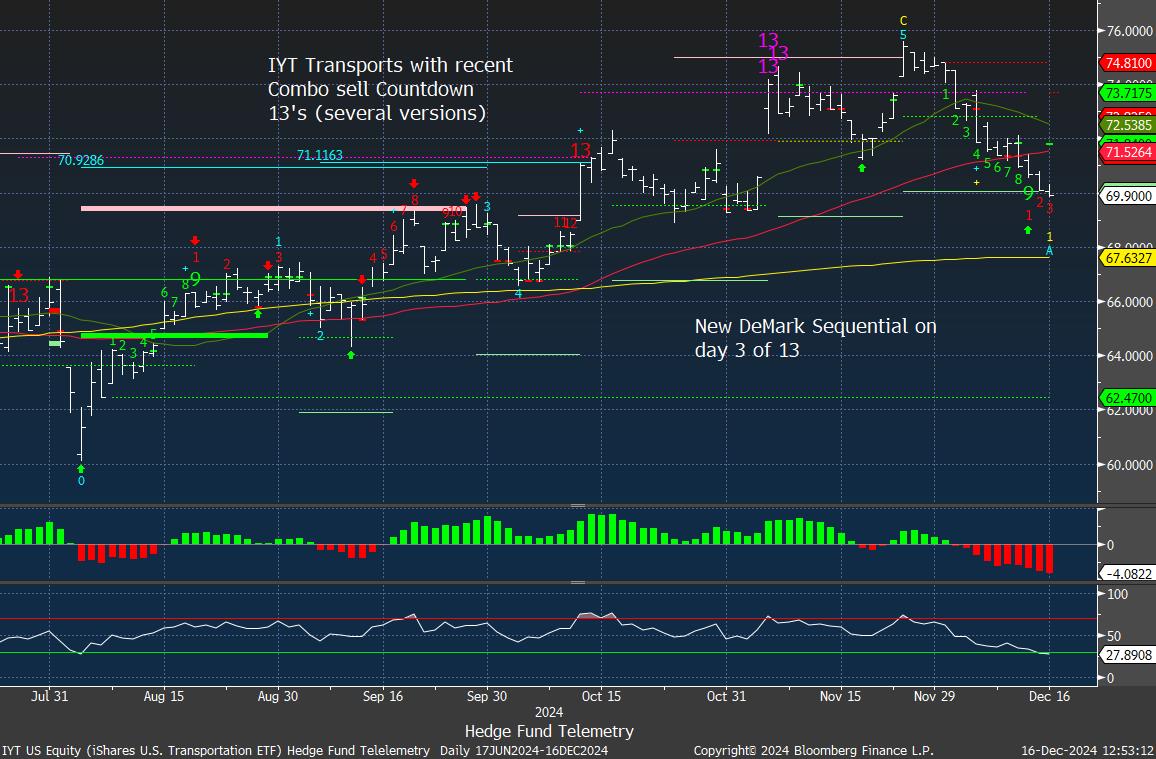
IYT Transports
ARKK with COIN and Tesla is extremely overbought with sell Countdown 13’s

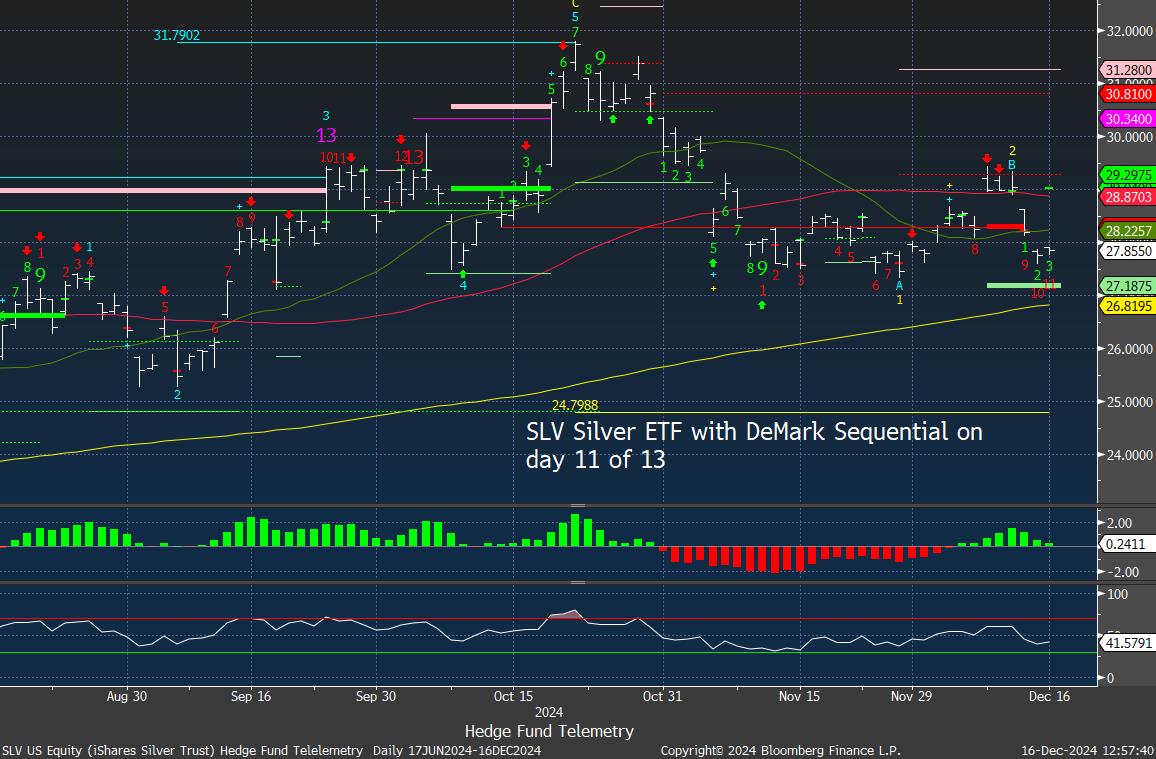
GLD, GDX, SLV, and Copper miners have been weak and have some DeMark buy Countdown 13’s developing. I’d prefer if these get the Sequential 13’s at lows which might not happen.


URA Uranium has pulled back as we had expected and could be a buy soon but if there is continuation in the next few days a new Sequential will begin.

Internals – not looking good
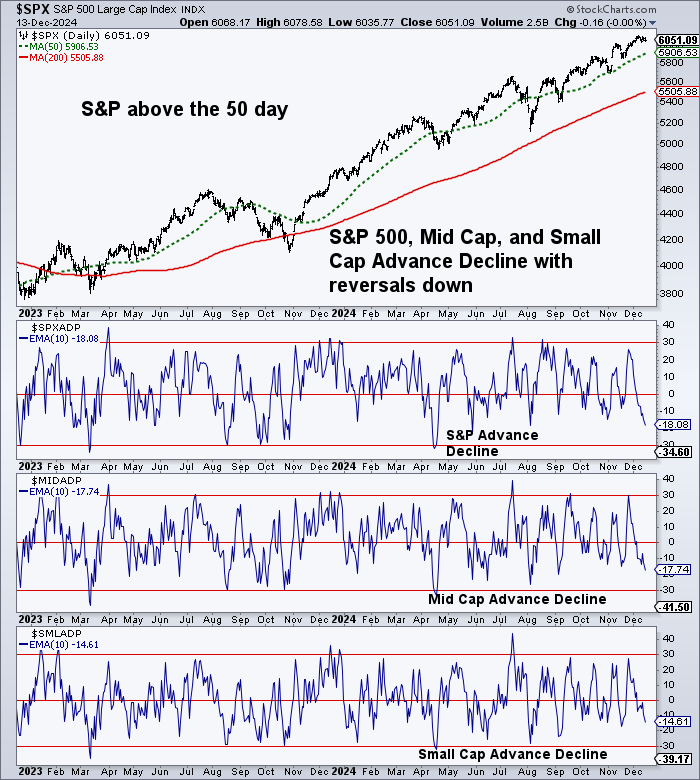
Advance Decline data has been weak. It’s not great today either but not terrible.
S&P 500 percentage of stocks above the 20, 50, and 200-day moving averages have been moving lower and I would love to see these get oversold. One risk is the mega-cap give way and push every thing lower which I would also not be upset about since this data has not been able to get oversold all year.

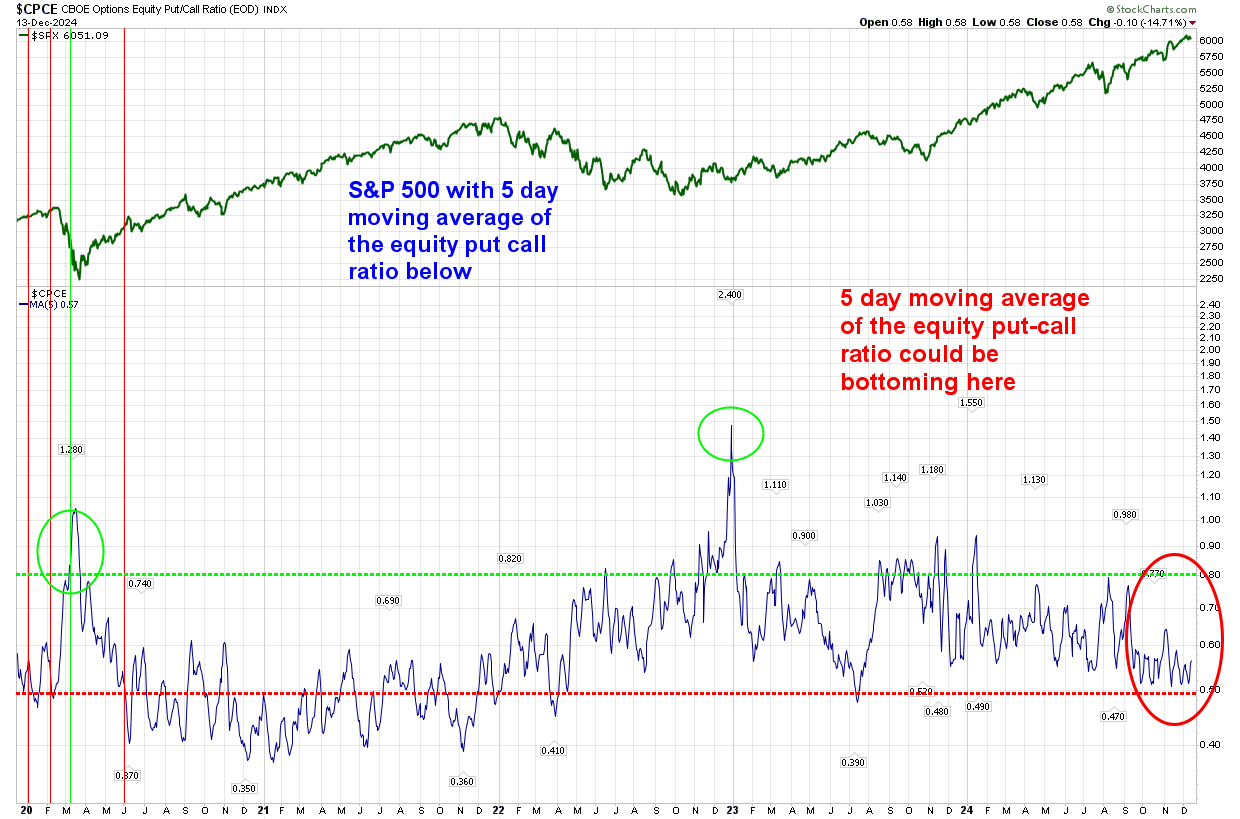
5 Day Moving Average Equity Put/Call Ratio has been trying to bottom. A spike in put buying would be a welcome sign for fear in the market and a buying opportunity.
S&P with McClellan data shows the indicators dropping a major divergence with S&P price action.

ETFs, GOLDMAN SACHS SHORT BASKETS AND PPO MONITOR UPDATE
A have and have not market with many working with too much too fast upside in the last month and some seeing negative to nominal gains in the last month.

This monitor has the S&P indexes and the Goldman Sachs most shorted baskets. Short baskets are very mixed with tech short basket leading on the upside

The PPO monitor (percentage price oscillator) force ranks ETF’s by percentage above/below the 50 day moving average. For information on this monitor please refer to this primer. This monitor is offered to Hedge Fund Telemetry subscribers who are on Bloomberg. Notable: The number of ETFs hitting 20 day lows continues to be very high which is remarkable considering the S&P and NDX index action.

Demark observations
Starting to see some buy Countdown 13’s with some oversold stocks. AAPL with weekly Sequential and Combo sell Countdown 13’s

