- A few thoughts and informative charts below show the underlying weakness.
- Most sectors and stocks are below the 10, 20, and 50-day moving average, and there are more stocks within sectors with new 52-week lows vs highs, yet everyone still sees the “market” as “this is fine“.
- There are many sectors and some indexes below the election levels, giving up a lot of gains, and considering the huge inflows after the election, there are people who bought higher trapped.
- Many indexes and sectors have downside DeMark Sequential Countdowns in progress.
- Market leadership has been narrowing which is typical at the end of runs. Market attribution and concentration in the Mag 7 and top 10 S&P stocks has never been higher.
- Will 2025 bring a “catch down” with the concentrated Mag 7 falling down to the average stock?
- This will be the last note today and expect only one note early tomorrow. I will be back on Thursday and am planning a market update webinar for Friday.
- Happy Holidays to you and your families.
S&P bullish sentiment
Sentiment has been falling off the recent extreme levels over 80%. It bounced on Friday to 63% bulls and breaking below 50% the midpoint majority line would increase the conviction for a move lower perhaps to the 200 day ~5500. Here’s a 3 year look. All of our charts can be changed with longer or shorter time frames on the site.

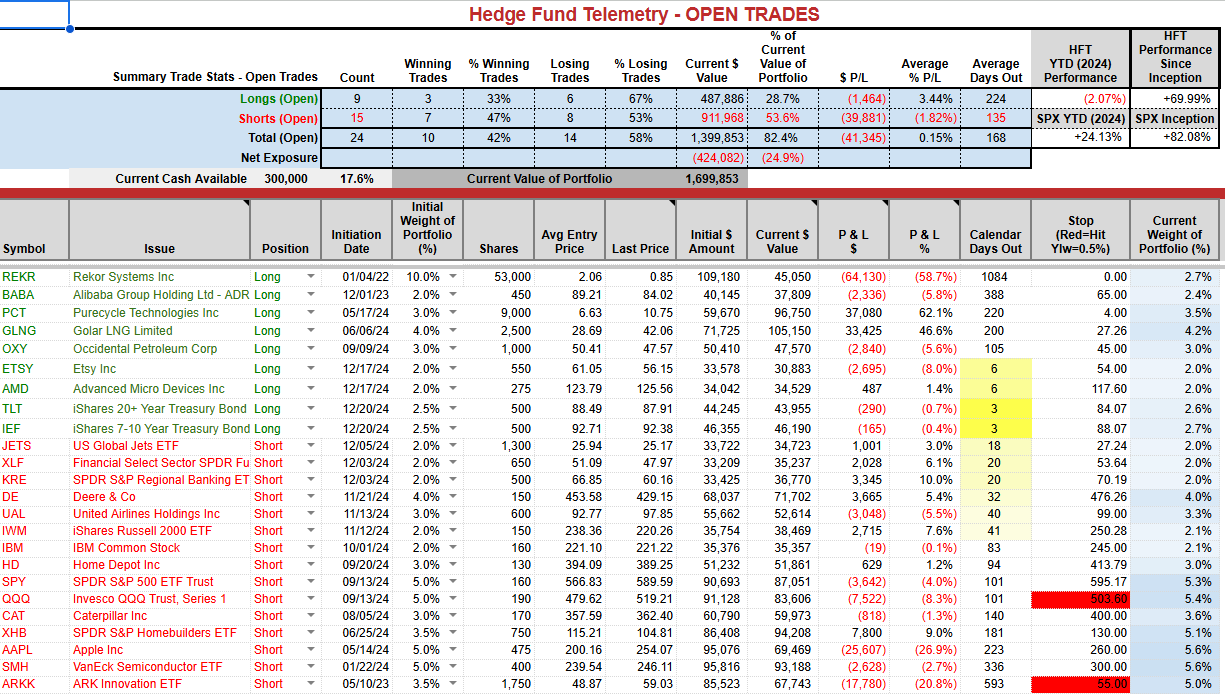
TRADE IDEAS
Mixed action with longs and shorts. It’s been a decent month for short ideas.
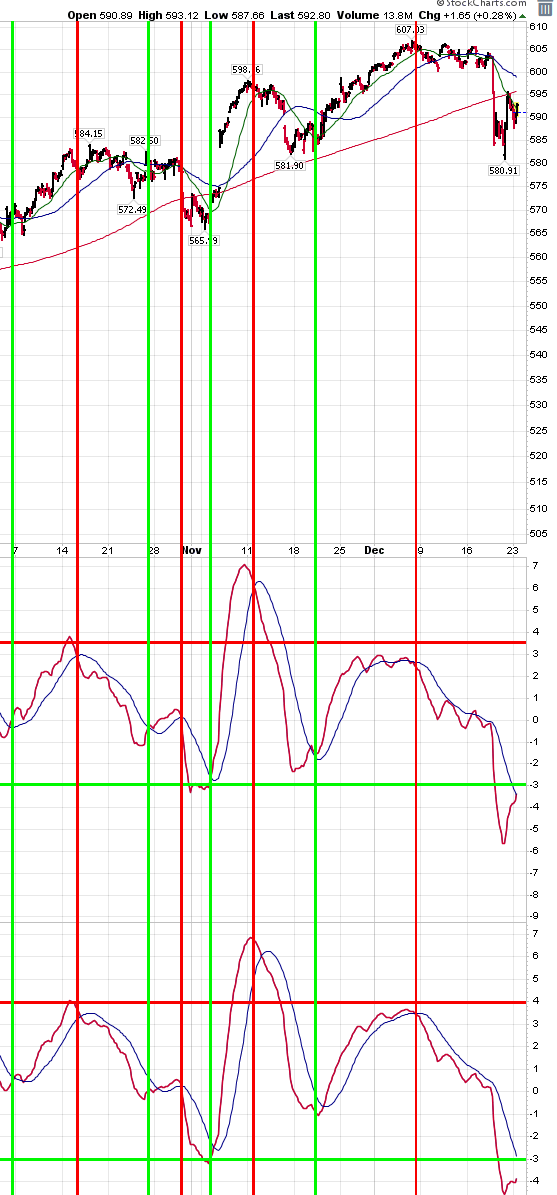
The new momentum indicator I am now using for all SPY and QQQ trades has been on sell signal. Both indicators have to confirm a turn. The shorter term one is near but has not given a buy signal. Momentum indicators can work with a lag so if this turns positive in the next few days we’ll go long for as long as it lasts. It does not pin point exact tops and bottoms but gets the meat of the moves. I’m not sharing the perimeters of the two indicators.
US MARKETS
Here is a primer on the DeMark Setup and Sequential indicators basics.
S&P daily holding the 50 day today. Risk below Friday’s low is the line in the sand for bulls.

S&P weekly has support at 5500 – roughly at the 200 day. Breaking below those levels should not be dismissed as my view in 2025 is to expect a move under 5000 at some point. I don’t do the end-of-the-year target thing like other strategists.

Nasdaq 100 daily still has potential with Sequential on day 8 of 13. A top in early 2025 with Sequential 13?

Nasdaq 100 weekly with Sequential sell Countdown 13. A pullback at least to the August yen carry trade unwind would not surprise in the first half of 2025

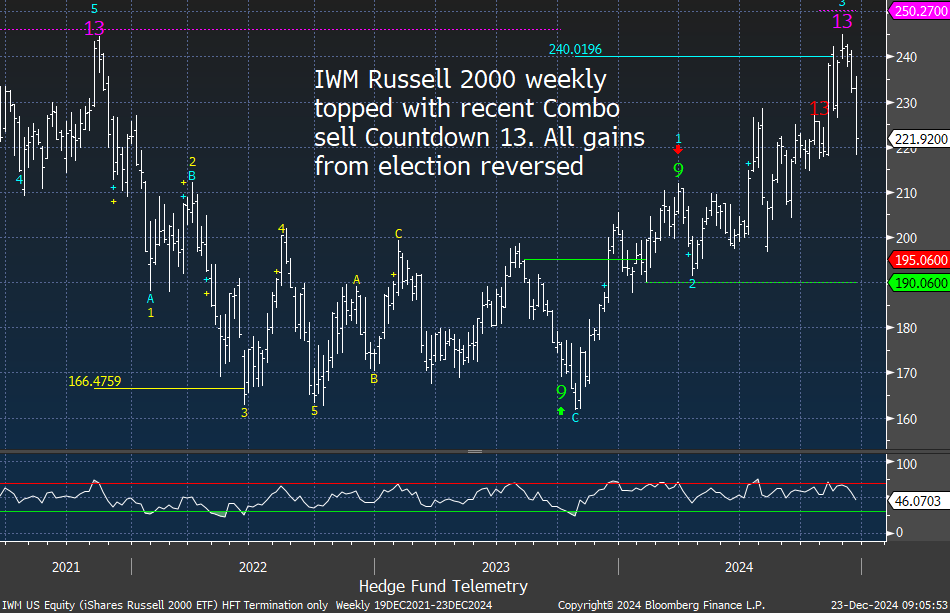
Russell 2000 daily and weekly look very weak giving back all the election gains.

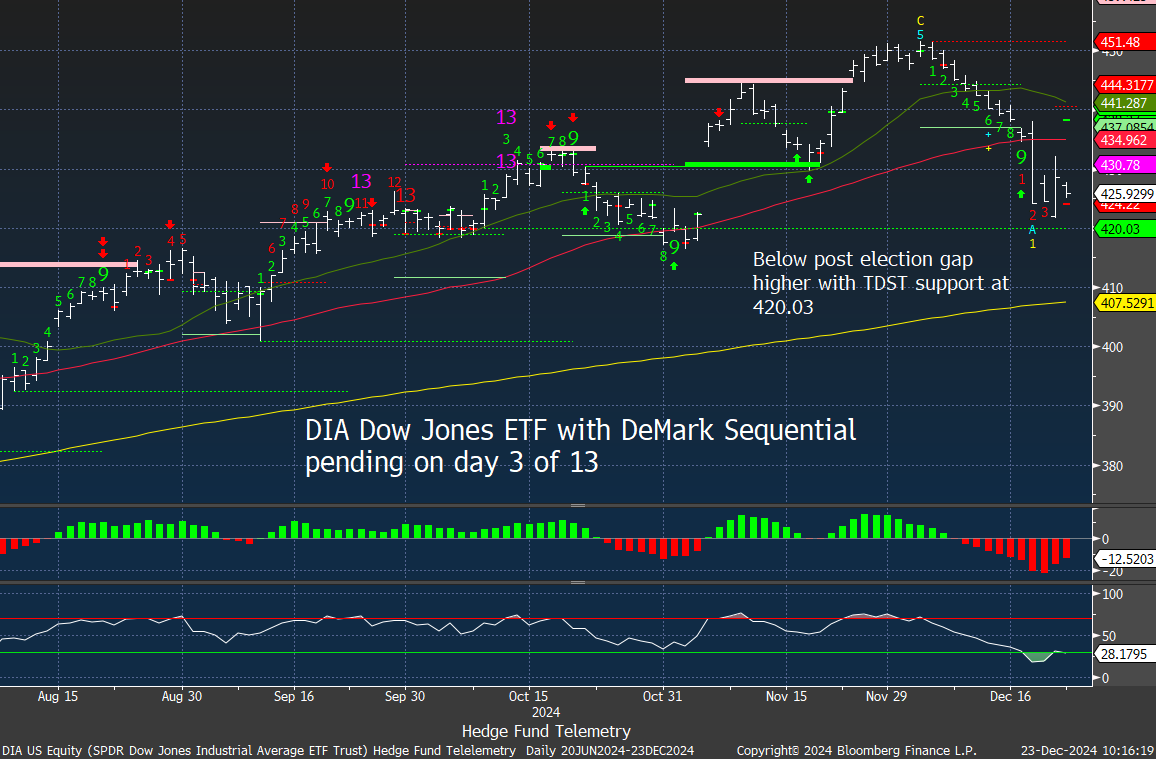
The Dow Jones Industrial Average has been very weak. The Sequential is pending on day 3 of 13. Breaking the TDST Setup Trend green dotted line at 420 is critical. I know Tom DeMark is likely watching this level too.
apple daily and weekly Demark 13’s
I like to see when several time frames sync together. Apple has both daily and weekly DeMark sell Countdown 13’s. The weekly is useful as the historical effectiveness of the 13’s worked well. Last week I added a long put spread trade idea to consider. Buy the 245-220 for $3.00 expiring Jan 31.


Tesla market cap insanity
I covered Tesla lower and have a put spread currently that may or may not work. This chart found on Zero Hedge shows Tesla’s market cap vs other automakers. The insanity is that Tesla is still an automaker despite the narrative change that they are an AI, Autonomous Driving/Robo Taxi, and robot maker. Revenues are 95% generated by auto sales, and some of these new hopeful initiatives do not work yet and do not generate income. Auto sales, by the way, are down YoY. Again, insane.


US SECTOR ETF FOCUS
I posted this yesterday on Week Ahead note and I wanted to reiterate showing this with all of the sectors below. Not all is that positive in this market with the Mag 7 masking the underlying carnage


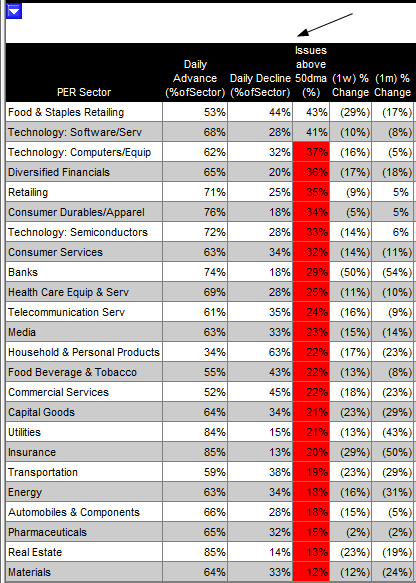
Geoff Garbacz from Erlanger Research sent me this of all the sectors with components above the 50 day moving average. This is really ugly action.
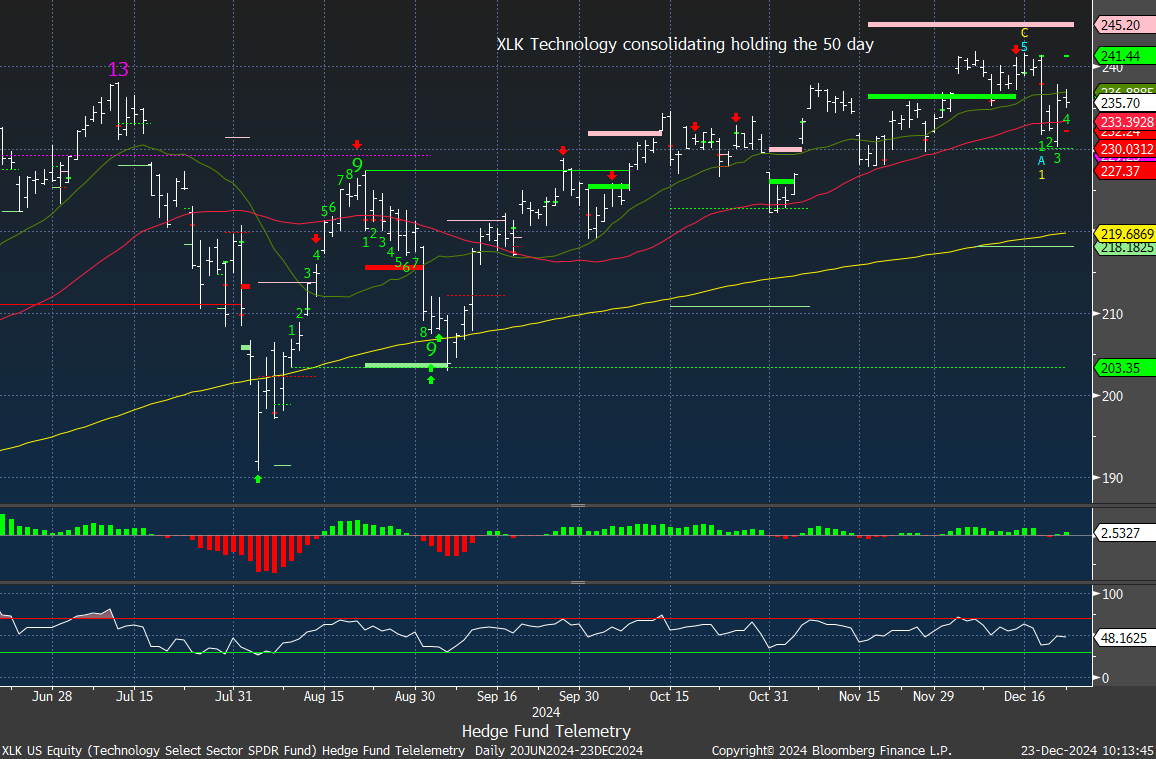
XLK Technology has been chopping sideways in the last few months with 230 support
Semiconductors SMH topped in July and has made lower highs with narrowing range with support at the 200 day yellow line at 240

XLY Consumer Discretionary has been among the strongest ETFs with Tesla and Amazon combined ~40% of the index. Breaking the 20 day with 50 day in sight.

XLI Industrials has given everything back from the election with the DeMark Sequential pending on day 6 of 13

XLF Financials and KRE Regional Banks have been shorts working well for us with risk remaining lower with DeMark Sequential Countdowns in progress. These have been crowded on the long side and are at or nearing the election levels.


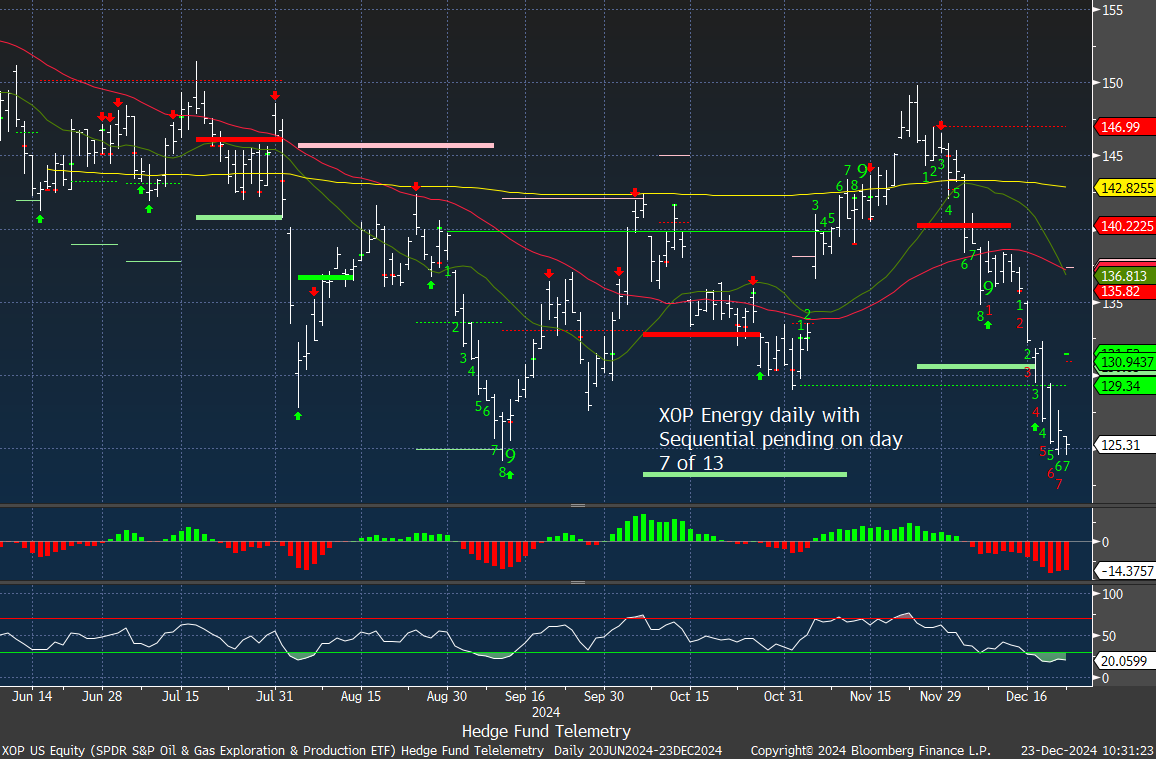
XLE, XOP, and OIH Energy ETF all trade terrible with about 20% of the components making new 52 week lows. It’s getting oversold and this is on my radar for long ideas in 2025. In Q1 this year we were overweight energy and it was the best performing US sector in Q1 beating tech and everything


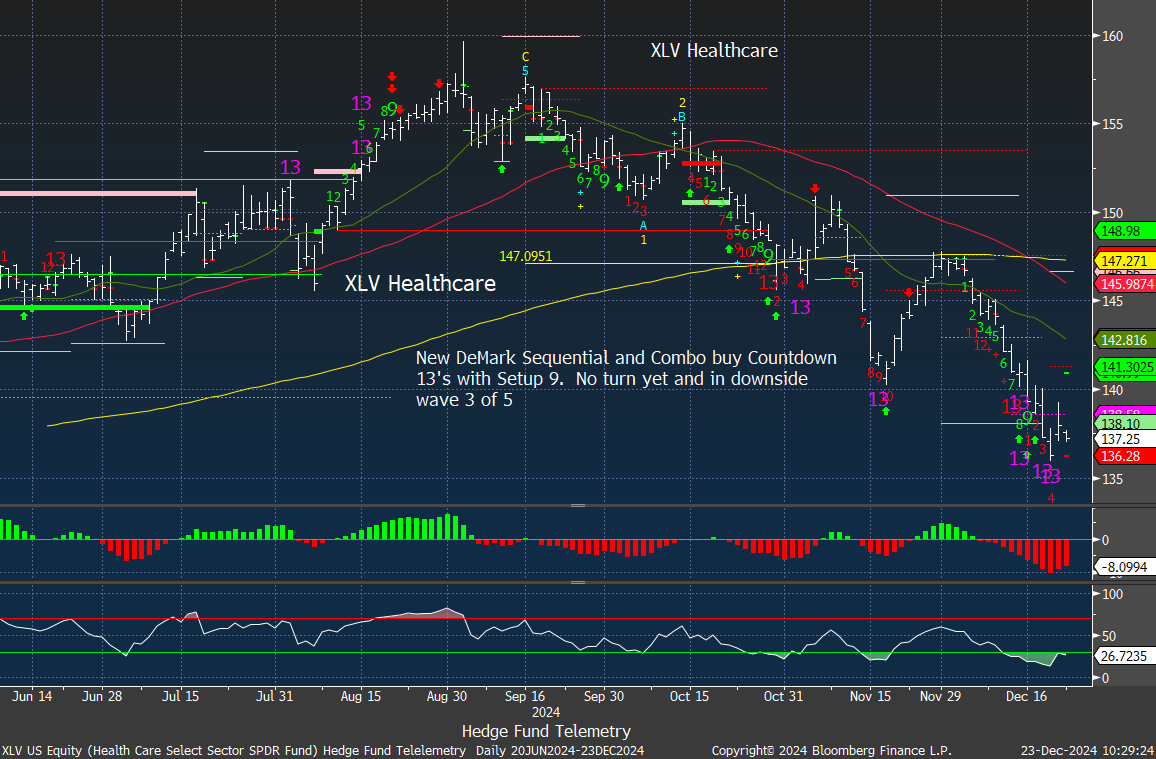
XLV Healthcare is very oversold and has new DeMark Combo 13. Wait for a turn.
XLP Consumer Staples now in downside wave 3 of 5 with DeMark Setup 9. Risk is continuation and a new Sequential beginning.

XLC Communications Services daily and weekly look toppy but I’d like to see the 50 day break


XLB Materials has collapsed with DeMark Sequential on day 5 of 13

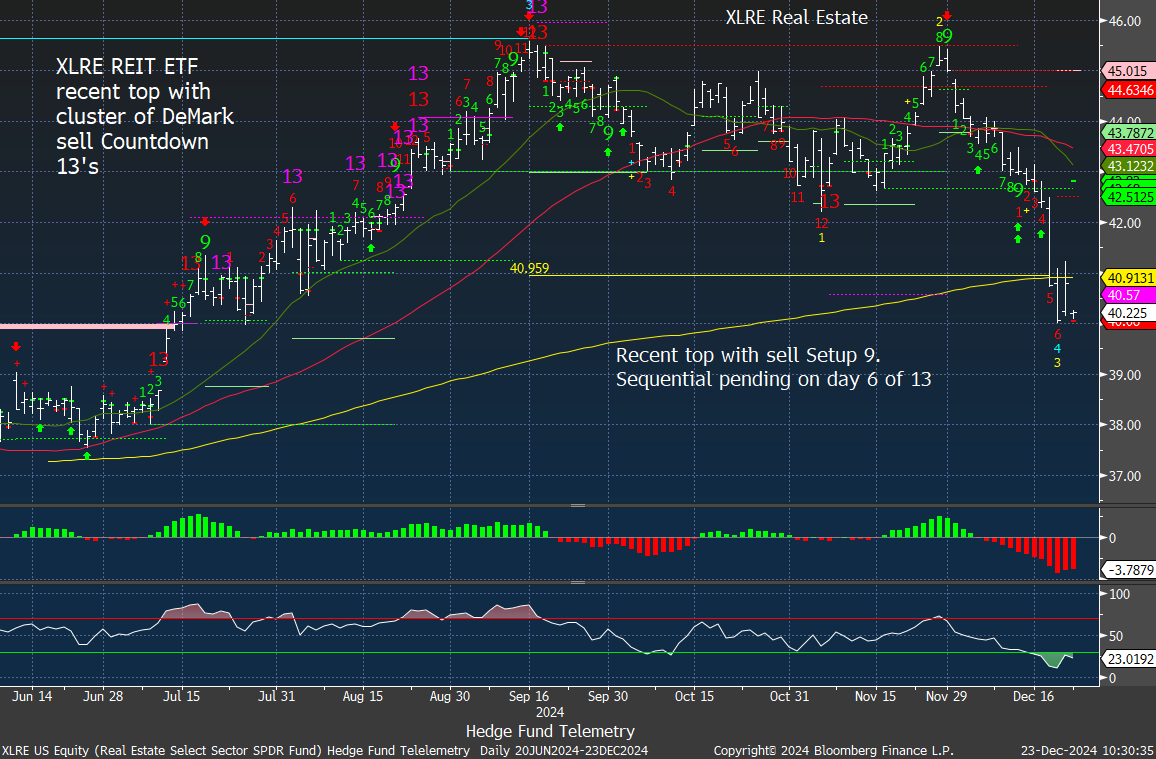
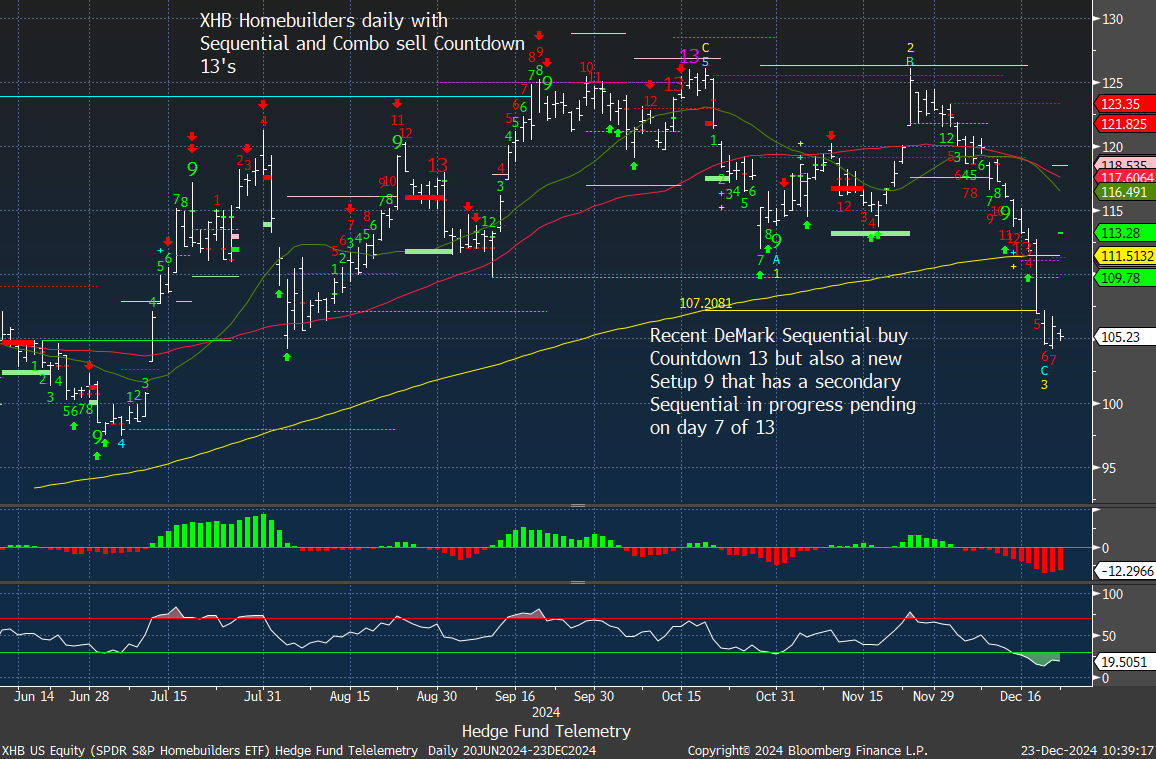
XLRE Real Estate and XHB Home builders both have broke the 200 day in yellow and have downside DeMark Sequential Countdown’s in progress and well below the election levels.
XLU Utilities made a multi month low with a Sequential in progress.

IYT Transports at the 200 day well below the election with a Sequential in progress.

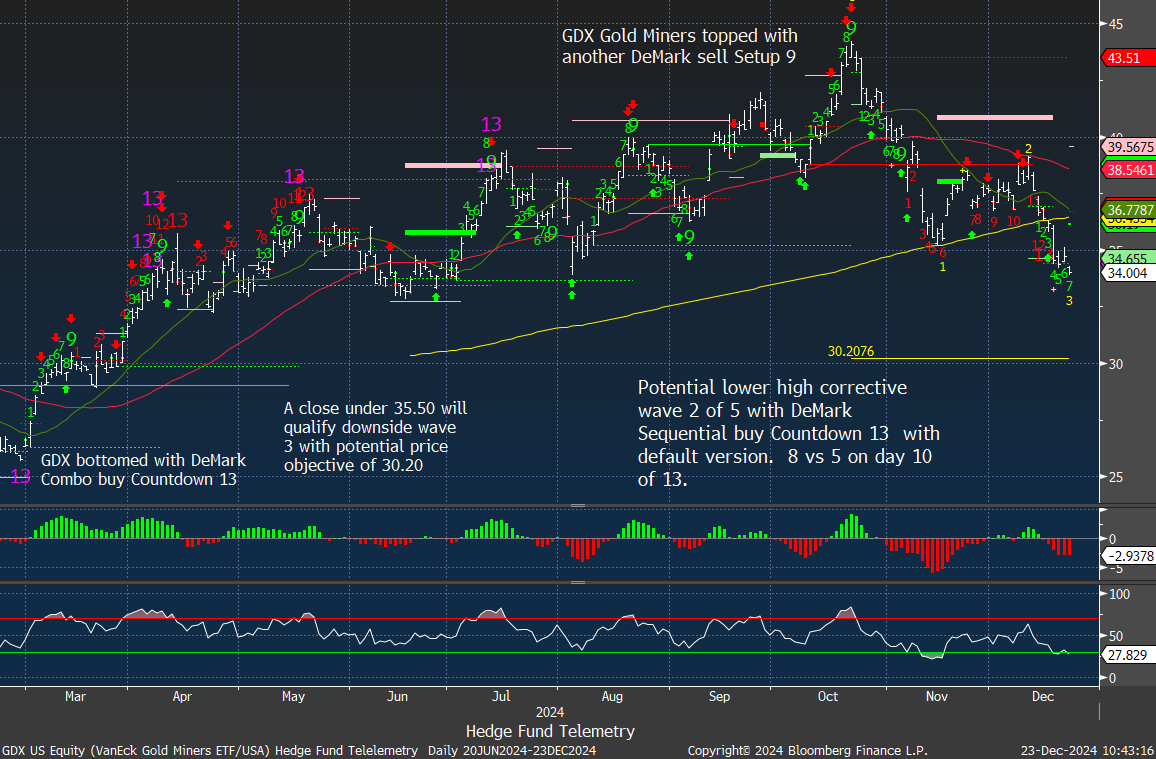
Gold Miners has a new Sequential 13 but I’d rather used the elective version of the Sequential which is on day 10 of 13. A move now into wave 3 of 5.
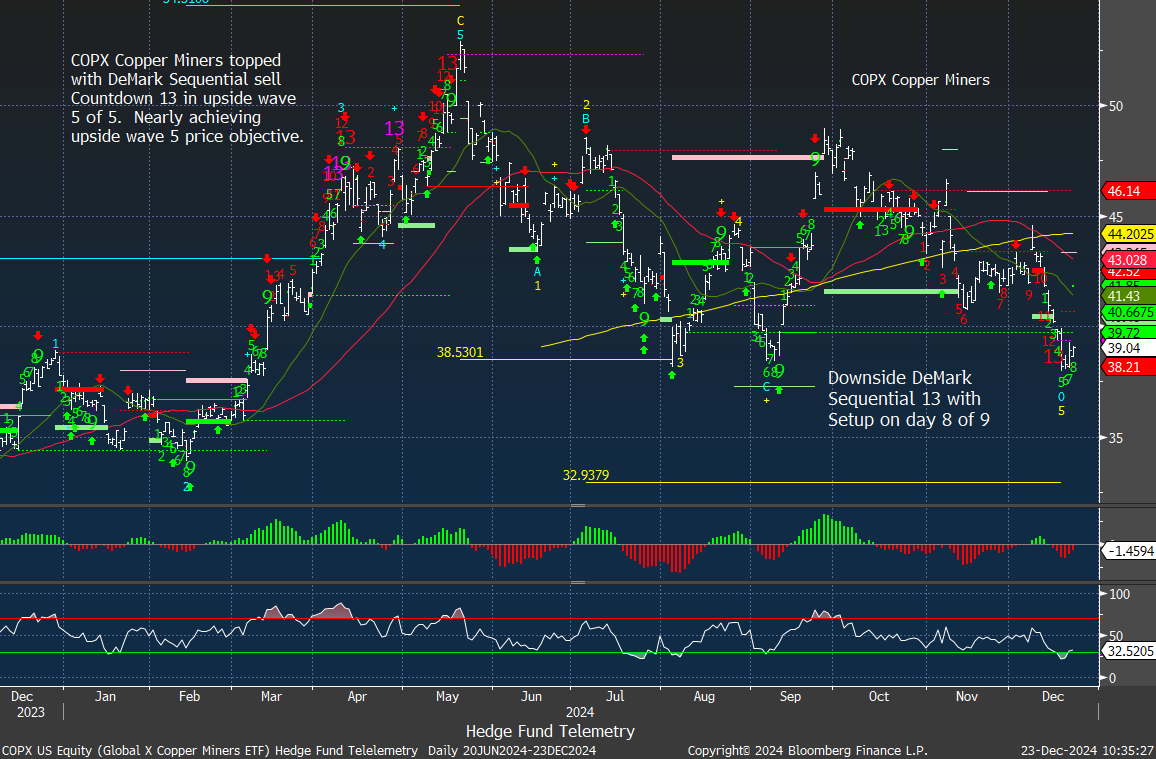
COPX Copper Miners has a new Sequential buy Countdown 13 as levels where it bounced before and this is on my radar as a long idea.
FXI Hong Kong China ETF did get a recent DeMark Sequential buy Countdown 13 but has not been able to turn higher

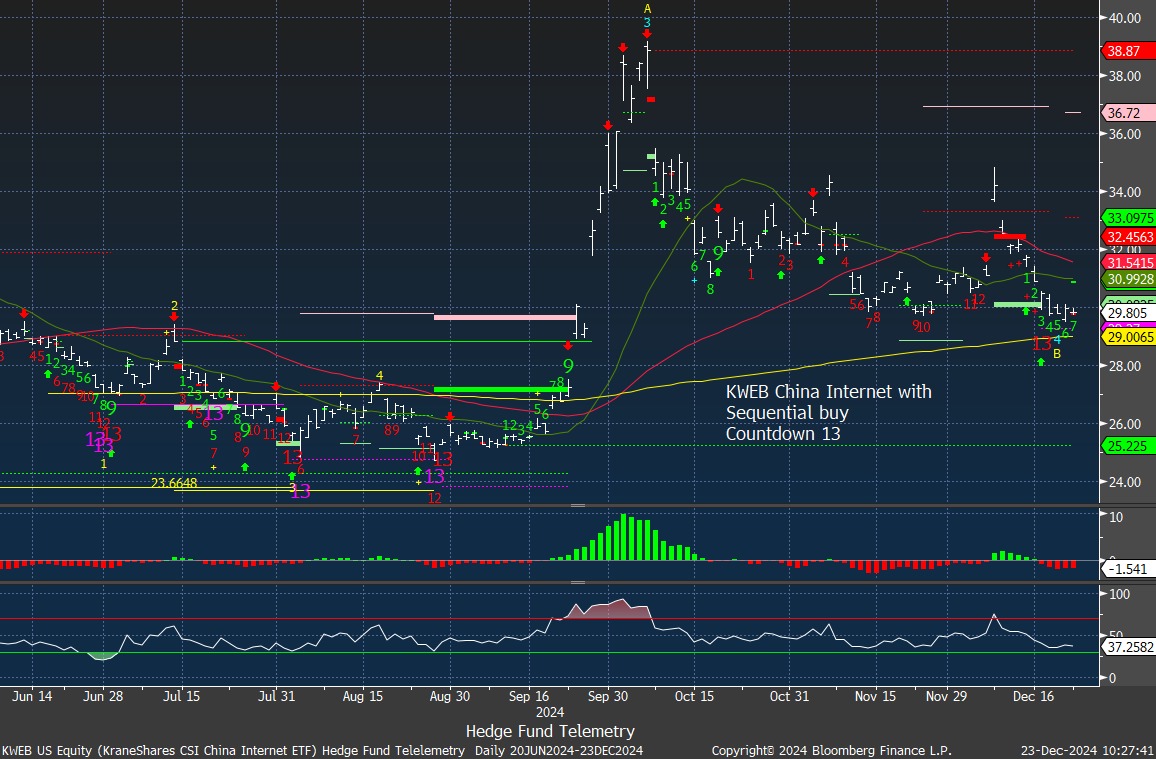
KWEB China Internet did get the Sequential 134 but lacks any momentum for now.
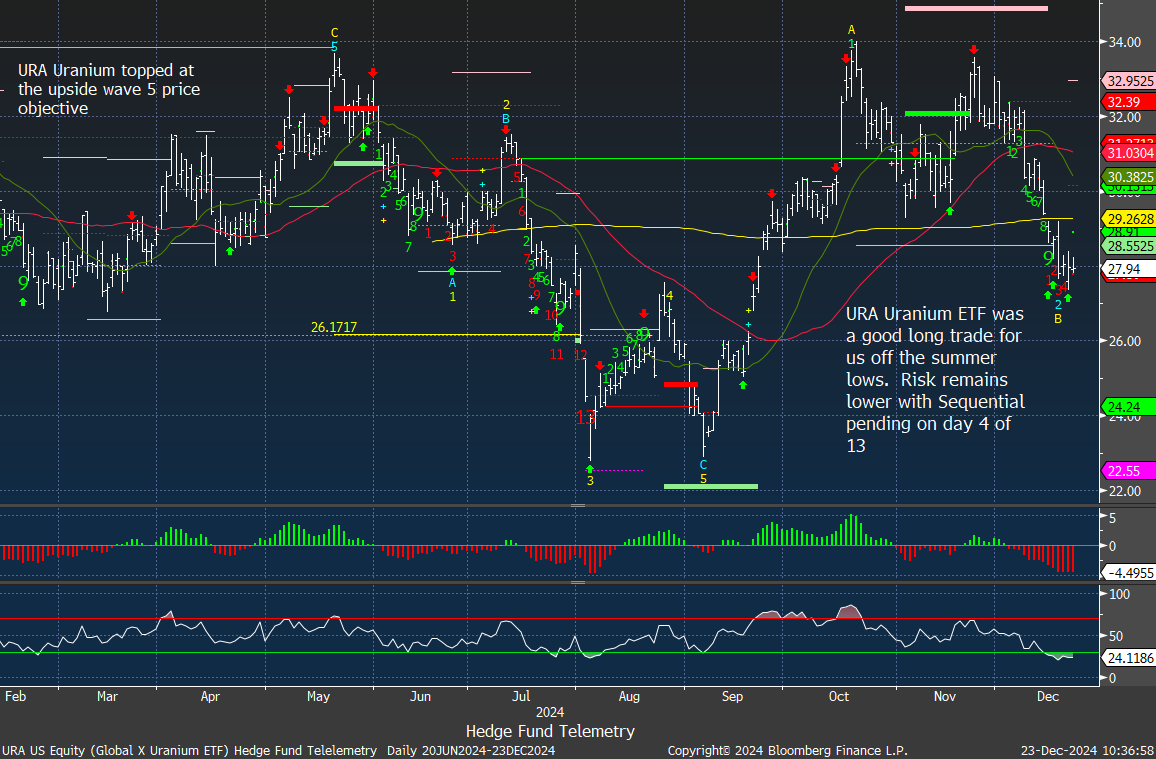
URA Uranium has risk lower with Sequential in progress. I want to buy this back soon
FACTORS, GOLDMAN SACHS SHORT BASKETS AND PPO MONITOR UPDATE
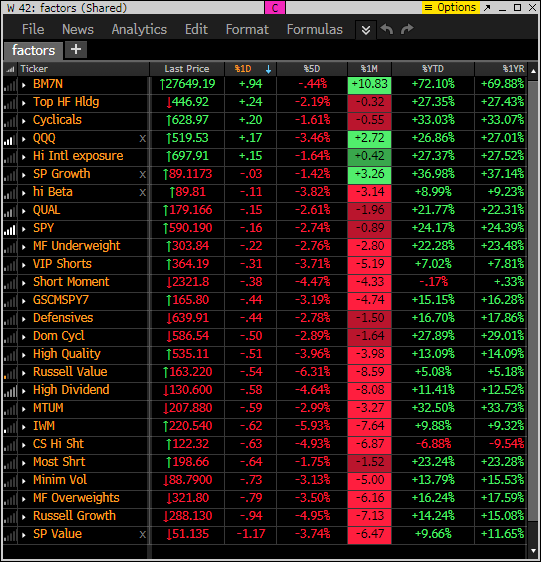
Factor monitor has the Mag 7 leading again lifting the indexes as breadth is negative again.
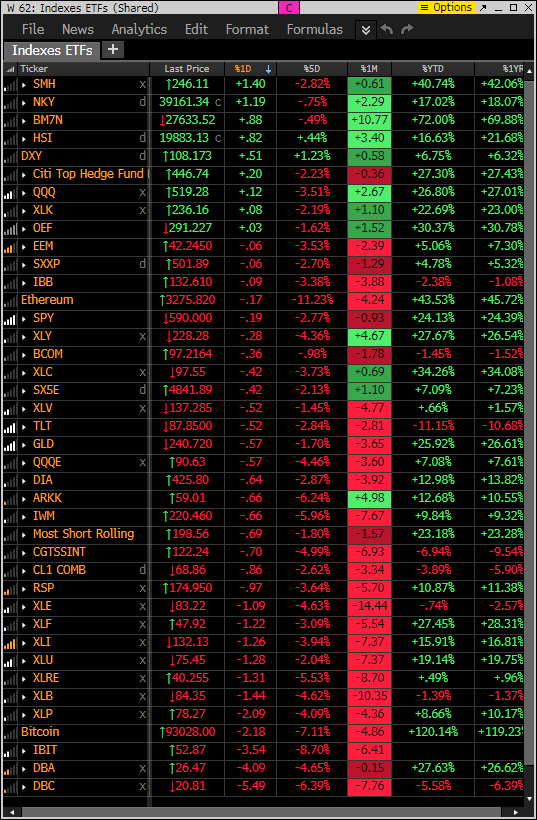
This is similar to the above monitor with various ETFs and other indexes. The 5 day rolling performance and 1 month rolling performance has been weak.
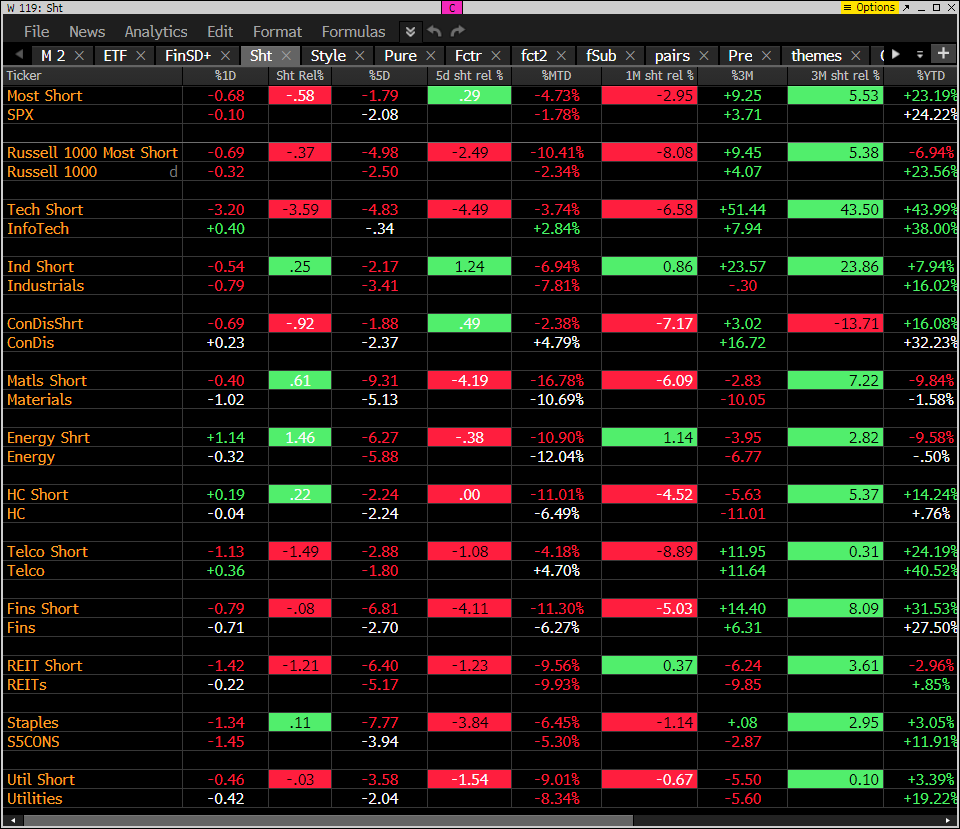
This monitor has the S&P indexes and the Goldman Sachs most shorted baskets. Today the short baskets are mostly lower ex energy with some squeezing.
The PPO monitor (percentage price oscillator) force ranks ETF’s by percentage above/below the 50 day moving average. For information on this monitor please refer to this primer. This monitor is offered to Hedge Fund Telemetry subscribers who are on Bloomberg. Notable: Nearly every sector is below the 10, 20, and 50 day moving average.

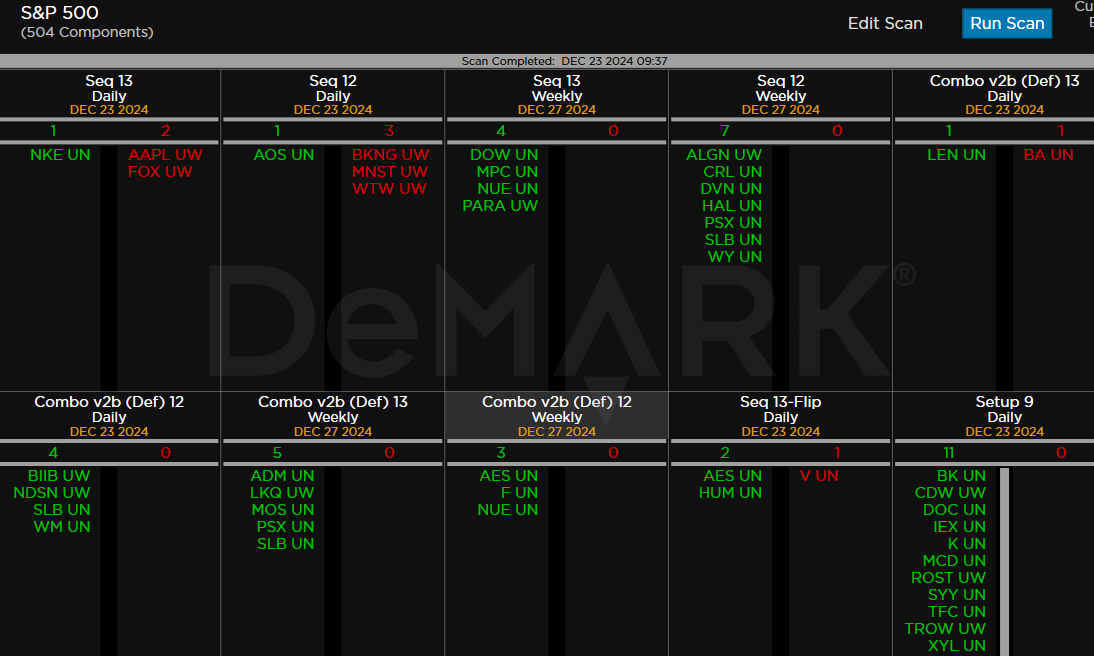
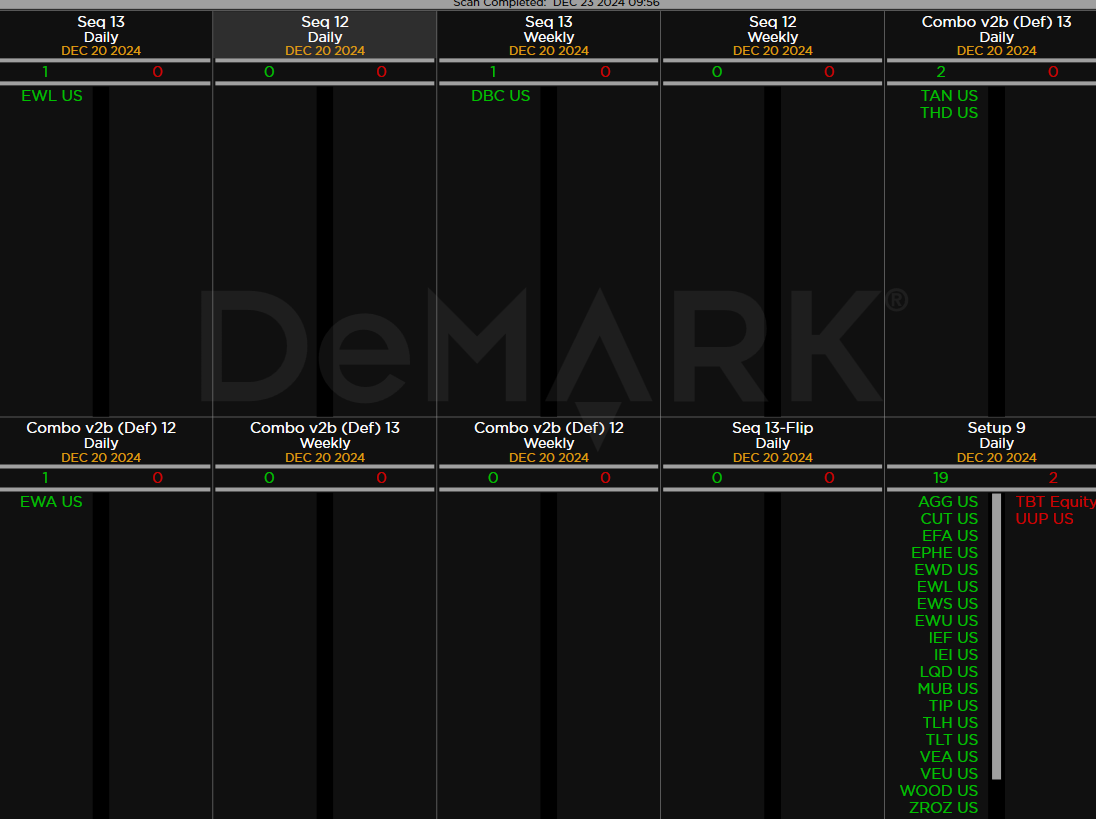
demark observations
DeMark screen for S&P and 165 major ETFs are seeing mixed action with a few buy signals starting to develop with some oversold sectors.