
Quick Market Views
I will post another earnings preview note out by 3:30 pm ET
Stocks: A flip flop from yesterday with tech and Mag 7 strength and that broadening that everyone was touting yesterday is seeing a fade. Breadth is down moderately with NYSE and Nasdaq both down ~700 issues. Morgan Stanley’s prime brokerage saw huge de-grossing with long short funds yesterday. They sold longs and covered shorts reducing total exposure. See below. Tech is leading up 3%, communications up 1.3%, and consumer discretionary is up 0.2%. The remainder of sectors are down on the day.
Bonds: Rates are steady all day up 1-3bps
Commodities: Mixed action with Natural gas down nearly 5%, Crude up 0.85%. Livestock and grains higher. Copper up 0.4%, Gold up 1.2%, Silver up 1.7%
Currencies: US Dollar Index is up 0.6%. Bitcoin is down 0.2%
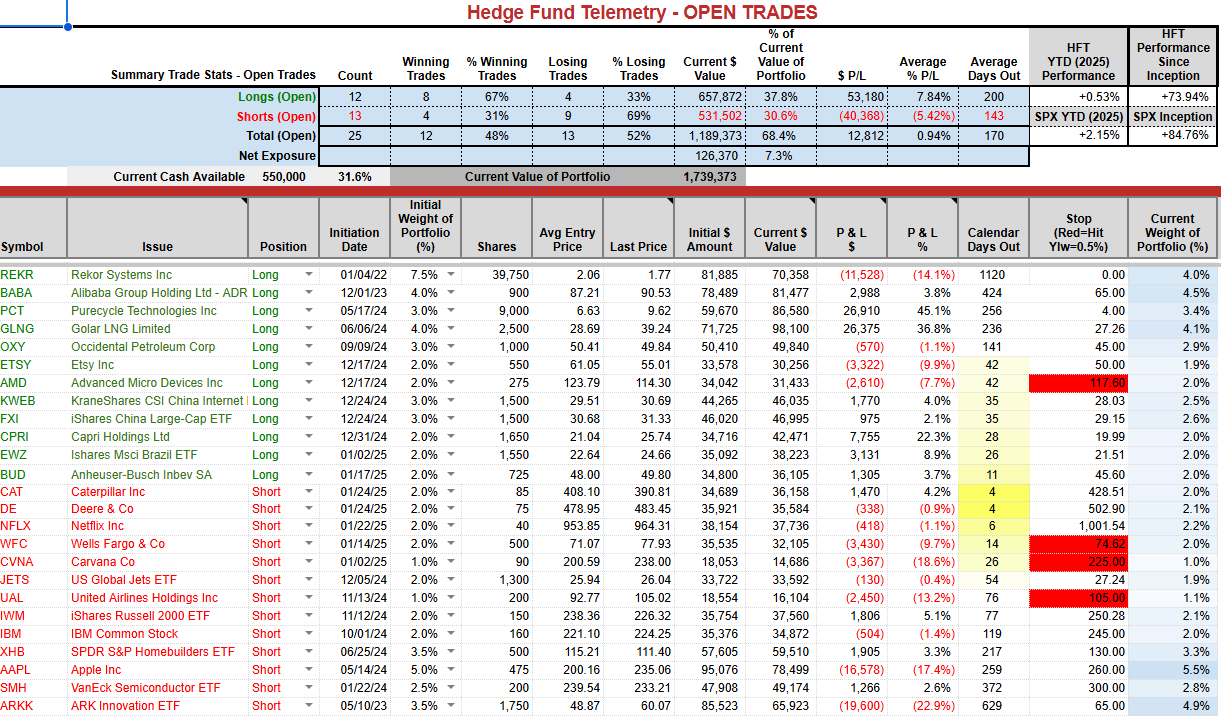
Trade Ideas Sheet: Continue to hold large cash allocation
Changes: I might have an idea on the late earnings preview note. I am adding a small marker size 1% long position with URA Uranium ETF. I plan on adding to this as I believe I might be early. I am recommending two option hedging ideas with SPY and QQQ expiring this Friday. Don’t get nuts with your size but considering all of the catalysts, these might work out. Buy the SPY Jan 31 600 puts for $2.35 and QQQ 515 Jan 31 puts for $2.75. These are not on the site and I will do my best to help manage these but if and when these get in the money be sure to reduce and lock in some gains.
Thoughts: Sometimes, it pays to be patient. This is one of those times. We can add exposure when we have some clarity after some of the big catalysts. I don’t want to whip us around in this market.
US INDEXES
Here is a primer on the DeMark Setup and Sequential indicators.
S&P futures 60-minute tactical time frame bounce continues but still believe this is a lower high wave 2 of 5 bounce.

S&P 500 Index daily shows the gap down and bounce. The volatile action in the last month has been tricky especially with the large and frequent 1%+ opening gaps.

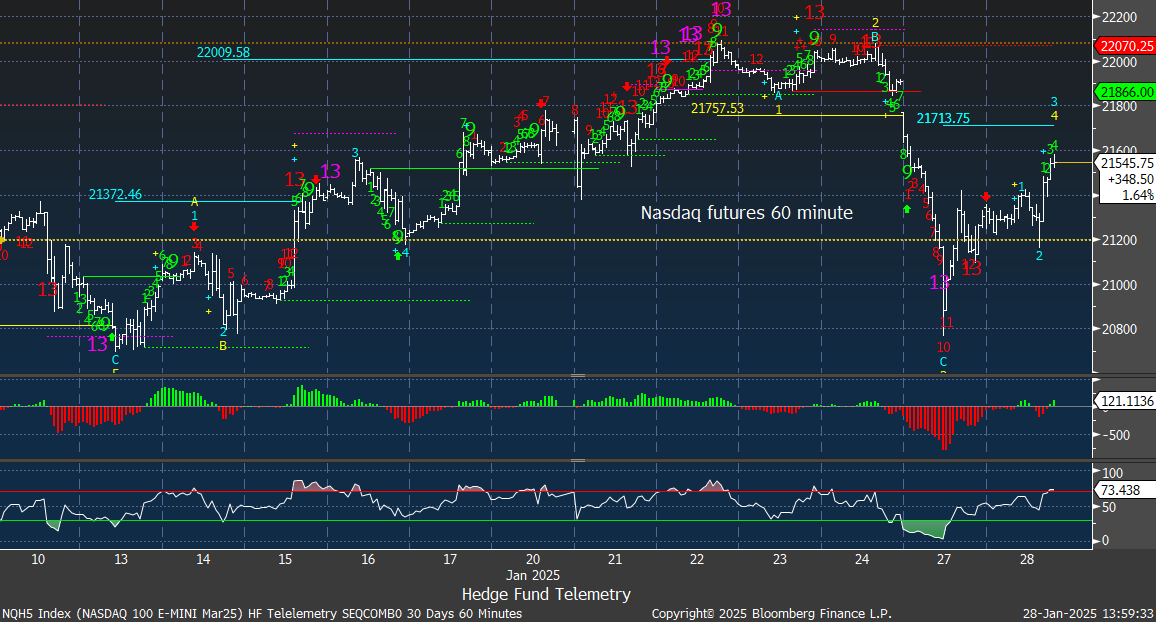
Nasdaq 100 futures 60-minute tactical time frame with some recent volatile action. Happy to have covered a bunch on the open yesterday.
Nasdaq 100 Index daily shows volatile action in the last month. Support at 20,000 is key

IWM Russell 2000 with lower high bounce starting to fade

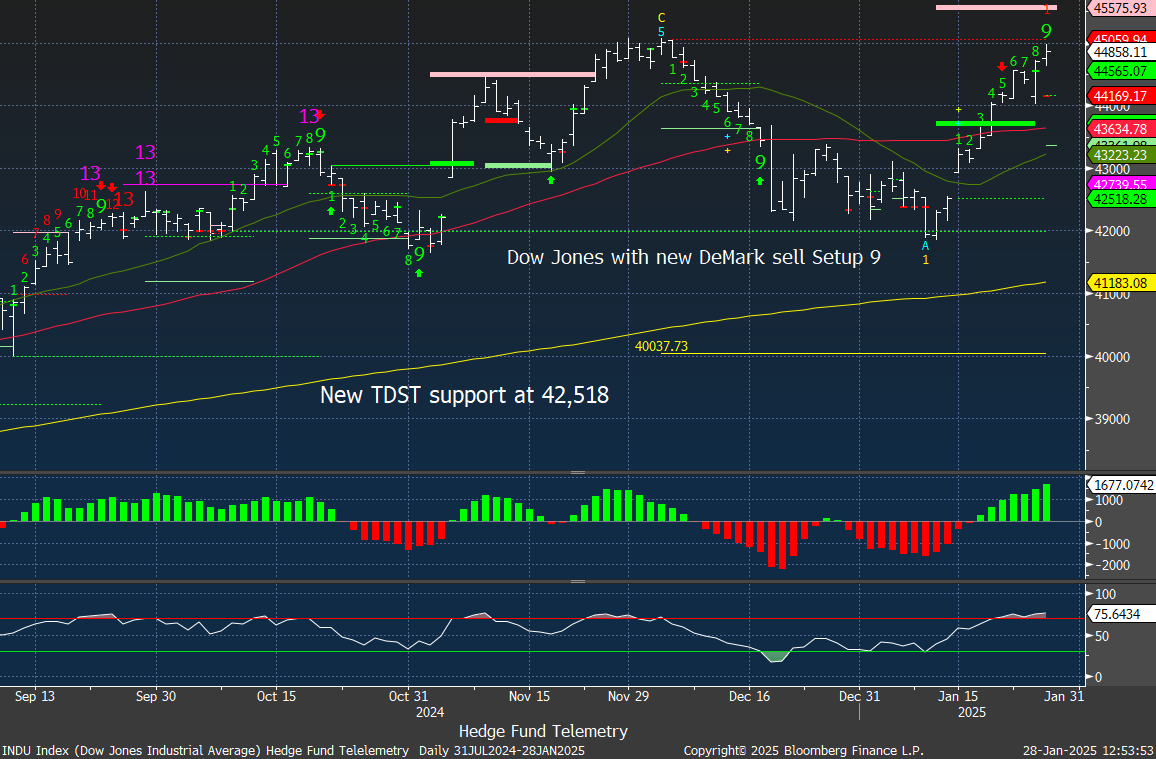
Dow Jones with new Setup 9. Will be worth watching if this caps this move. I’ll update in the coming days. RSI elevated.
Trade Ideas Sheet
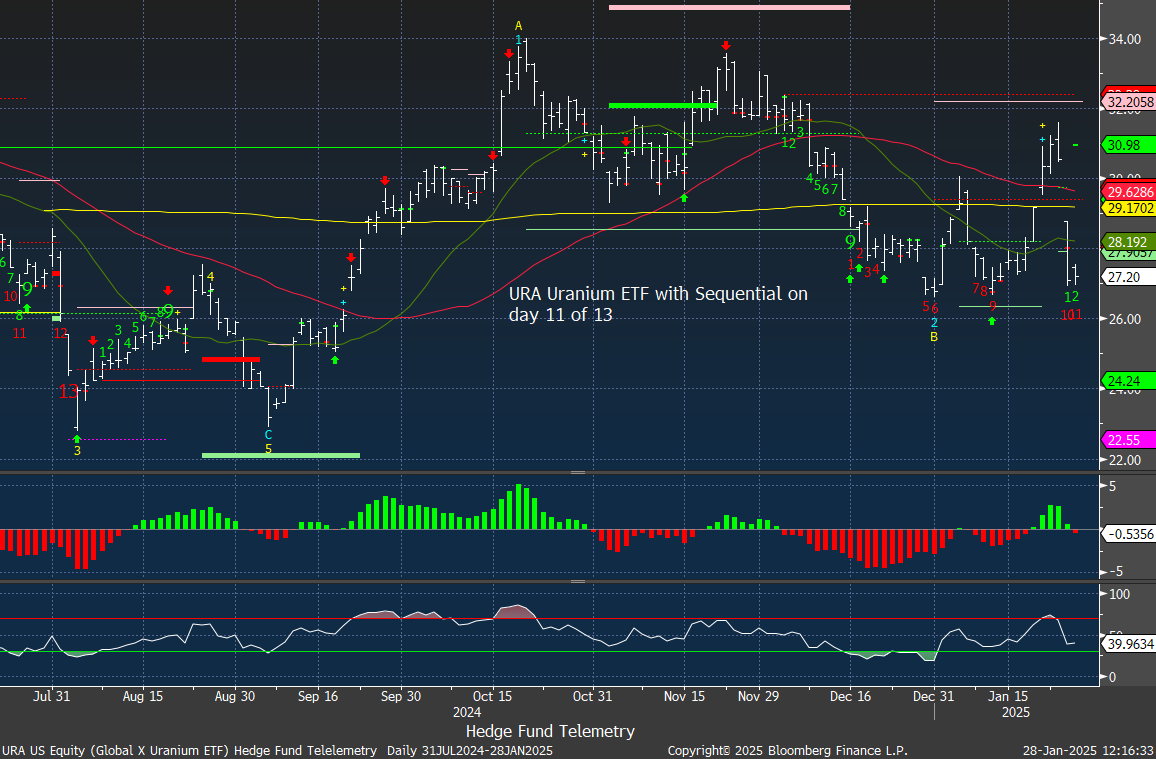
I’ve been watching URA Uranium ETF for a long entry. The bounce left a DeMark Sequential pending and now it’s on day 11 of 13. I am going to add a marker size 1% position today to get started. I plan on adding lower so if you want to hold off for the 13 that’s fine.
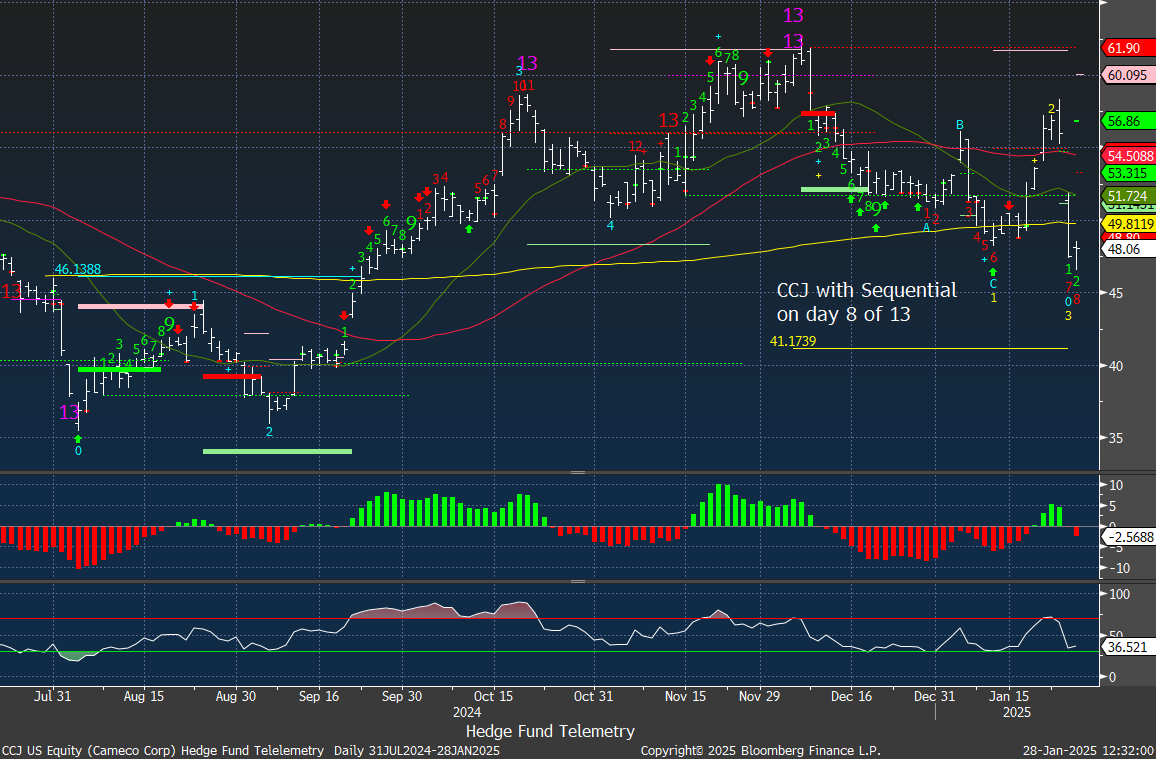
CCJ Cameco is the largest weight on day 8 of 13 with Sequential so some more downside is expected.
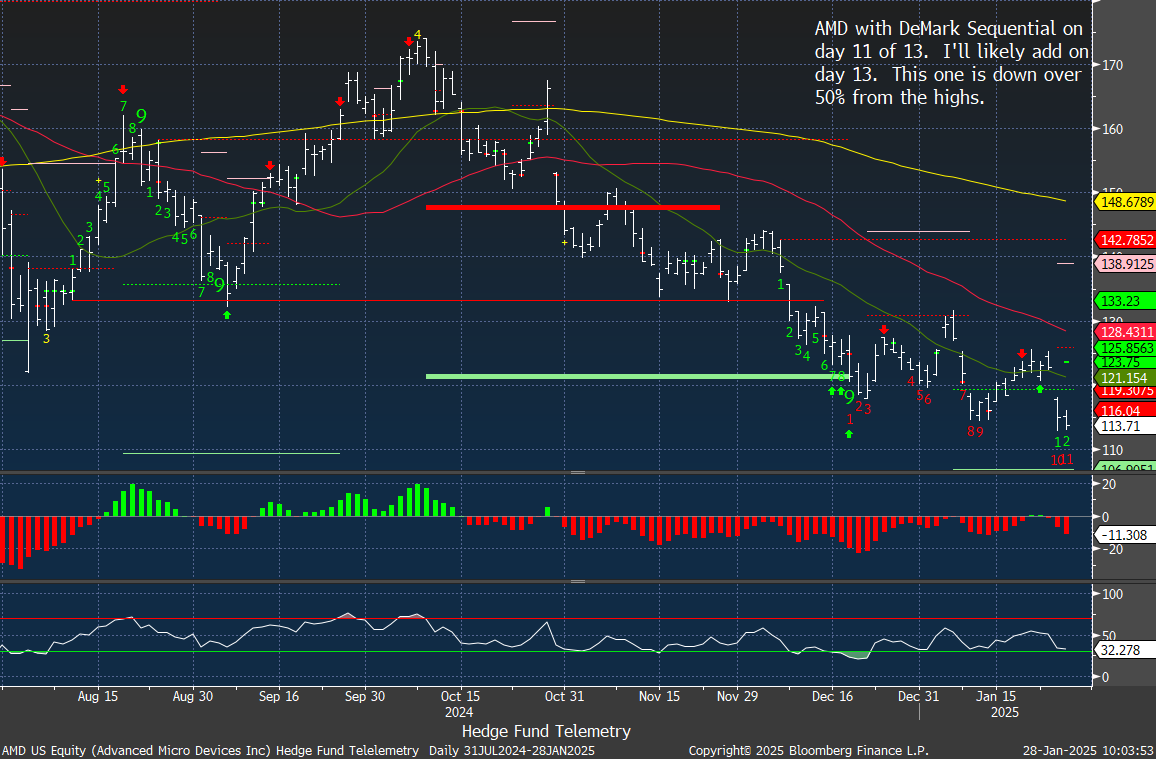
AMD is now on day 11 of 13 with the current Sequential Countdown. I will be adding on the 13 which might be a little lower.
BABA doesn’t report tomorrow as some sites have reported. Bloomberg has February 7th which is not confirmed by the company yet. The bounce is on day 8 of 9 with the Setup. I’d like to see this continue higher with a new Sequential but at this point we have to wait to see if this happens.

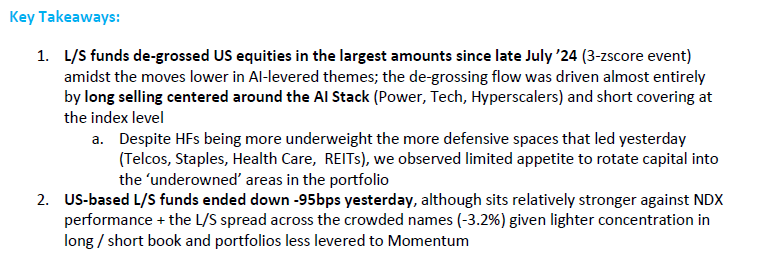
Morgan Stanley long short account action
Long short funds de-grossed in one of the largest amounts since July. Gross exposure is the combined long and short sides of their book. So they sold longs and covered shorts. This could be why Apple increased as shorts could have covered while selling other tech long exposure like Nvidia.
Hedge Fund Telemetry ETF Percentage Price Oscillator Monitor
The PPO monitor (percentage price oscillator) force ranks ETFs by percentage above/below the 50-day moving average. For information on this monitor, please refer to this primer. This monitor and others are offered to Hedge Fund Telemetry subscribers on Bloomberg. The opposite of yesterday with tech leading and that broad strength from yesterday reversing.

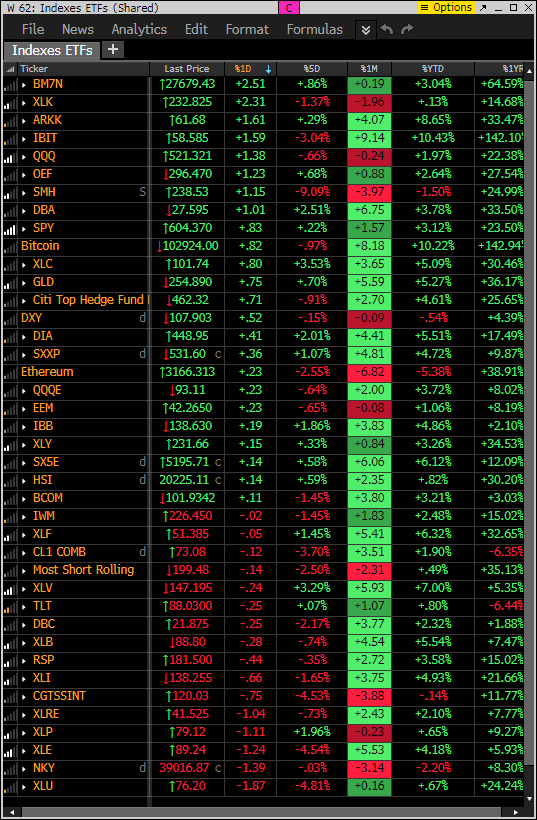
Index ETF and select factor performance
ETF with today’s 5-day, 1-month, YTD and 1-year rolling performance. Tech strong today – the opposite of yesterday.
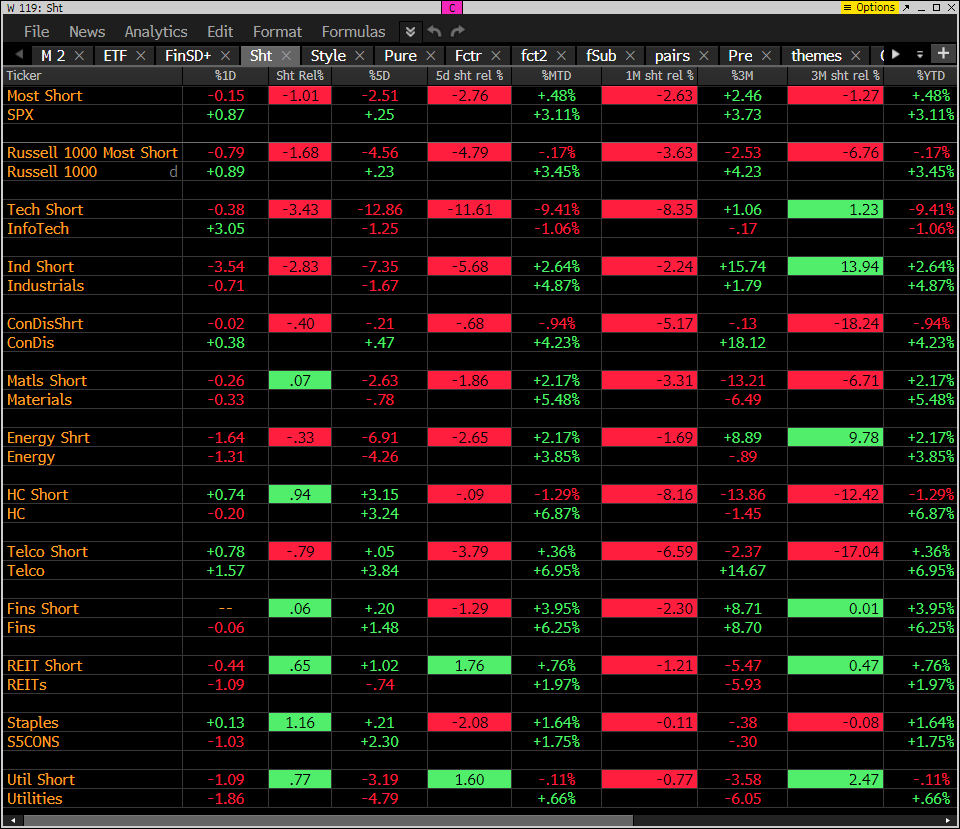
Goldman Sachs Most Shorted baskets vs. S&P Indexes
This monitor has the S&P indexes and the Goldman Sachs most shorted baskets. Short baskets were down hard yesterday, and most are lower again today. The tech sector is up which isn’t a short squeeze but more long only buying mega cap.
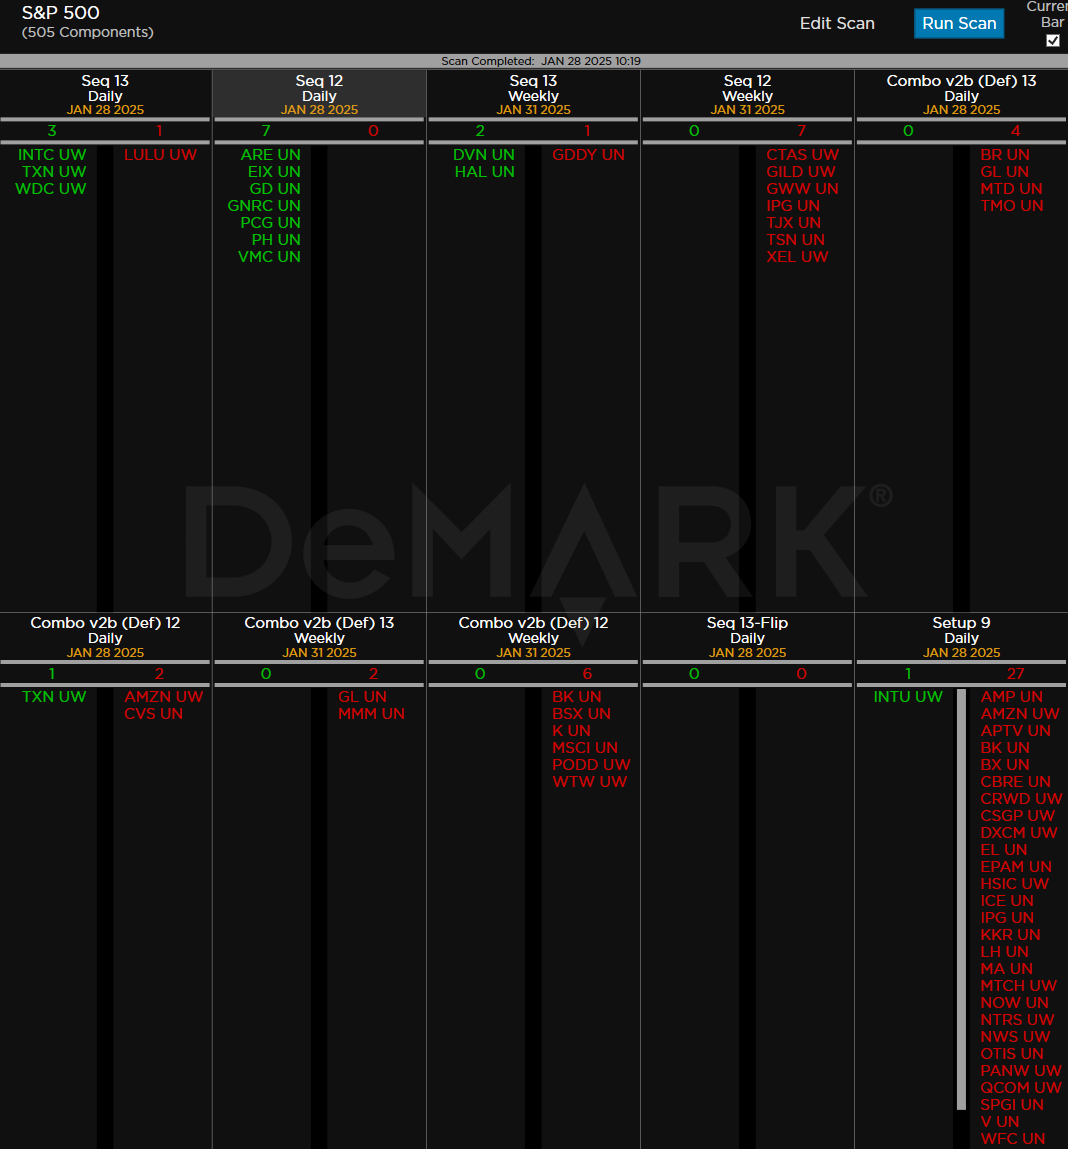
DeMark Observations
Within the S&P 500, the DeMark Sequential and Combo Countdown 13s and 12/13s on daily and weekly periods. Green = buy Setups/Countdowns, Red = sell Setups/Countdowns. Price flips are helpful to see reversals up (green) and down (red) for idea generation. The extra letters at the end of the symbols are just a Bloomberg thing. Worth noting: Starting to see some buy Countdown 13’s developing. There are many sell Setup 9’s that have seen recent bounces that could stall out here.
Major ETFs among a 160+ ETF universe. Quite a few sell Setup 9’s here too.

If you have any questions or comments, please email us. Data sources: Bloomberg, DeMark Analytics, Goldman Sachs, Street Account, Vital Knowledge, Daily Sentiment Index, and Erlanger Research