

Quick Market Views
Stocks: Another weak day and perhaps it’s because the markets are following the pattern of weak Friday-Monday with mid week strength. Some level broke including Friday’s lows giving the buy the dip people from Friday some anxiety. Breadth is mixed with NYSE up 225 issues and Nasdaq with 750 down issues. Indexes as of this going to print are trying to bounce. I have some earnings previews below for today and tomorrow and charts of NVDA, AFRM, AAPL, ARKK, TSLA and BABA. Knowing Steve Cohen a bit, he doesn’t usually publically say much about the economy and markets, so his comments about the economy going to slow and a correction is probable seem important to consider. I think Steve is in the top 3 of all time greats. His Mets are still going to lose to my Dodgers!
Bonds: Rates were higher earlier and reversed down as equities slipped. 2’s are down 1bps, 10’s and 30’s down 2bps.
Commodities: Bloomberg Commodity Index is down 1% with Natural Gas down 7% (thanks to warmer weather). Crude is up 0.5%. Grains are lower. Softs/Ag are lower with Cocoa leading on the downside -7%, Coffee down 2% and Surage down 1.2%. This is helping our DBA ETF short
Currencies: A little quiet with US Dollar index unchanged. Yen weakness is small with 149.00 support with USDJPY. Crypto is down with Bitcoin down nearly 2%, Ethereum down 5%, Solana down 9%. Doge coin down 7% – now down more than 50% off highs. I haven’t even looked at Fartcoin or the Trump family of coins.
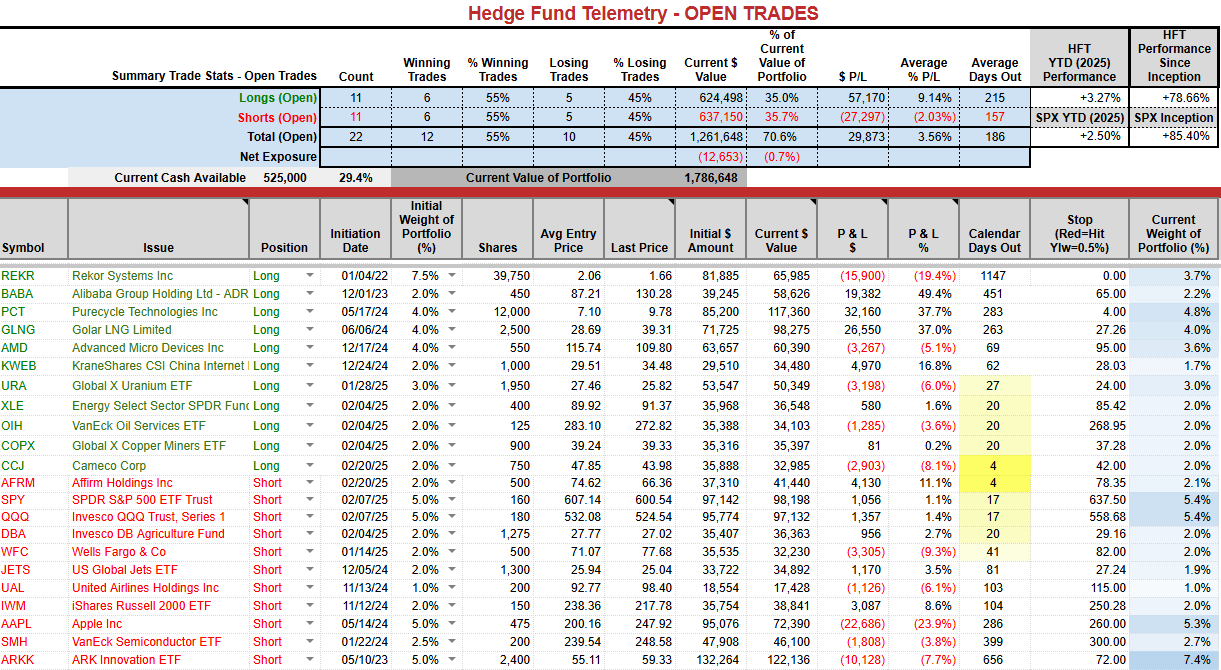
Trade Ideas Sheet: Still holding large cash position in this choppy environment. PNL doing fine despite the volatility.
Changes: HD Home Depot reports tomorrow, and I’m going to add a small baby-sized 1% weighted short because I think it could break support. My small size is explained below. If wrong, it won’t be much more than a paper cut. I’m working on a few new put spread ideas – NVDA, AAPL and if you’re in the recent SPY and QQQ put spreads, these are in the money small but I will hold a little longer. I am going to work with my programmers to see if we can start to list the open options ideas on the site.
Thoughts: Some of our longs have given back with the market action. We did recuce some long and short exposure recently. GLNG reports on Thursday and earnings are not relevant as much as the comments on the pending contracts for two more vessels. If you don’t own it, under 40 is decent level to buy ~2% weight. Uranium kinda sucks but I like the sector. AFRM has been a good new short idea. AAPL thoughts below.
This will be the last note today as I’m on Grant Williams podcast later.
Shark art and baseball art
Steve is not only one of the greatest investors; he’s a great collector of art. This Damien Hurst shark was purchased for $8 million years ago and now it’s probably worth $150 million. I always thought this was a provocative fitting piece of art for a hedge fund manager.

Steve’s latest piece of art he aquired is Juan Soto, who will make about $50 million a year for the next 15 years. Juan is amazing and started off his Mets career strong in pre-season with a home run at his first at-bat. Steve, I assume, is pleased.

US INDEXES
Here is a primer on the DeMark Setup and Sequential indicators.
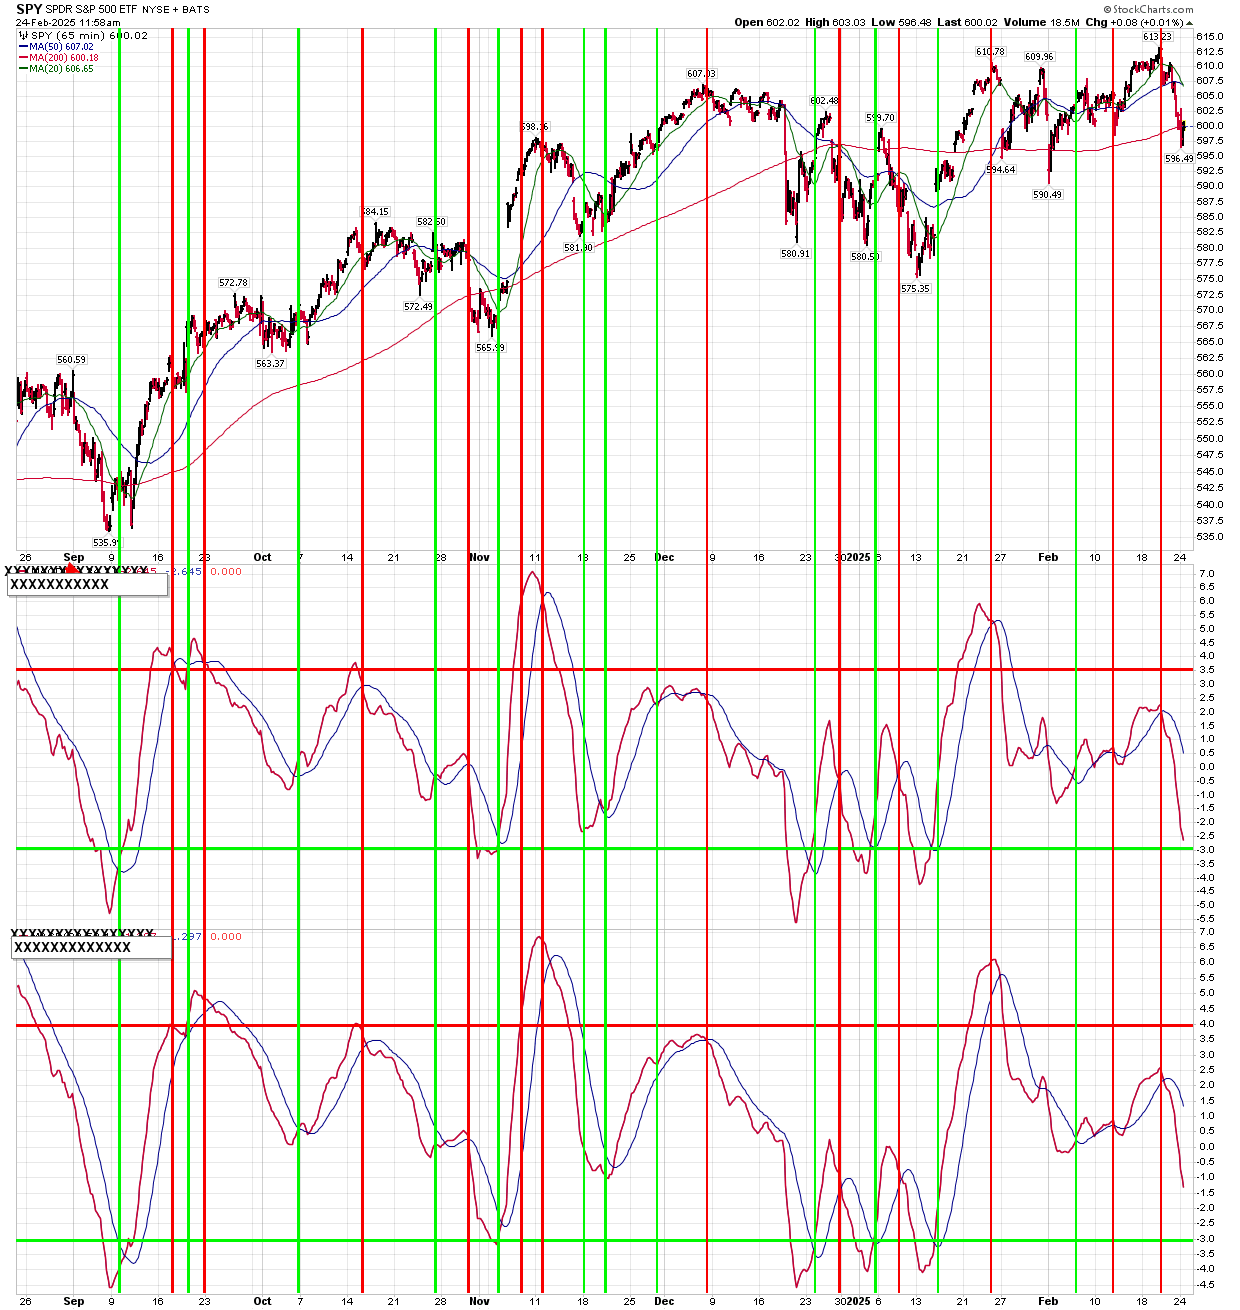
S&P futures 60-minute tactical time frame broke lower this morning. Support at the TDST Setup Trend at 6063 turned solid red from green dotted line which is a qualified downside break. The last solid red line TDST was in late January and things moved lower. There was an upside solid green from red dotted line upside break in early February. I highlight these as you should always be alert from these signals.

S&P 500 Index daily is trying to hold the 50 day with the TDST Setup Trend important support remaining at 5887. Below that and sellers could get motivated.

Nasdaq 100 futures 60-minute tactical time frame slipping lower with downside Sequential on hour bar 4 of 13.

Nasdaq 100 Index daily trying to hold the 50 day. 21,000 is support seen twice before.

IWM Russell 2000 did qualify the downside Sequential buy Countdown 13 that we have been anticipating. I’m going to hold my short despite the 13.

Dow Jones Industrial Average is right at support. Two levels to watch: TDST 42,518 and 42,000 near the 200 day and January lows. Breaking that level will qualify downside wave 3 with a potential price objective of 40,037. Expect a CNBC “Market’s in Turmoil” special if that level breaks.

Trade Ideas Sheet
The new short term momentum indicator for SPY and QQQ remains on a sell signal.
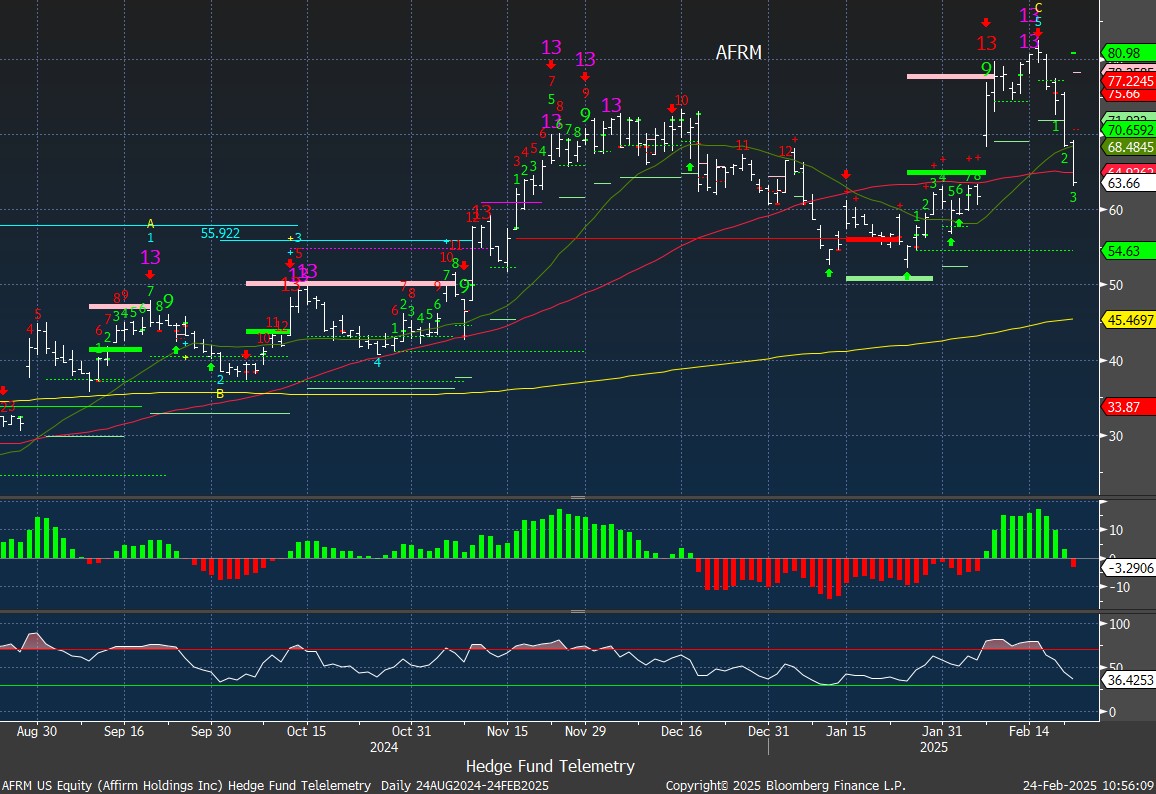
AFRM – Affirm is a recent short working well for us now down 14%. It filled the gap after earnings trapping the buyers. I think this can move into the 50’s or lower.
AAPL defies gravity as business isn’t great and the new cheaper iPhone isn’t cheaper. The valuation is very high hitorically. This sell Setup 9 might be a top here today.

NVDA reports on Wednesday afternoon and is down today on the news MSFT might be canceling some data center leases. We should expect the CEO to not back down from his always bullishness but guidance has to be up in a similar % gain as previous quarters. Furthermore, there have been stories of the new Blackwell chip having delays. I’m looking at a March 7th expiration 120-110 put spread priced at $1.50 for this one and I’ll let you know if I do it tomorrow or Wednesday.

ARKK we added to this short at the highs with the Combo 13’s. This is a defacto short with TSLA, PLTR, and COIN as large weights. This ETF has now had consistent monthly outflows for 14 months straight.

TSLA is trying to hold the recent lows. If this bounces I will likely add it back. The last short we made 7.5% which was less than expected but with this one we need to “stick and jab” Elon Musk has done a textbook study on how to damage one’s brand and I expect Q1 delivery numbers to be horrible.

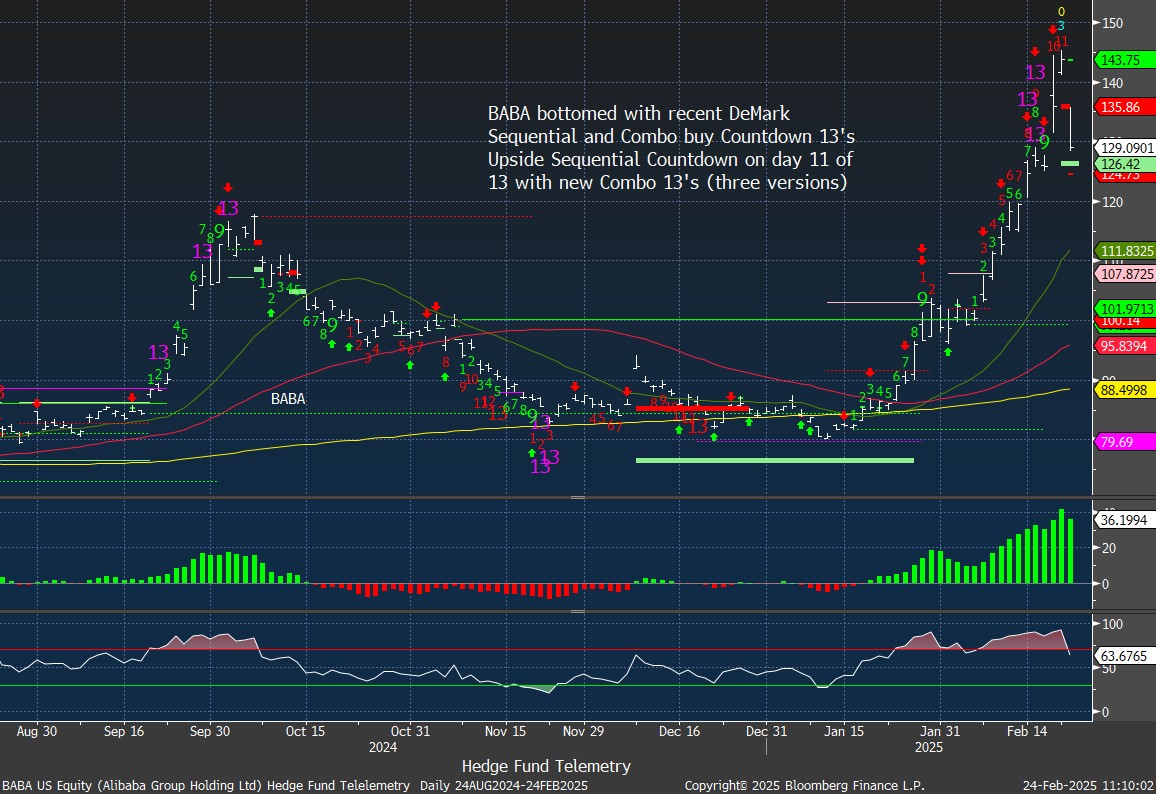
BABA is down 10% and I have stated my plan is to hold this one with now a 50% gain. It’s a 2% weight and I would like to add to this one perhaps around 120. If you want to take gains, I won’t stop you. It’s been a home run for us.
Earnings Previews
HIMS Hims and Hers sells ED meds and GLP weight loss drugs. The stock has gone parabolic recently, and the company backed off with a new Combo 13. I don’t want to even come close to this one. As the old saying goes, “If it’s obvious, it’s obviously wrong.” The implied move is 24%, making option prices ridiculous.

The implied move is EXTREMELY high at 24% vs the average move of 8% expected after earnings.

Short interest has moved higher with 5.65% days to cover. The upside move likely squeezed out shorts. There has also been heavy put buying on the Options Rank with the green dots which also caused a put squeeze higher.

HD Home Depot has been chopping near the 380 support and 200 day. I lean more to the short side breaking this support. I’m not crazy about pressing after a down move but I’ll add a small 1% sized short.

The implied move is 3.87% and has seen very small response in the last 4 quarters.

Short interest has been elevated for the last 6 months and has seen choppy action. There was recent heavy call buying on the highs on the Options Rank with the red dots but that has moderated with the downside move.

WDAY Workday has been chopping around since November near downside support. They report Tuesday after the bell and I will decide if I put on a position.
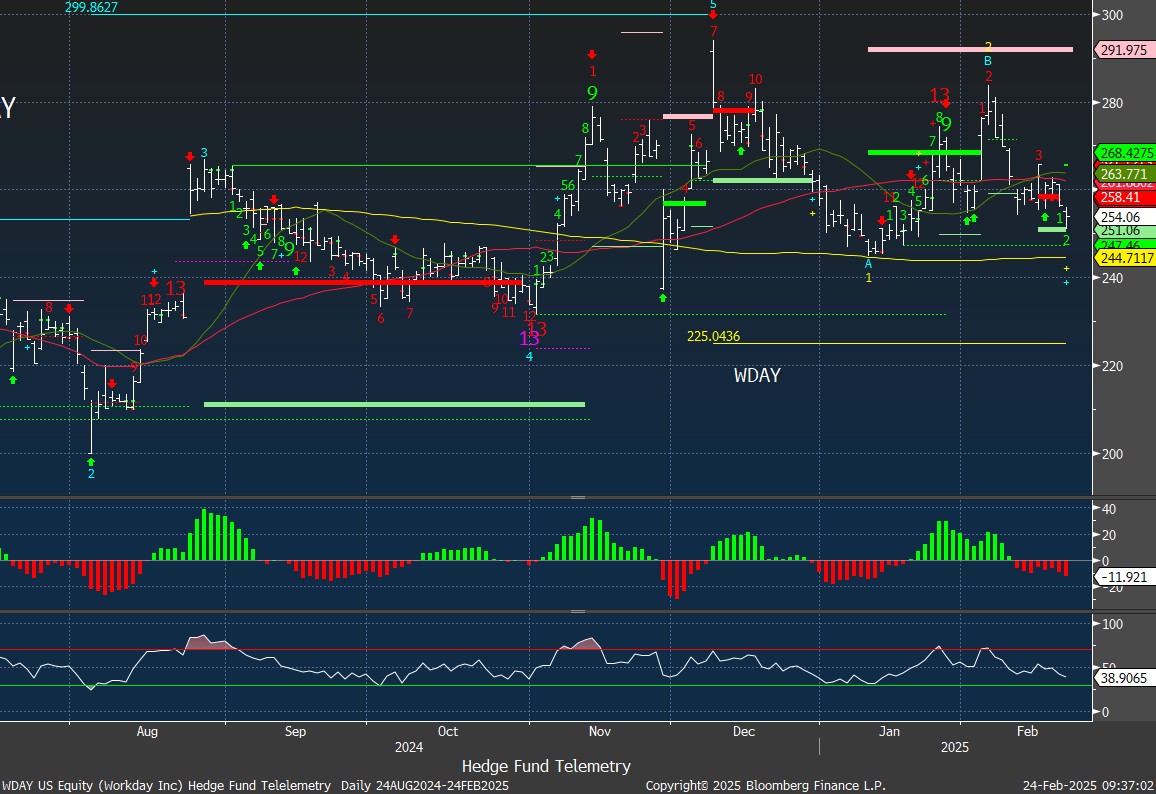
The implied move is 8.58%

Short interest has increased recently with 3.84 days to cover. The downside move in January lured in shorts. On the Options Rank there has been heavy-ish call buying with the red dots.

CAVA is breaking recent support and has downside to 86. If this didn’t have a high implied move I would probably put this on as a short idea.

The implied move is very high at 13.50%

Short interest is lower with just 3.15 days to cover. On the Options Rank there are green dots with heavy but not extreme put buying. Mixed data here.

RRC Range Resources has been trending higher holding the 50 day. Natural Gas has been higher and I expect to hear positive comments on the call with data center power generation. I’ll hold off as I would rather buy near 33-34.
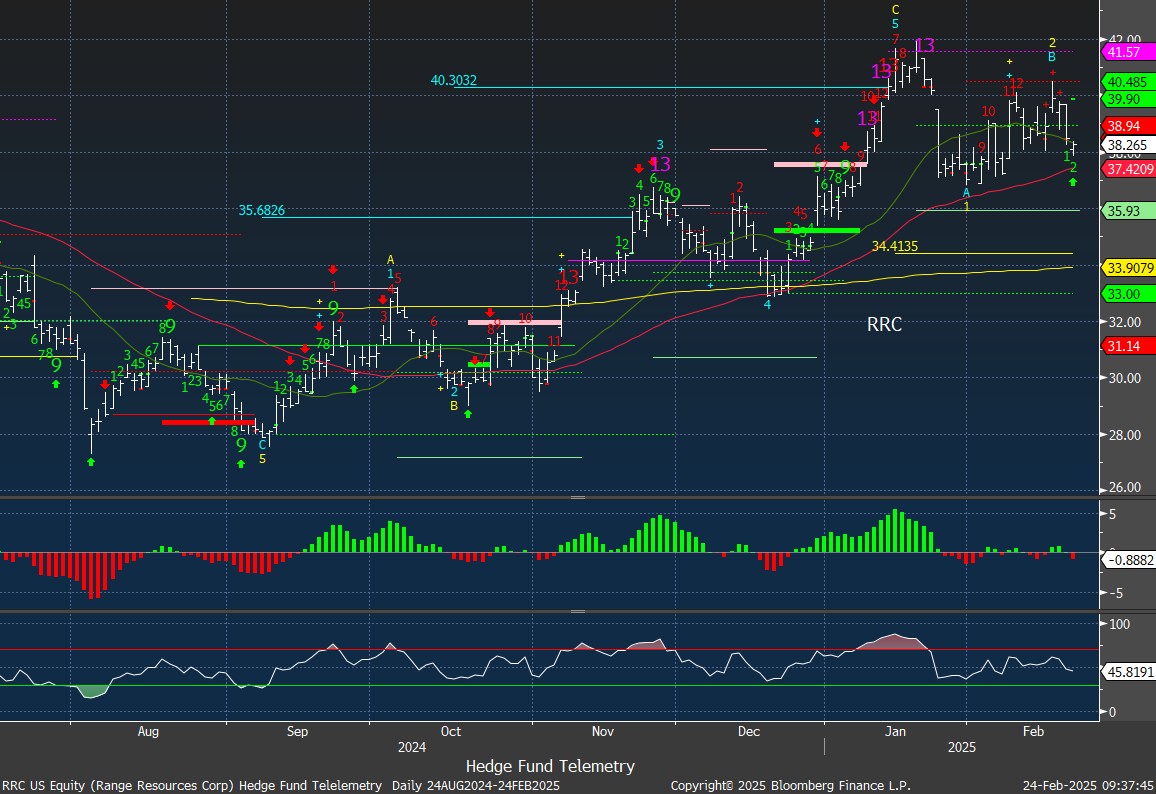
The implied move is 5.54%.
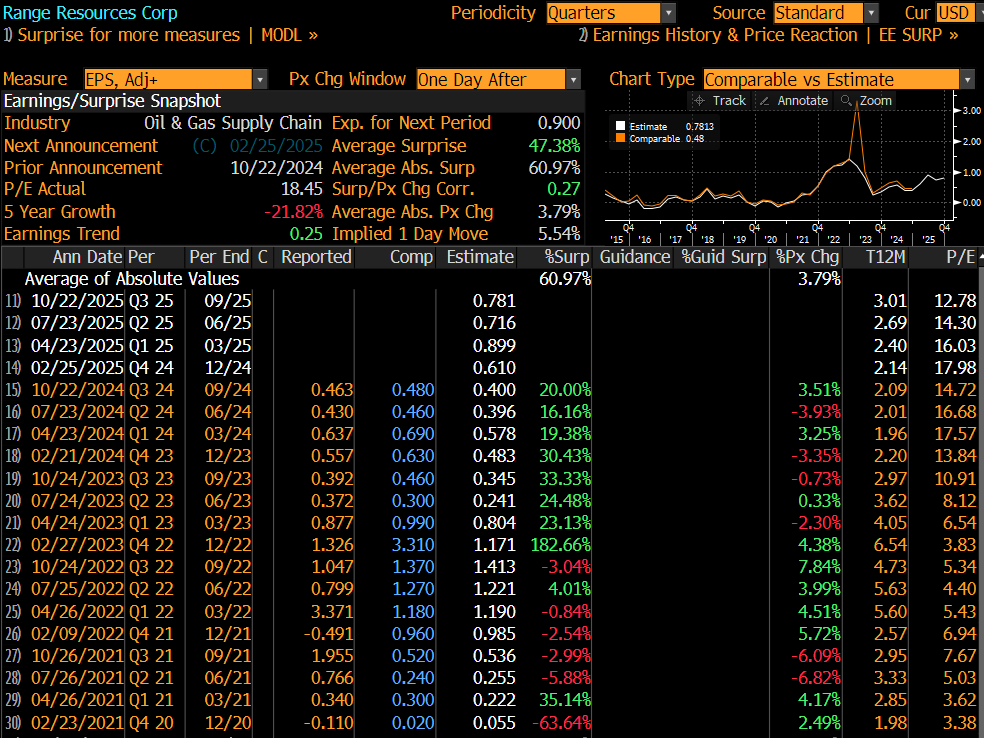
Short interest hs declined but still has 4.68 days to cover. There has been renewed put buying but it’s not extreme on the Options Rank.

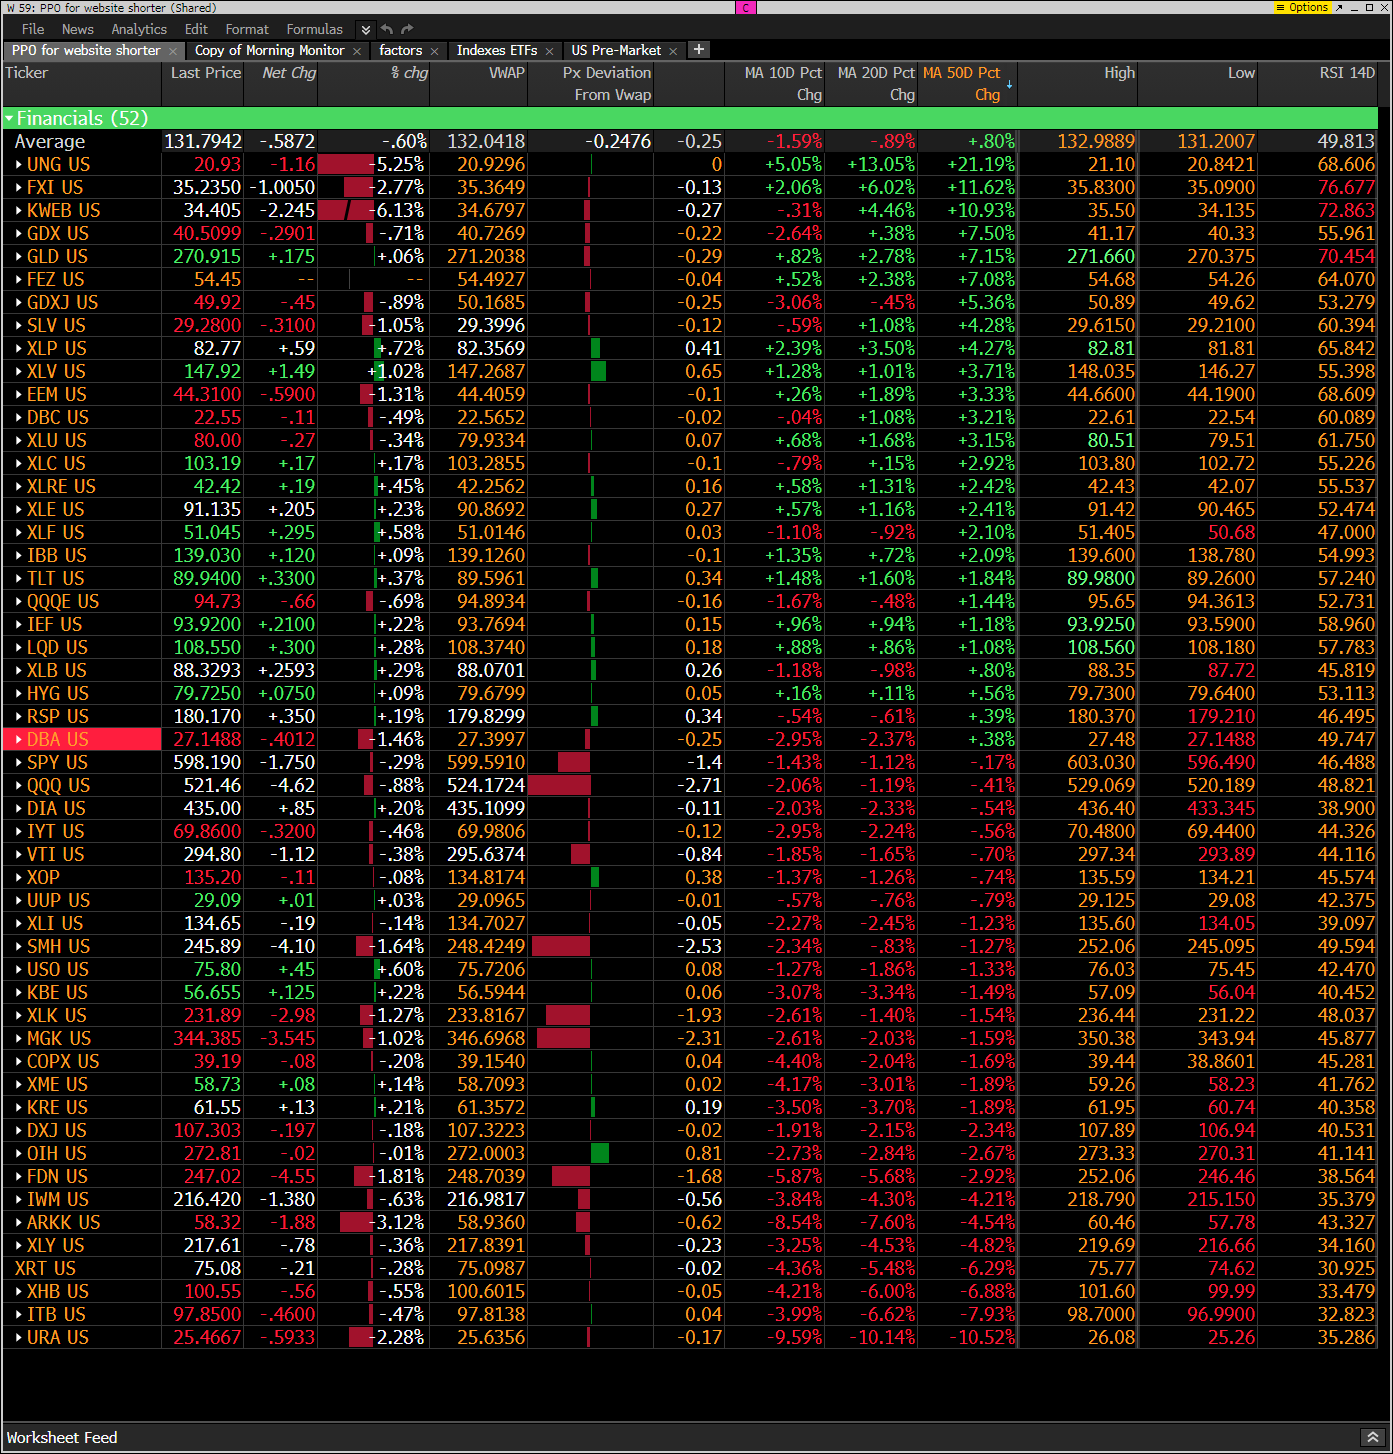
Hedge Fund Telemetry ETF Percentage Price Oscillator Monitor
The PPO monitor (percentage price oscillator) force ranks ETFs by percentage above/below the 50-day moving average. For information on this monitor, please refer to this primer. This monitor and others are offered to Hedge Fund Telemetry subscribers on Bloomberg. Seeing large declines with China which isn’t a surprise as we have reduced our exposure with the DeMark 13’s developing and with these overbought above the 50 day. Notable weakness with tech indexes and ETFs.
Index ETF and select factor performance
ETF with today’s performance with 5-day, 1-month, and 1-year rolling performance YTD. More of a defensive type of day vs offensive day. Mag 7 is now down 3.17% YTD.

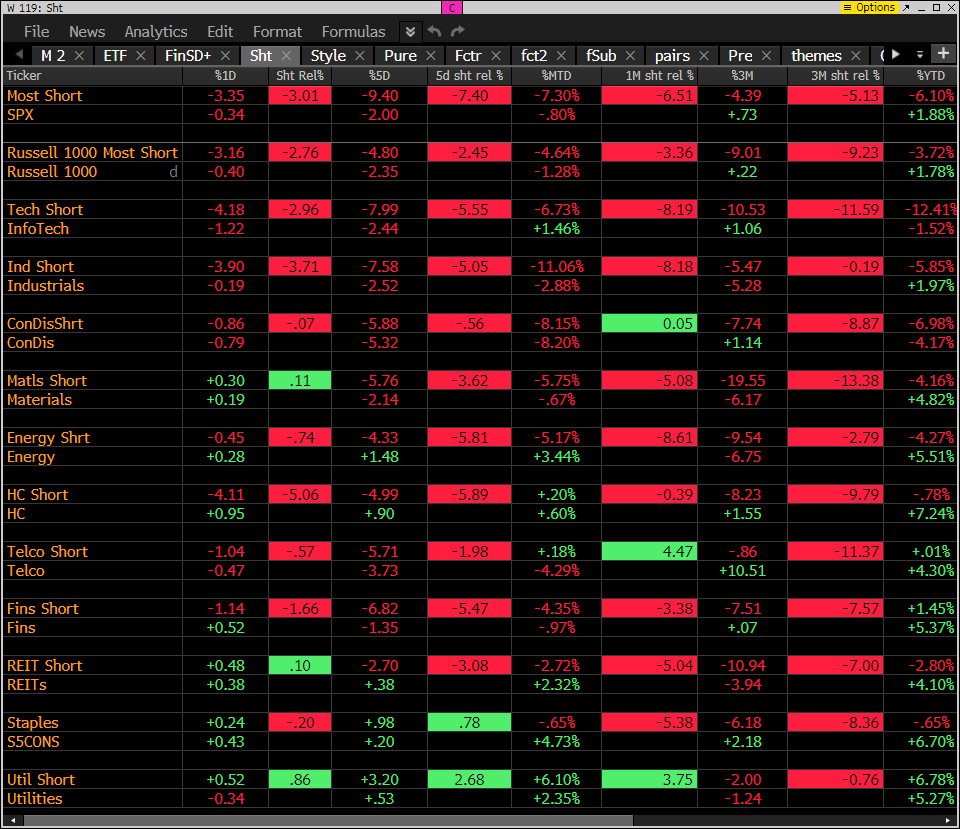
Goldman Sachs Most Shorted baskets vs. S&P Indexes
This monitor has the S&P indexes and the Goldman Sachs most shorted baskets. Short baskets have been notably down more than indexes. S&P is down 2% in the last 5 days with the GS most shorted basket down 9.4%. Congrats to the shorts.
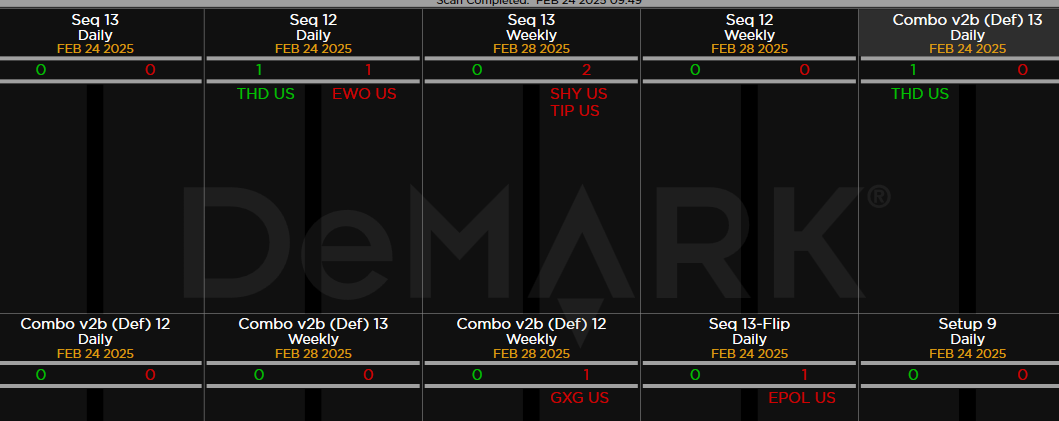
DeMark Observations
Within the S&P 500, the DeMark Sequential and Combo Countdown 13s and 12/13s on daily and weekly periods. Green = buy Setups/Countdowns, Red = sell Setups/Countdowns. Price flips are helpful to see reversals up (green) and down (red) for idea generation. The extra letters at the end of the symbols are just a Bloomberg thing. Worth noting: A little quiet with no big trends with both buy and sell Countdown 13’s. A few sell Setup 9’s to watch – notably AAPL

Major ETFs among a 160+ ETF universe.
If you have any questions or comments, please email us. Data sources: Bloomberg, DeMark Analytics, Goldman Sachs, Street Account, Vital Knowledge, Daily Sentiment Index, and Erlanger Research