
Instrument Flight Rules (IFR) govern how pilots operate an aircraft. They primarily use instruments and navigation aids when visibility is limited, such as in clouds, fog, or other low-visibility conditions, rather than relying on visual references.
It’s also that type of market with limited visibility on what will happen next with this tariff mess that has made everyone scared and nervous. I don’t know either. I can like others speculate on how this will play out, but I won’t. I can go into IFR mode and examine sentiment, internals, and charts with DeMark indicators. I try and tune out some of the noise and focus on the indicators because nobody needs to hear people who didn’t see the risks in advance and now are freaking out confidently bearish with the crowd.
Every decline is different with the catalyst that cracked the markets lower; however, each time, there are more similarities with the technical indicators moving to levels where previous bottoms occurred. My take overall is that a bounce is highly probable from these levels. It won’t be the low as I see more risks this year, but it can be a bounce to exploit on the upside. Perhaps S&P 500 at 5500.
Breaking news: Trump is pausing 90 days ex China. Equity markets ripping higher.
Quick Market Views
Stocks: Moving higher. Breadth turned very positive. Rushing so brief comments
Bonds: Mixed action with 2’s up 11bps, 10’s up 4bps, 30’s down 3bps
Commodities: Bloomberg Commodity index up 1.8%
Currencies: Bitcoin up 6% Dollar index flat
Trade Ideas Sheet: Net long
Changes: holding off on adding 2.5% weight SPY and QQQ – I planned on doing this but the rip was too fast. Adding 2% new OXY long. Doubling up both AA and FCX longs to 4%.
Thoughts: Big news with a pause.
US INDEXES
Here is a primer on the DeMark Setup and Sequential indicators.
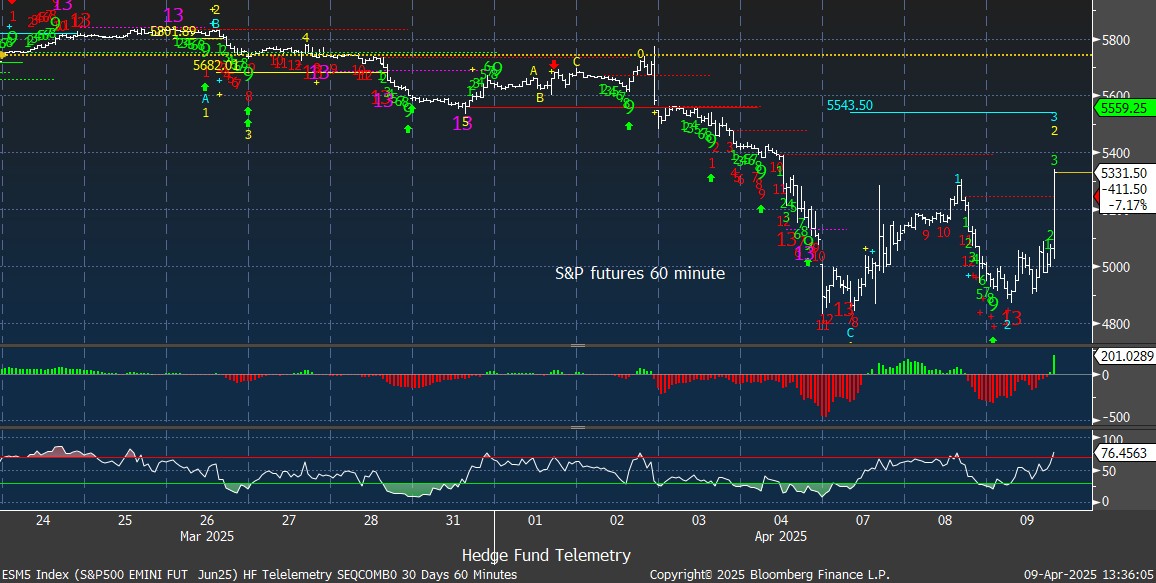
S&P futures 60-minute tactical time frame with wave 3 price objective of 5543. Nice DeMark Sequential on the lows today
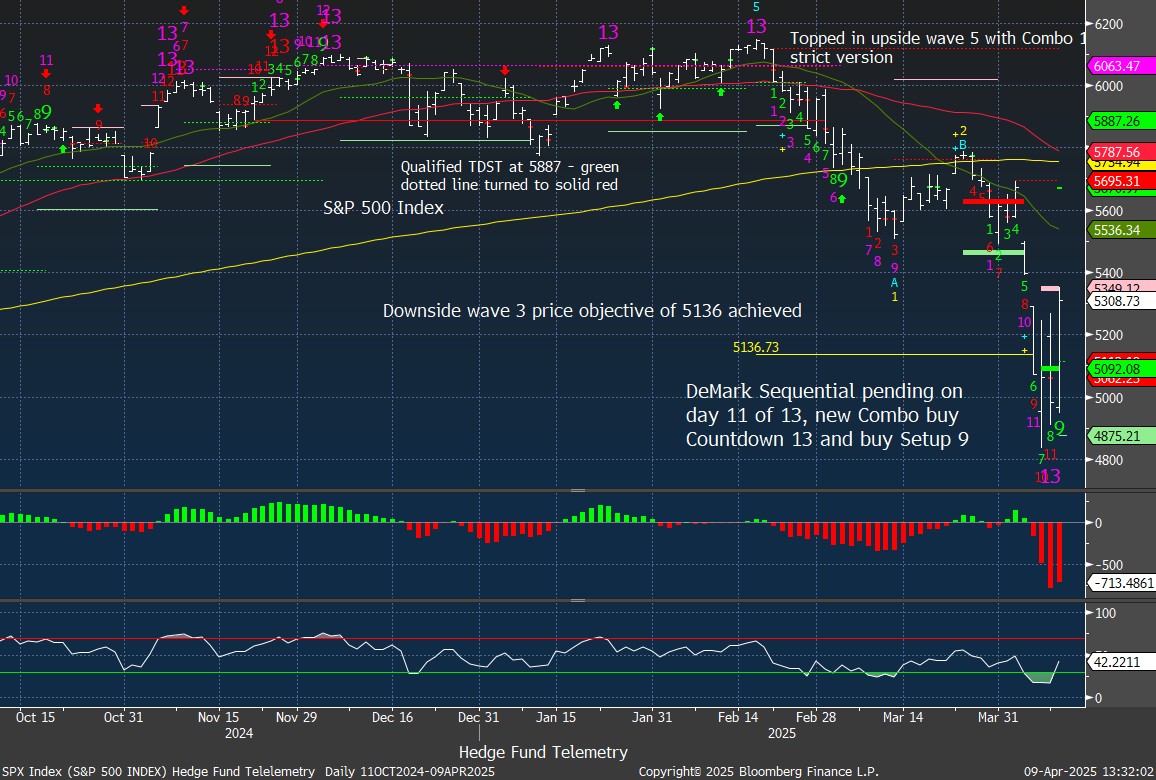
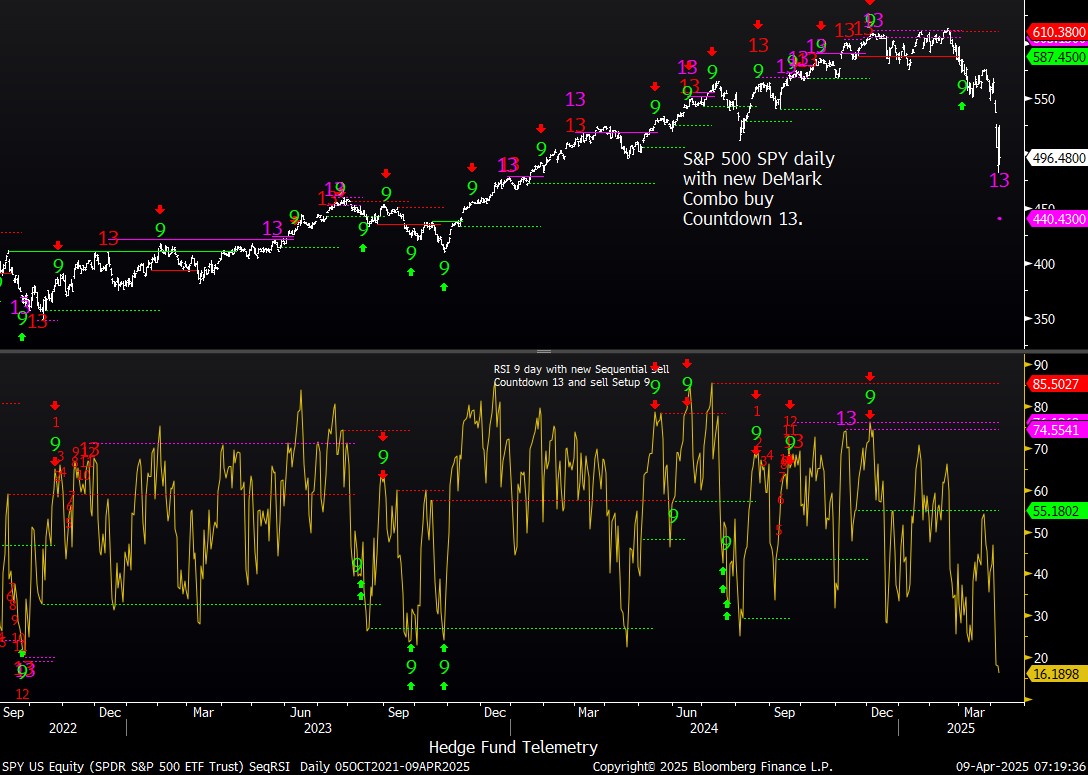
S&P 500 Index daily with recent Combo 13 and buy Setup 9. Setup 9 might cancel if above green bar 5 close! Boom
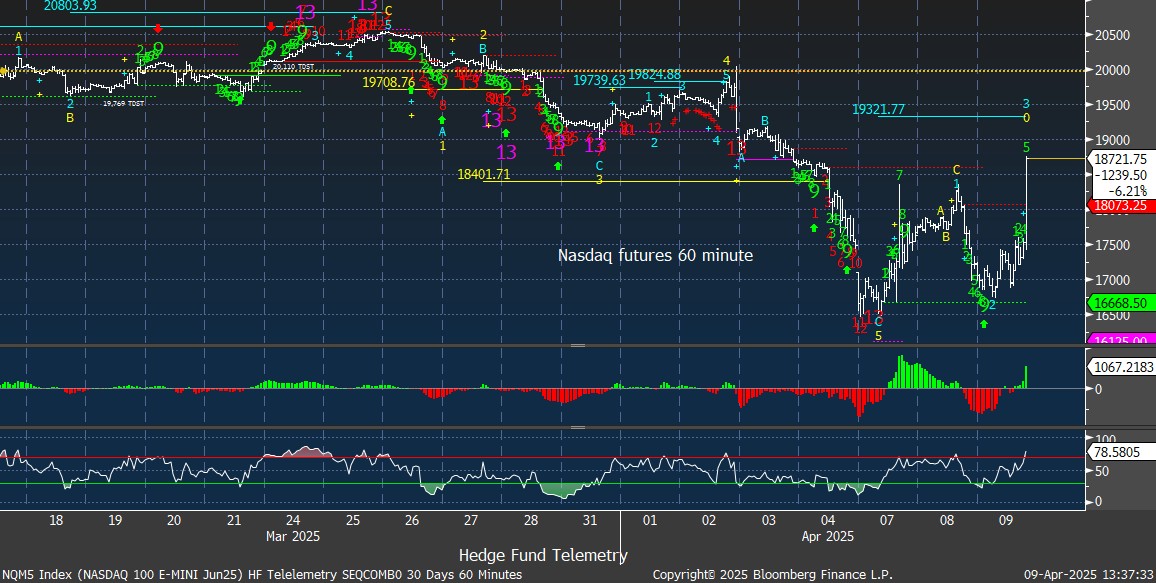
Nasdaq 100 futures 60-minute tactical time frame also with an upside wave 3 price objective
Nasdaq 100 Index daily boom! buy Setup 9 might cancel if above green bar 5 close

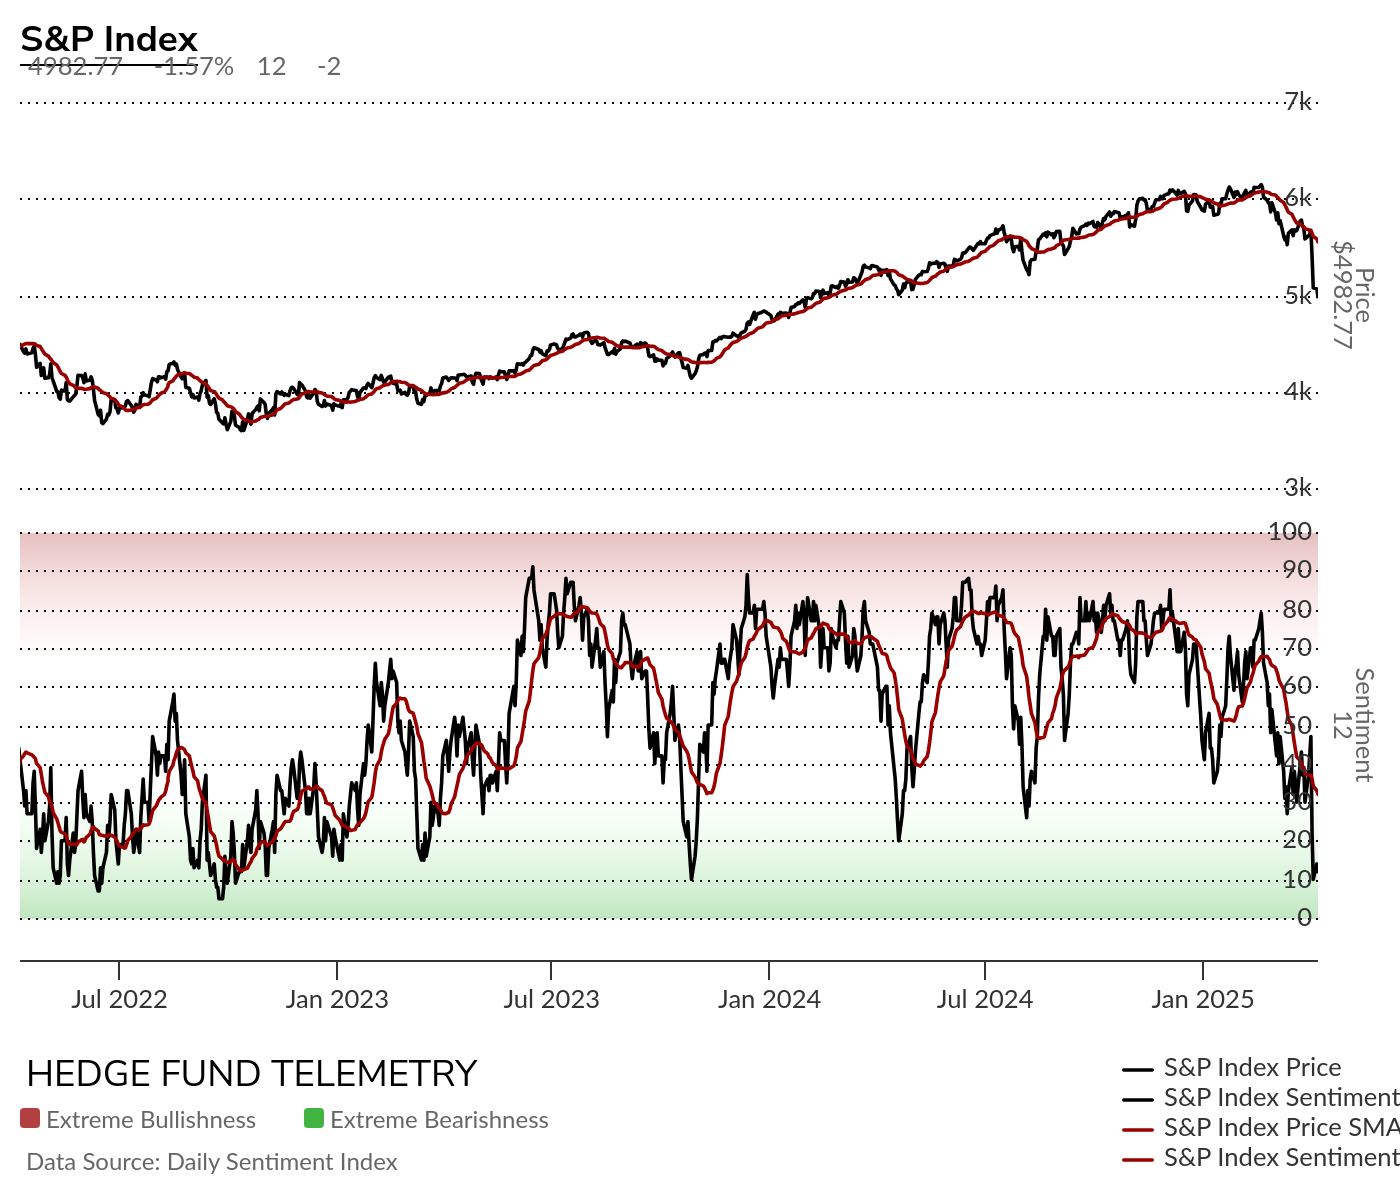
sentiment check – dire
Here’s a 3-year look at the S&P sentiment. It’s oversold and generally sees a mean reversion bounce from deep levels. That doesn’t mean it’s an all clear because it could be more like 2022 when sentiment remains choppy and depressed.
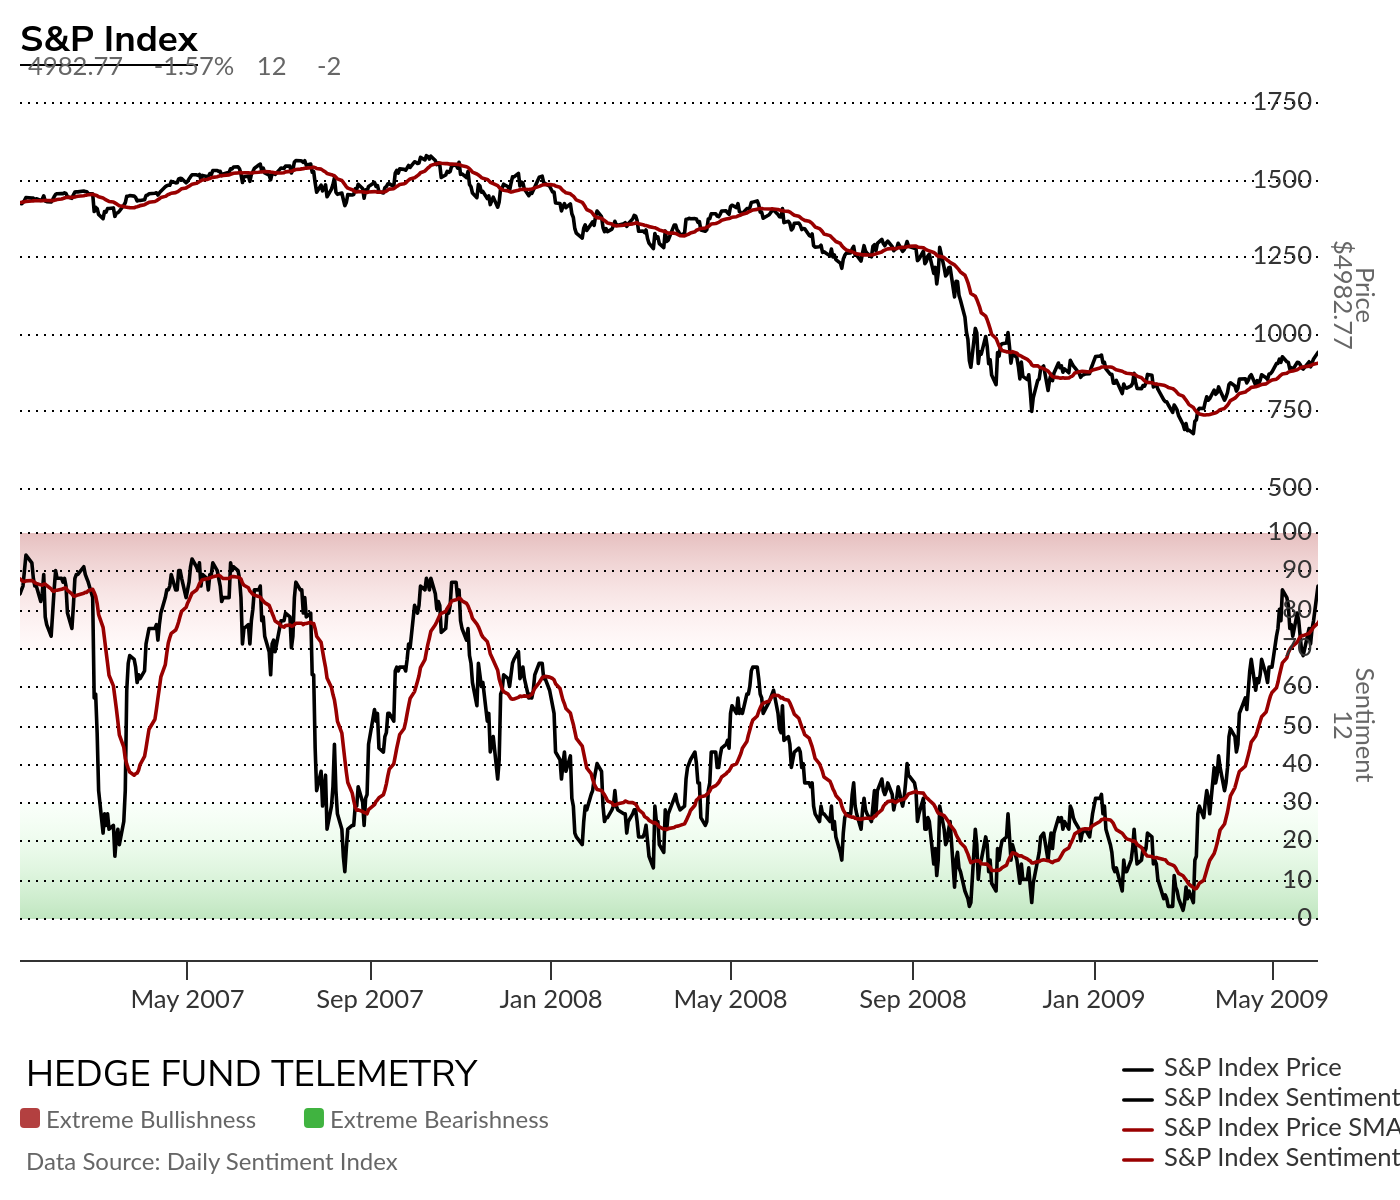
You can adjust sentiment to other time frames on the site which is something I really have to say is cool. This is the S&P sentiment from the 2007 top to the bottom in 2009. On the way to the lows saw wire to wire bullish to bearish reversals with it moving to a protracted downside depressed level in 2008 Q2 through Q2 in 2009. When on March 2, 2009 it hit 2% still one of the most oversold readings I can recall. My firm at the time had been very short and successful through the GFC started buying and went long.
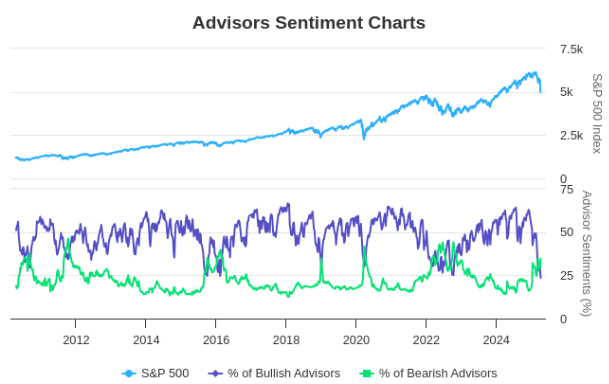
Investors Intelligence changed their site and charts which I can say I don’t like but there is a cross with more bears than bulls. Typically decent buying opportunities were seen.
The CNN Fear and Greed Index has 7 components and all are in the extreme fear zone. At 4% it’s also quite low. At the exact low in 2020 during Covid it hit 0 briefly. Regardless, it’s is consistent with the other sentiment indicators.

Trade Ideas Sheet
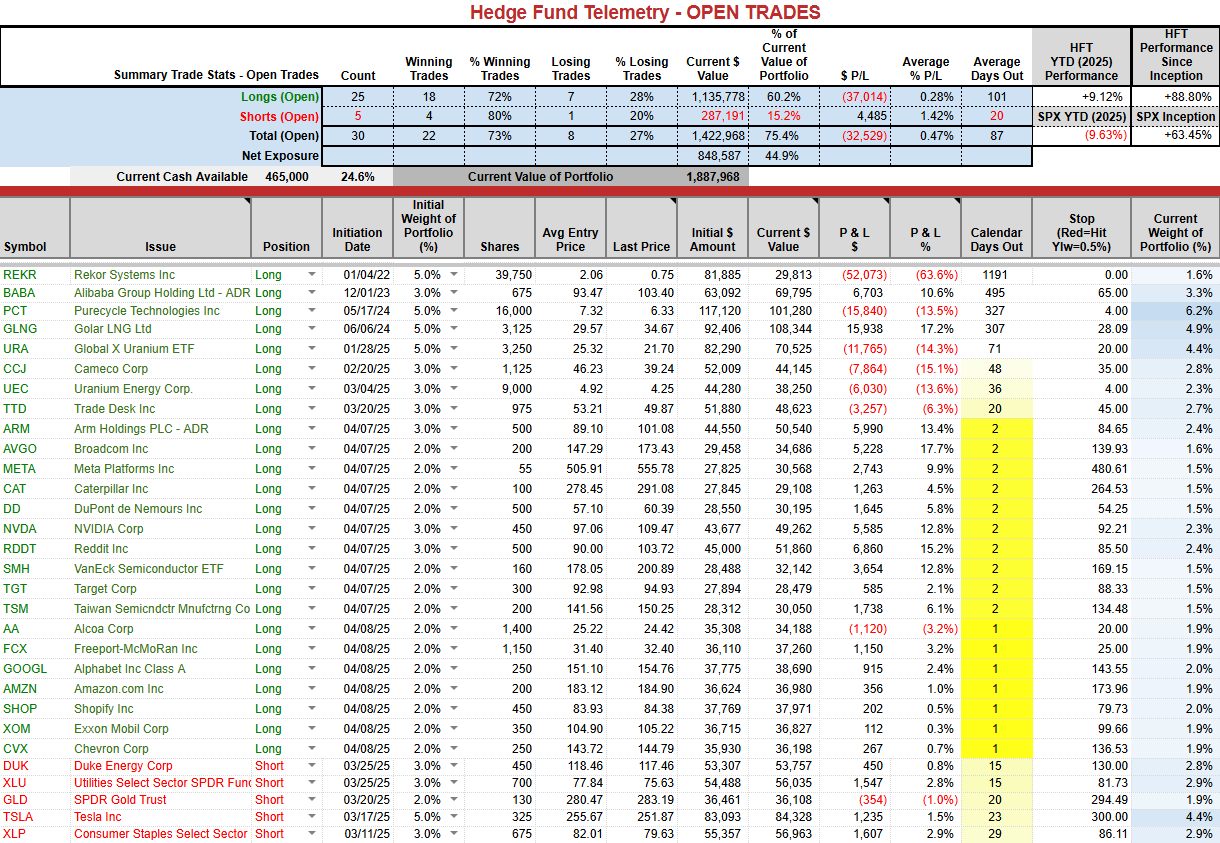
The SPY and QQQ have turned positive. I had hoped to add 5% before the news and then just add just 2.5% long with both SPY and QQQ but I WILL HOLD OFF AFTER THE EXTREME MOVE

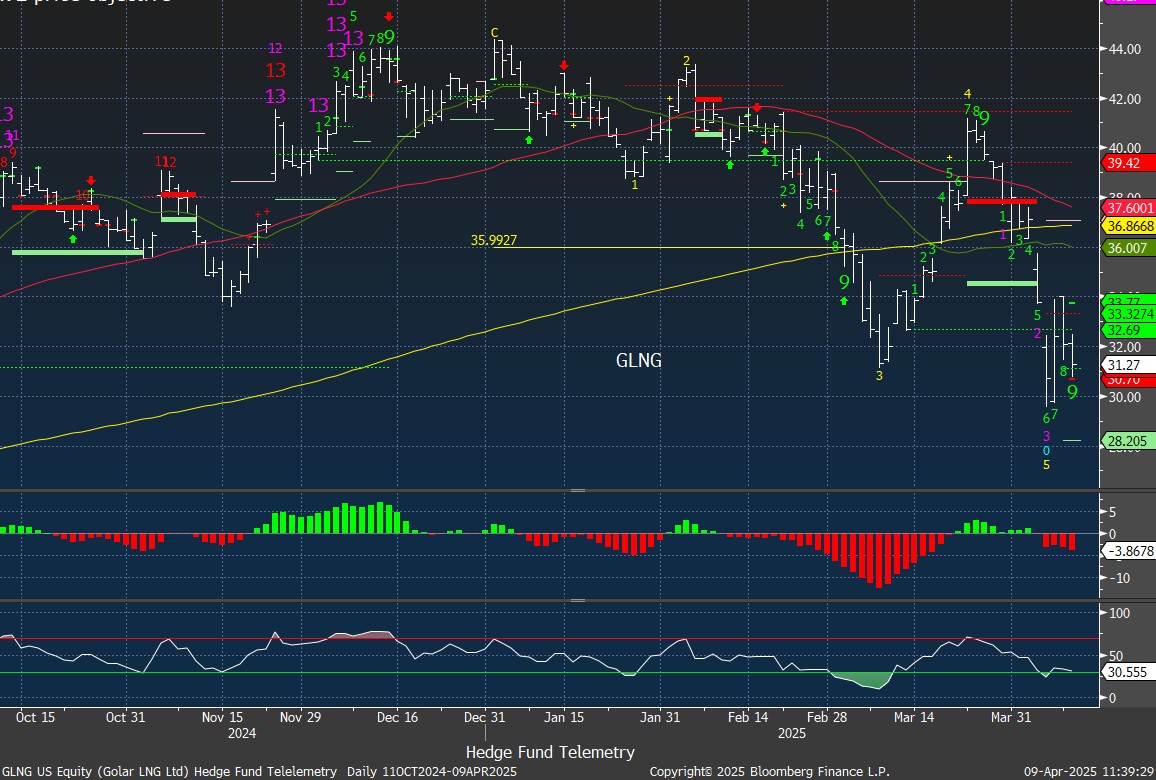
GLNG more volatility than I expected. Still like this one a lot for 2025.
Doubling up AA to 4% weight and FCX too
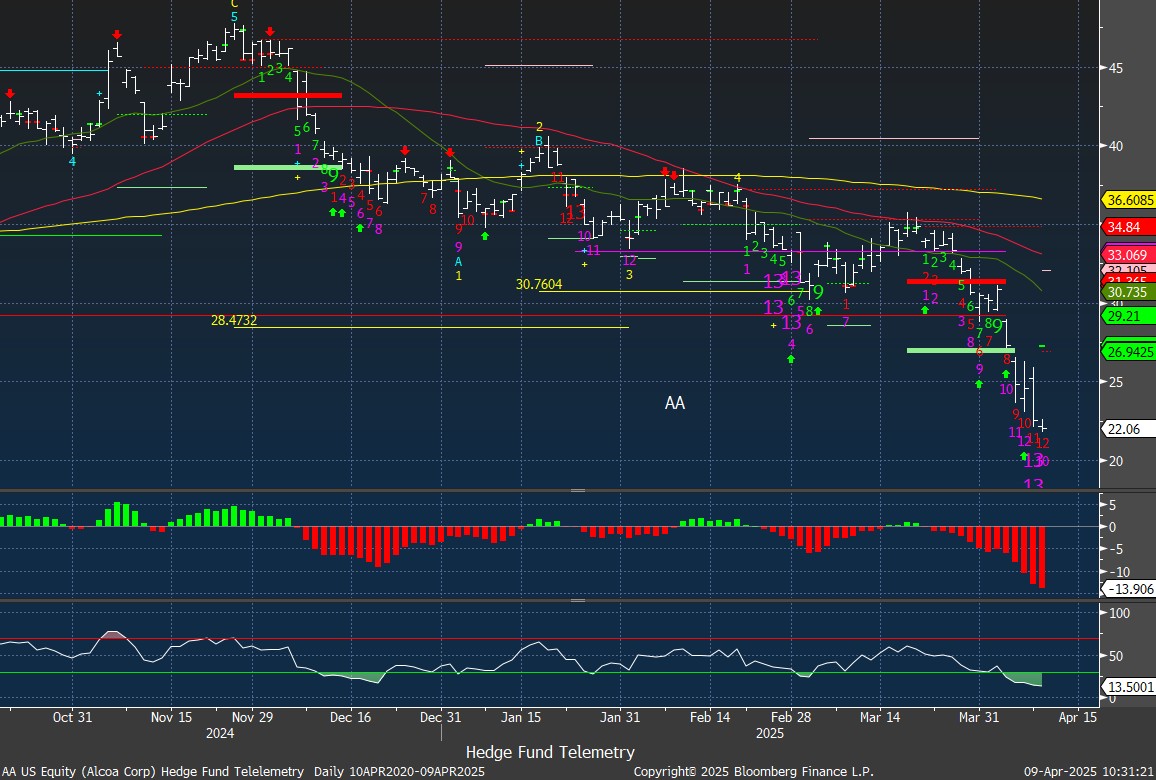
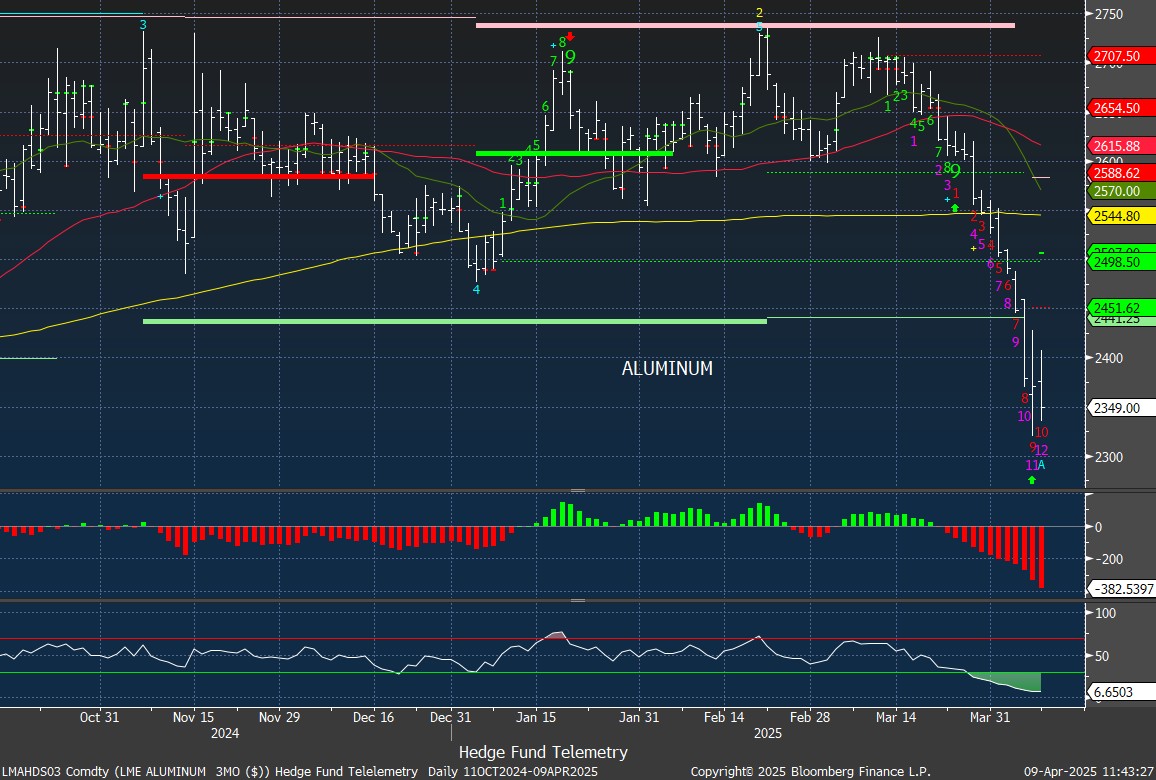
Aluminum nearly has downside exhaustion
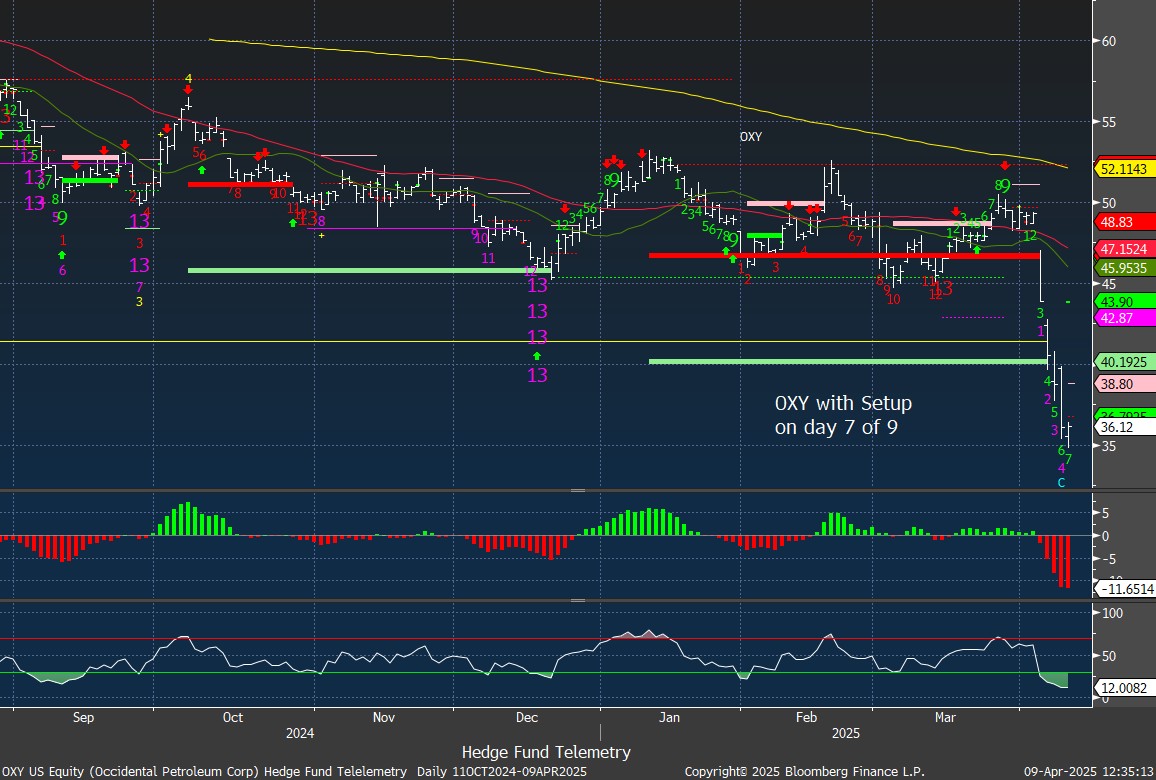
OXY has falling hard and I am glad we sold the last 9. I wonder if Warren Buffett is buying or if might buy the whole company with this decline. I’ll buy 2% weight again.
Oversold Evidence points to a bounce
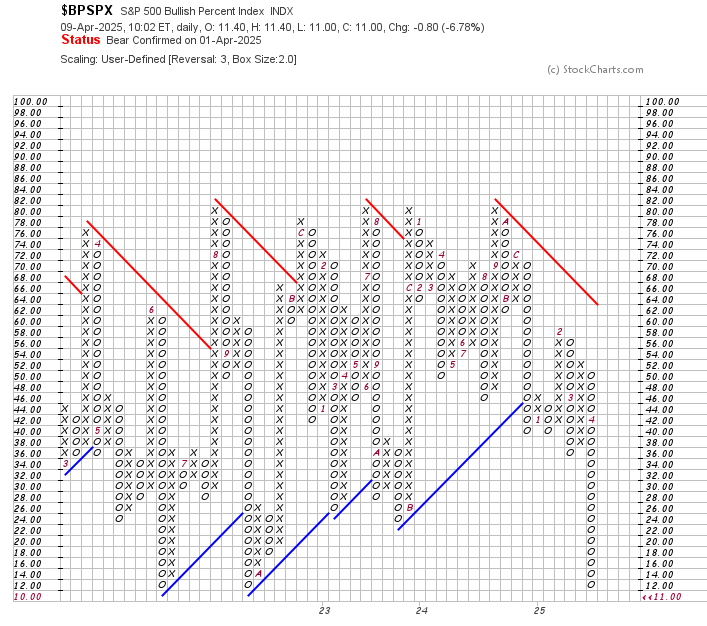
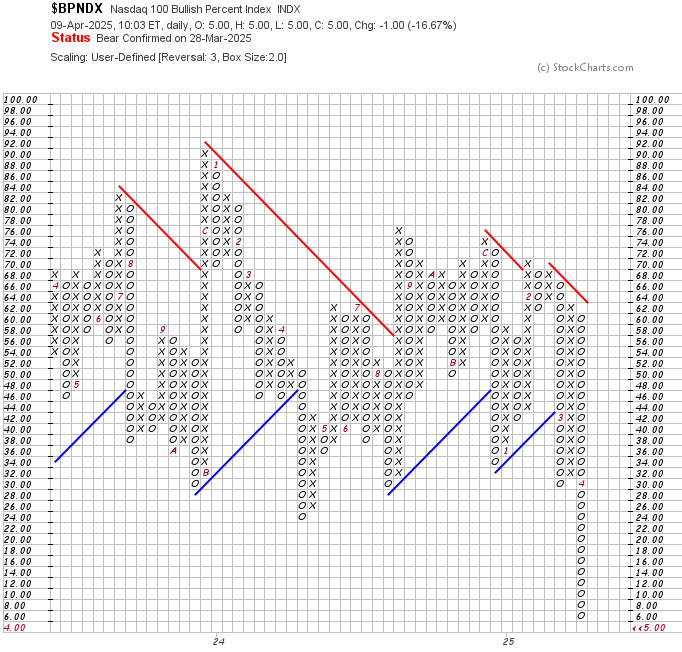
I showed the S&P and NDX bullish percent charts on yesterday’s webinar. For a primer on how these work, click here.
These are oversold.
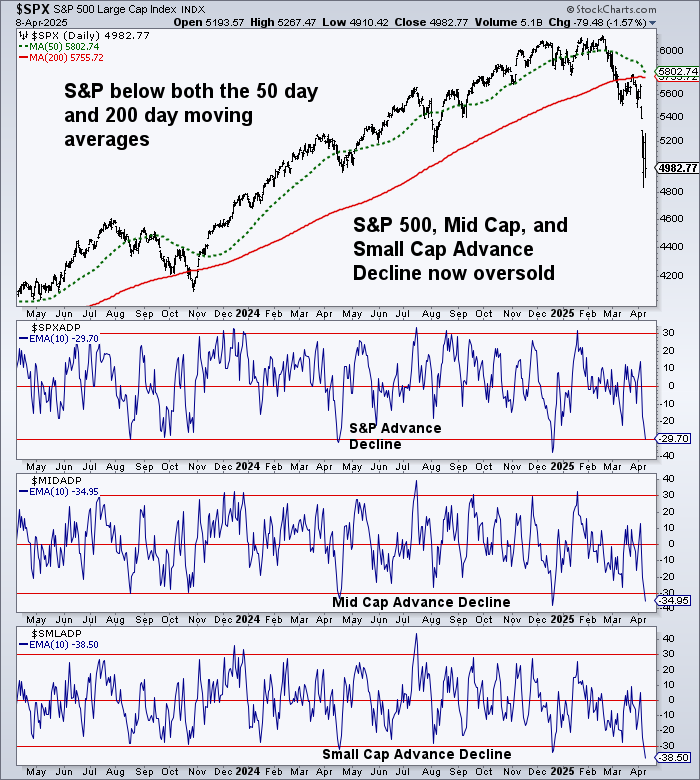
Advance decline data is now oversold. This will be one of the early movers on the upside.
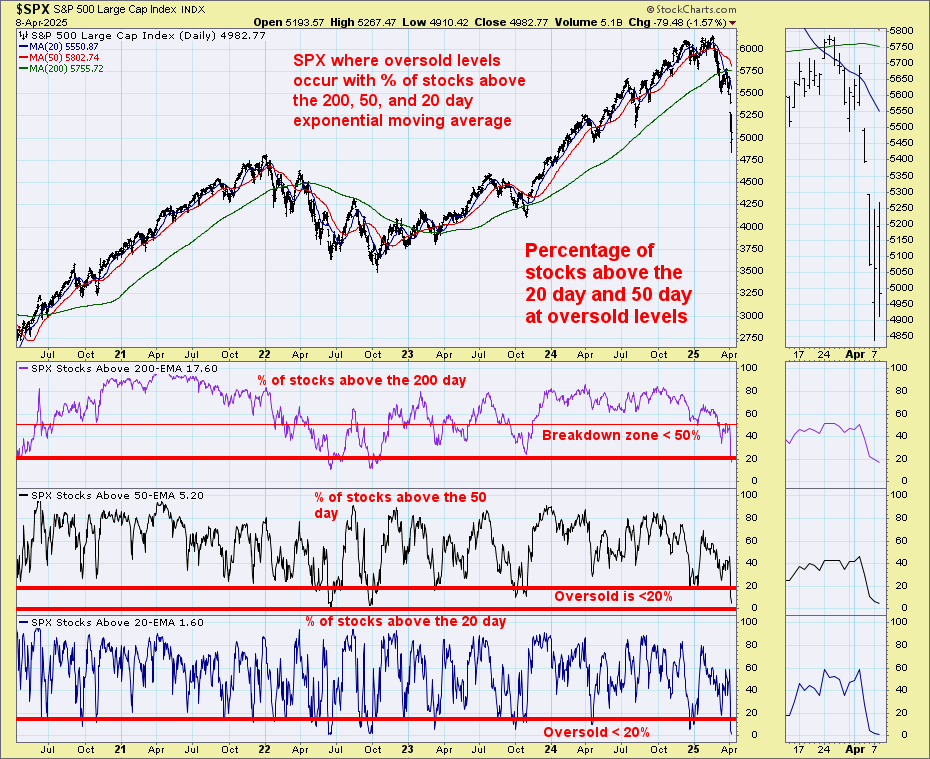
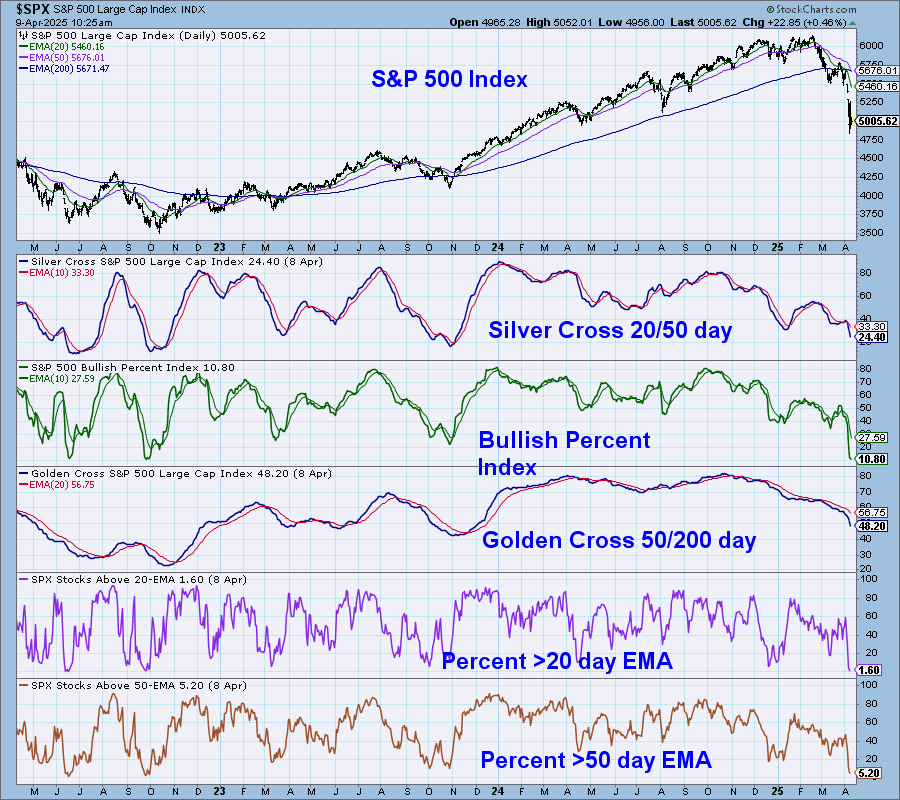
This is one of the more reliable and easy to replicate charts. The percentage of stocks above the 20, 50, and 200 day moving average is now deeply oversold. Only 1.6% above the 20 day and 5.2% for the 50 day. Keep in mind with the SPY now 13.5% below the 50 day (see below) this might take some time to rebound with the data.
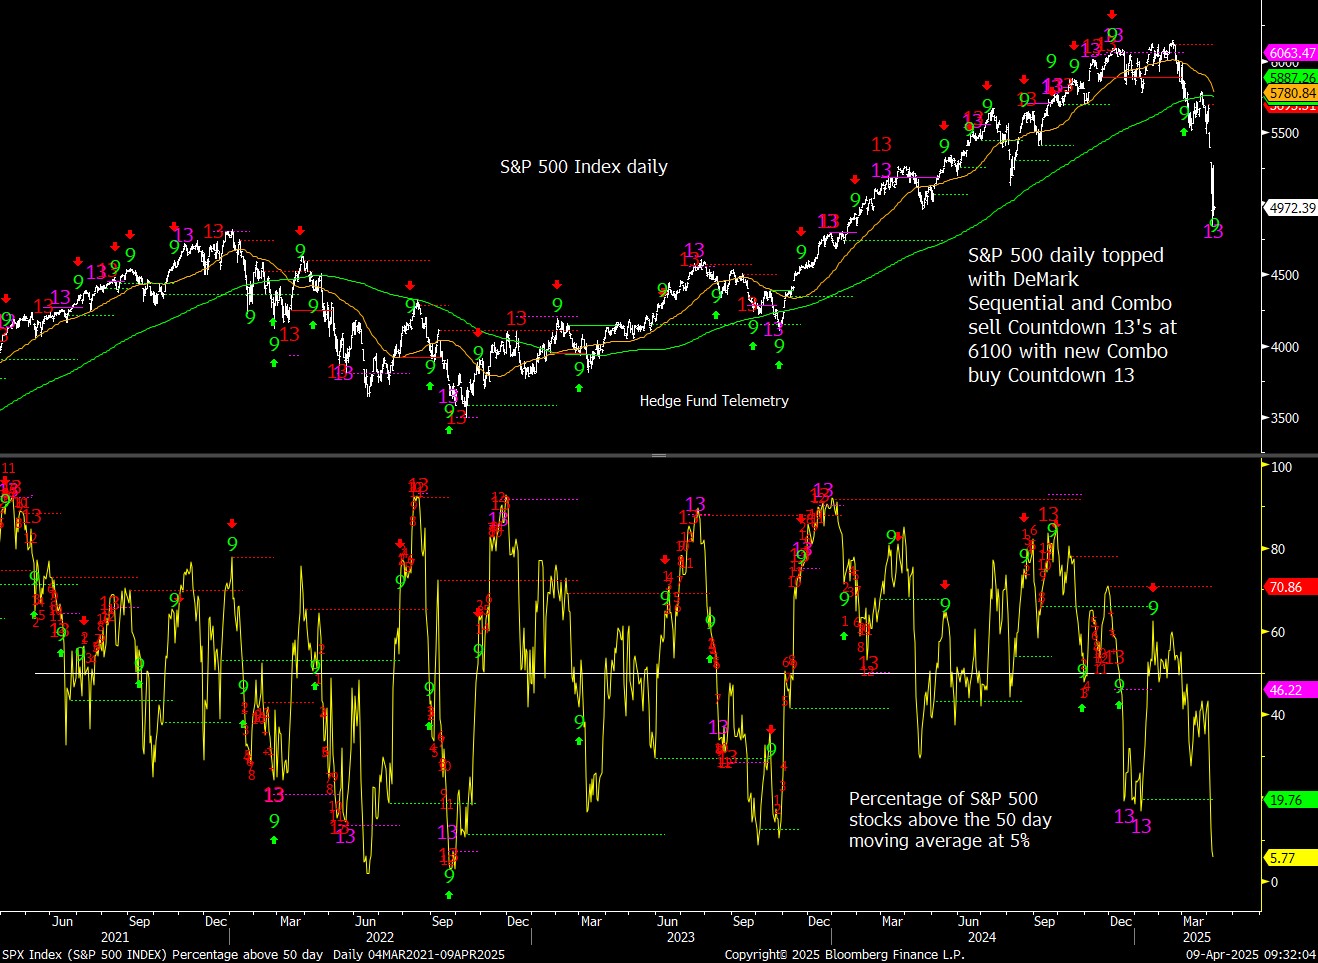
Here’s another look at the percentage of S&P stocks above the 50 day.
I use a shorter 9 day RSI and this is deeply oversold at 16.
The GS Most Shorted basket has a new DeMark Combo 13 and Sequential very close to qualifying the 13. This topped with the Sequential 13 and previously saw a market bottom with the last buy Countdown 13’s. Considering the GS data showed the highest $ amount of shorting last week coming very late in the downside move, there is fuel for a short squeeze.

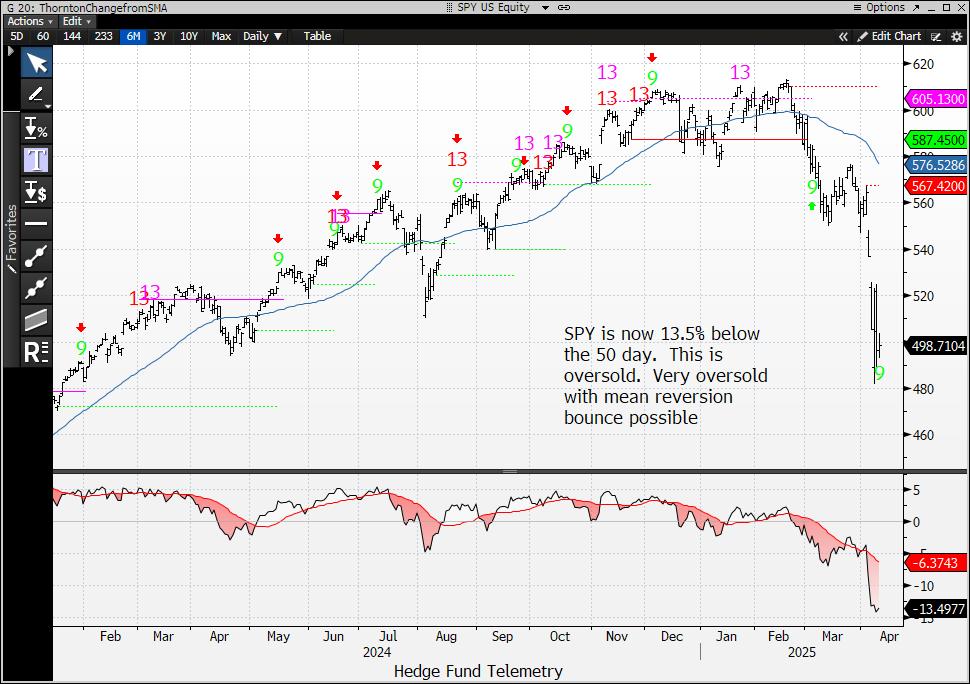
SPY is now 13.5% below the 50 day moving average. This is one of the deepest moves seen in many years and I would argue a mean reversion bounce is probable.
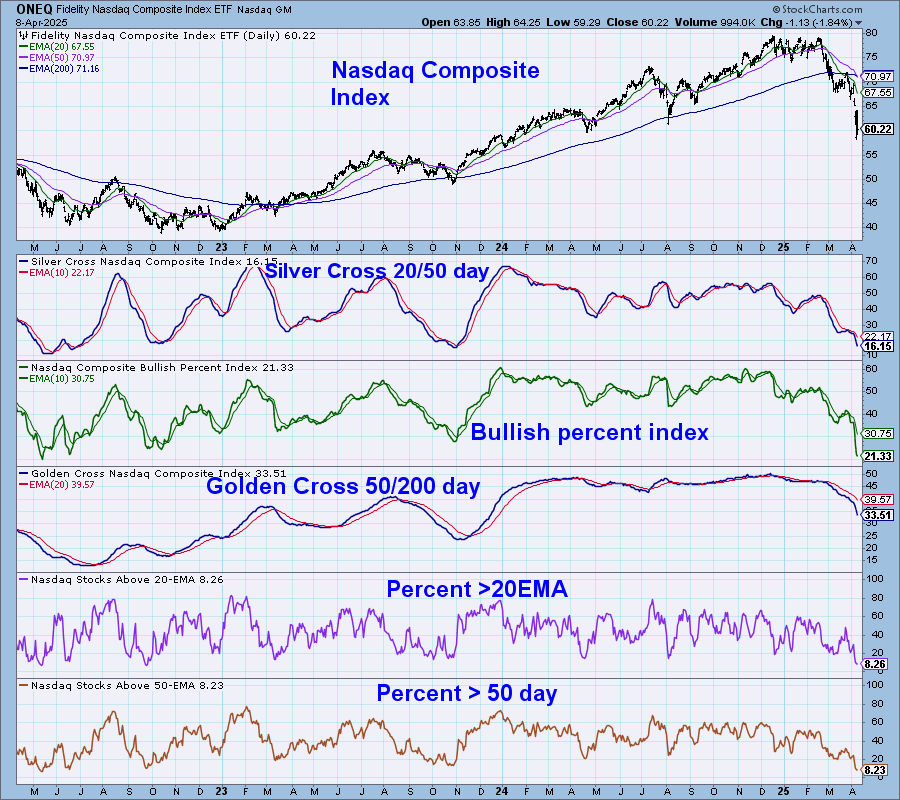
The S&P and Nasdaq Composite with various internal indicators have them all at low levels. The golden cross is more of a lagging indicator and will probably continue lower even with a bounce.
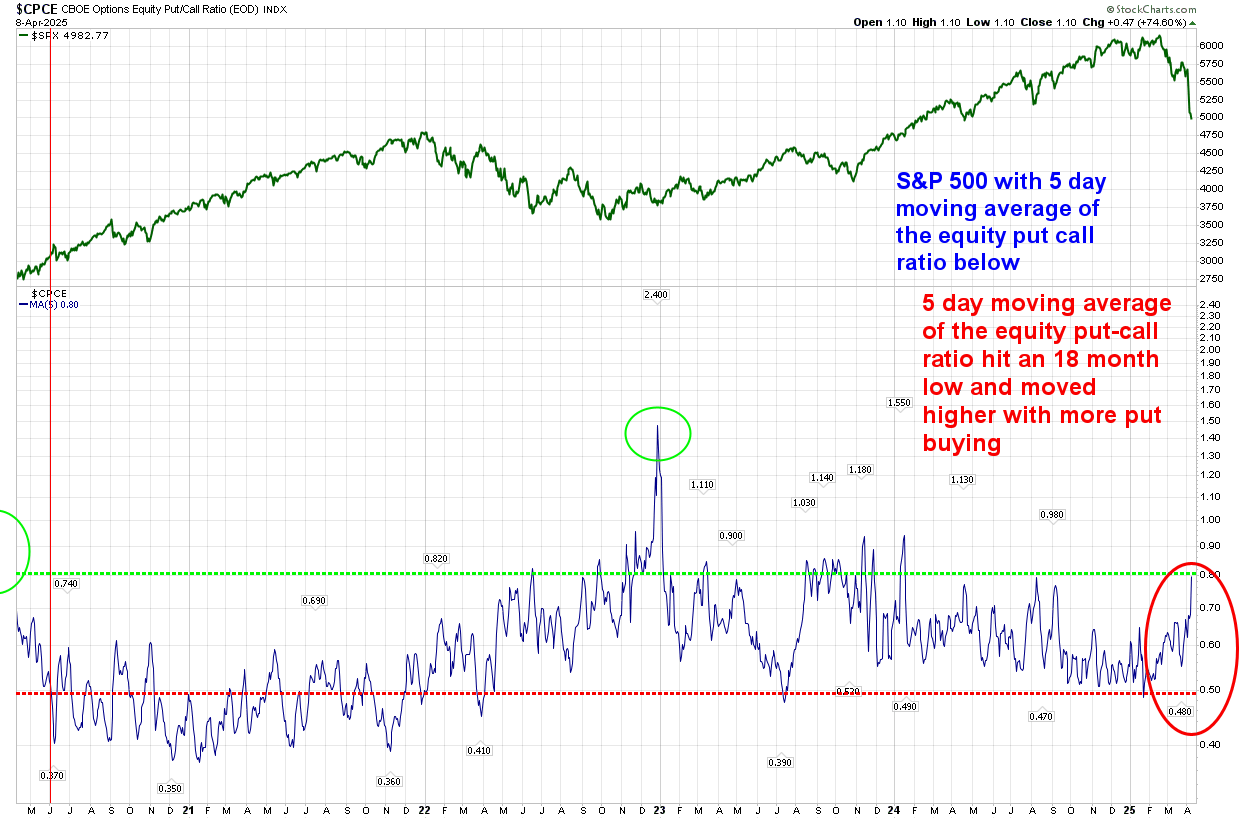
The equity only put call ratio 5 day moving average has seen a spike with more put buying. This can and probably move higher as it’s a 5 day moving average. Spikes like this typically are good for upside in the equity markets.
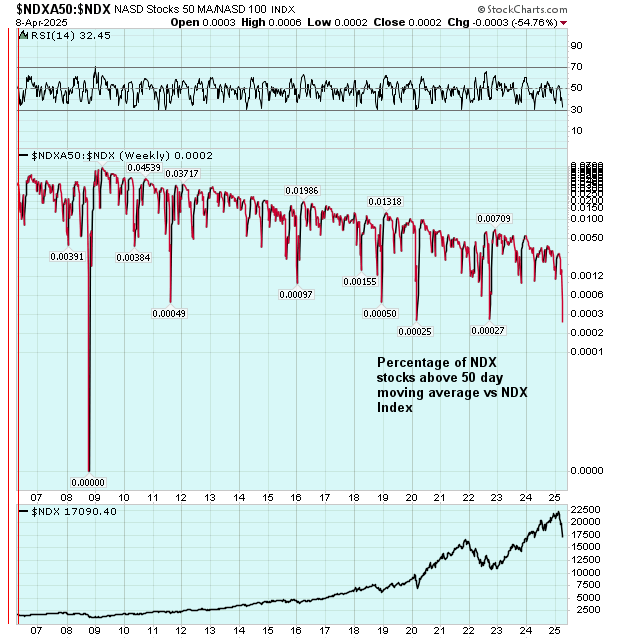
I don’t show this one often but it’s oversold. It’s the percentage of NDX stocks vs the NDX. It’s a log chart so if it goes to 0 it’s not much that significant.
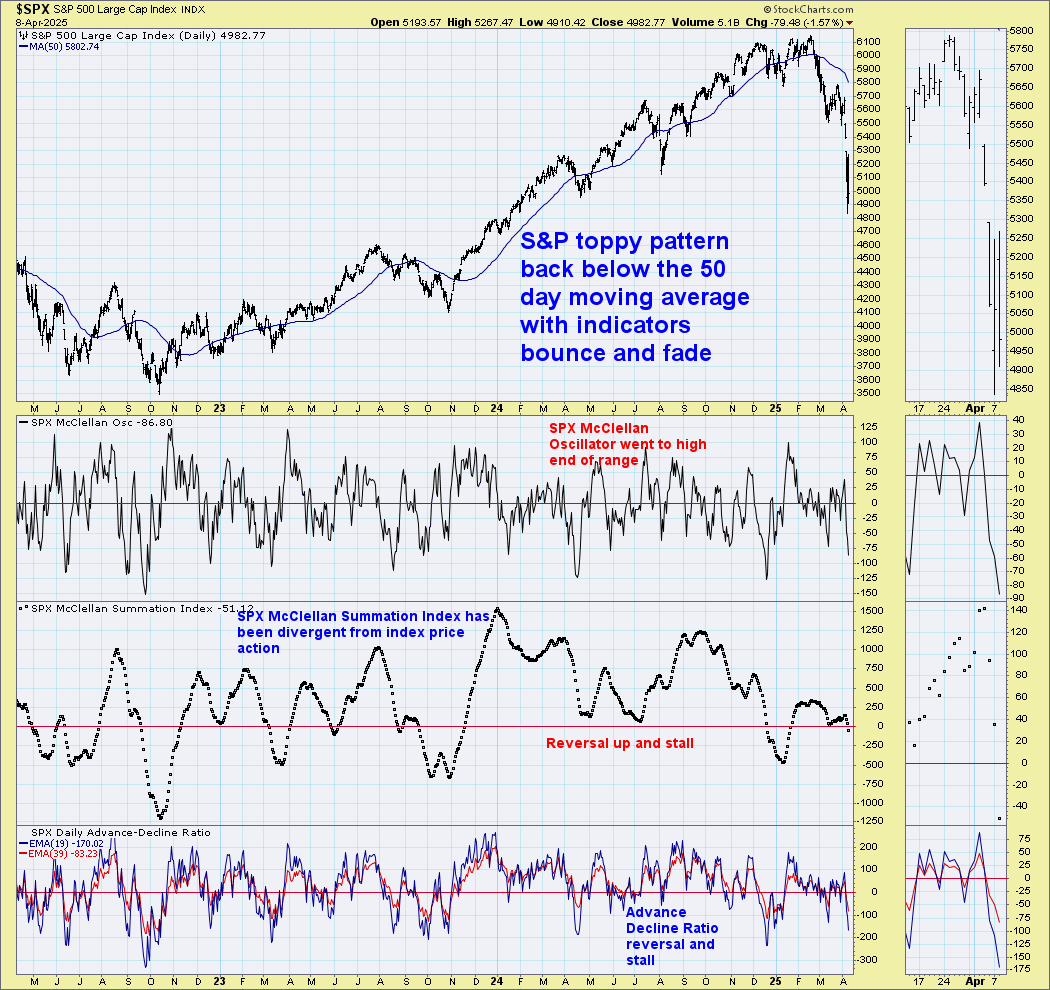
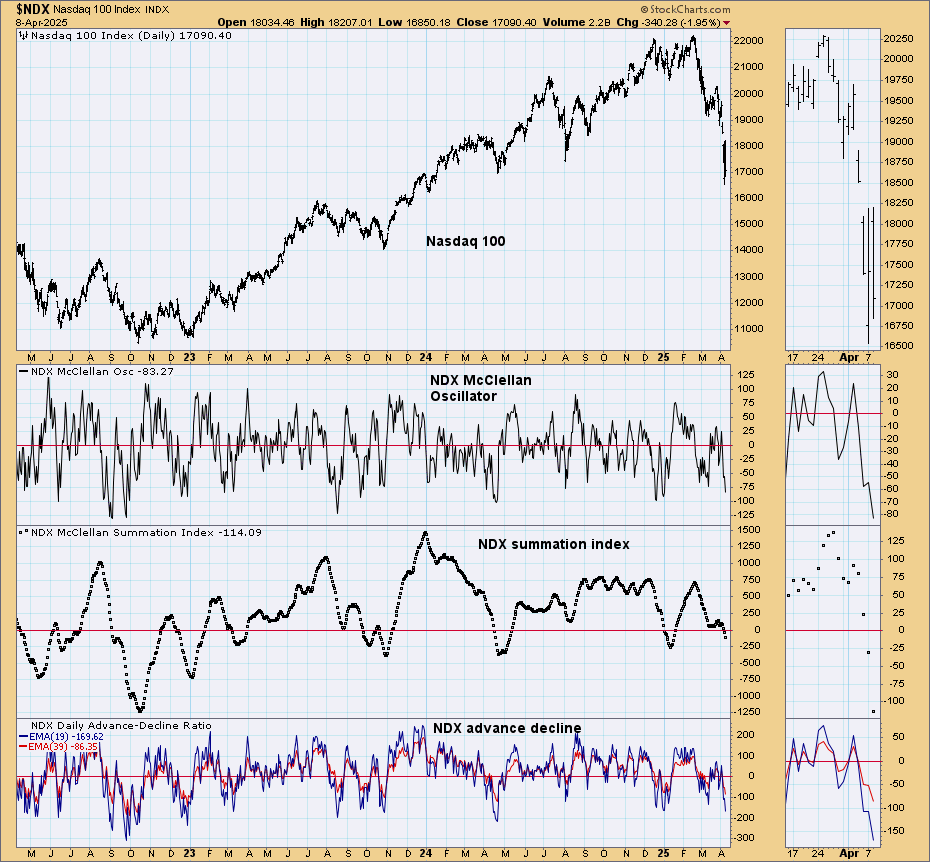
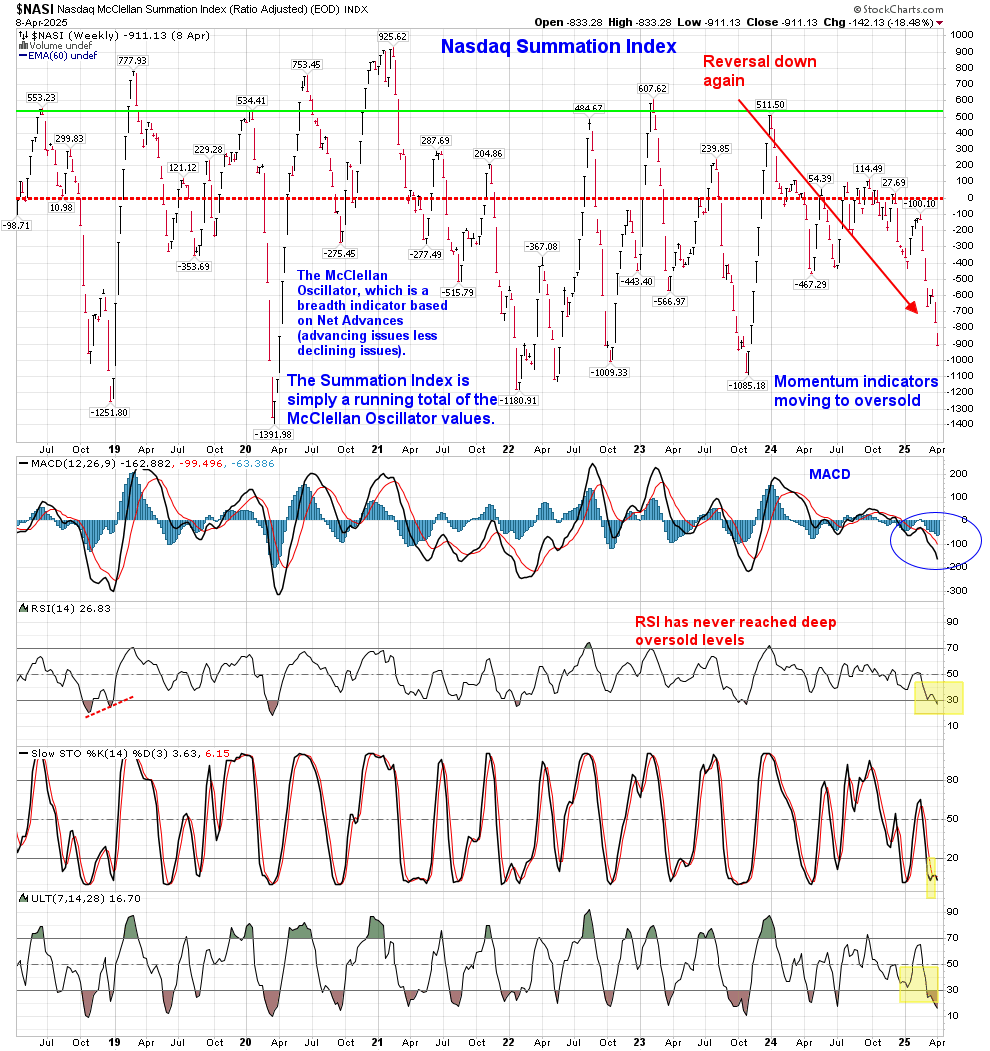
The S&P and Nasdaq 100 with McClellan indicators are moving lower. The daily summation indexes are not oversold yet.
Nasdaq Summation weekly has been moving lower and at -900 it is pretty close to other levels where things were washed out. Indicators on this are fairly oversold now too.
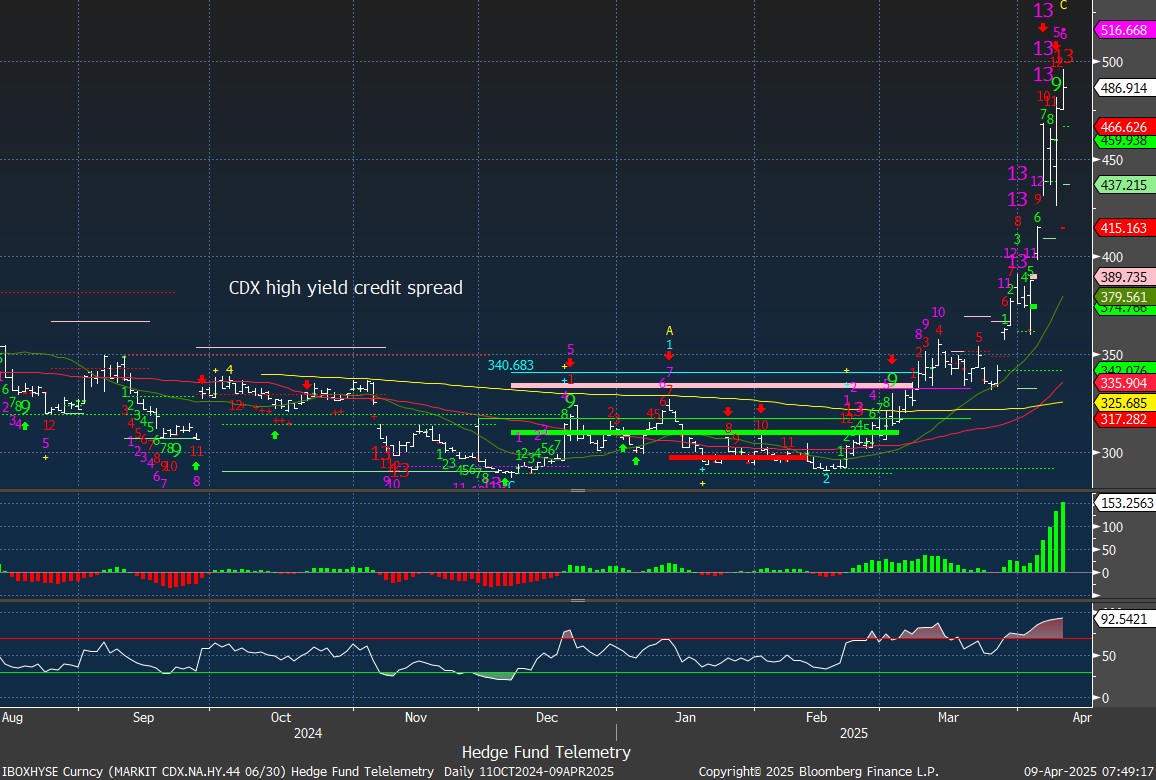
CDX High Yield credit spread with new Sequential and Combo 13’s.
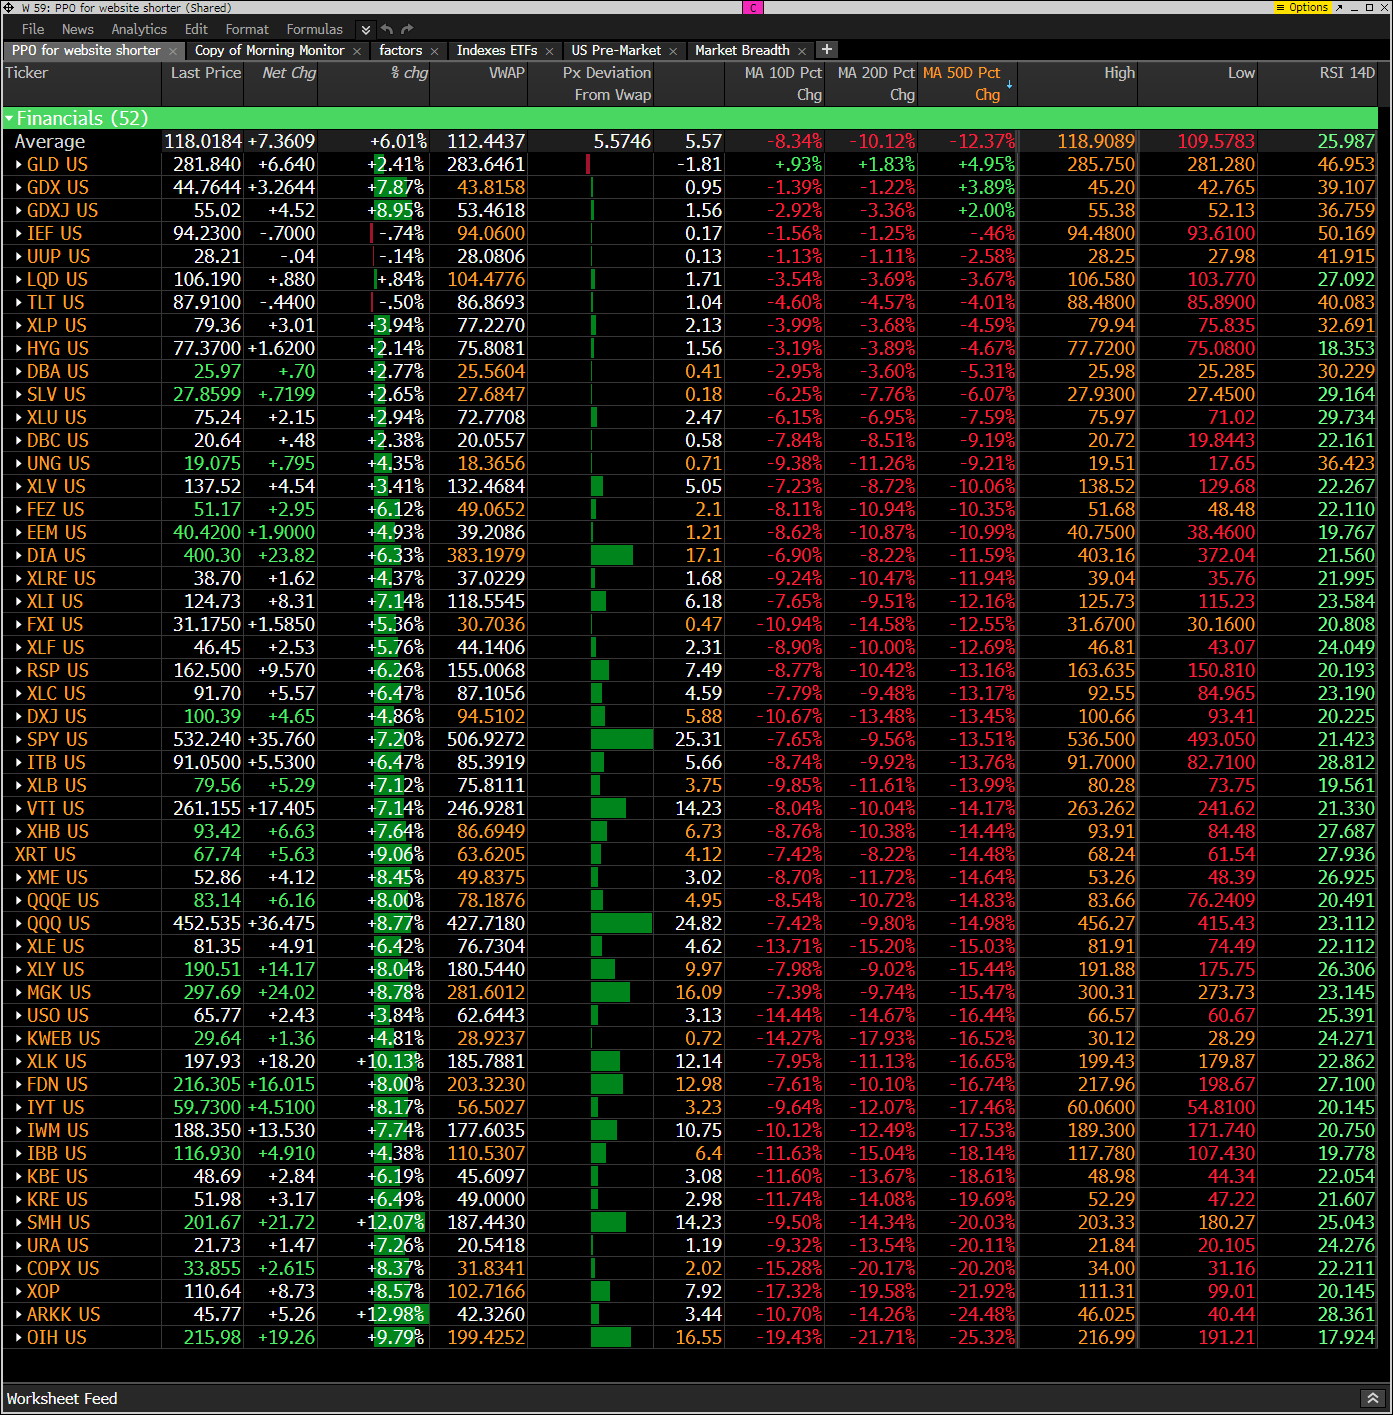
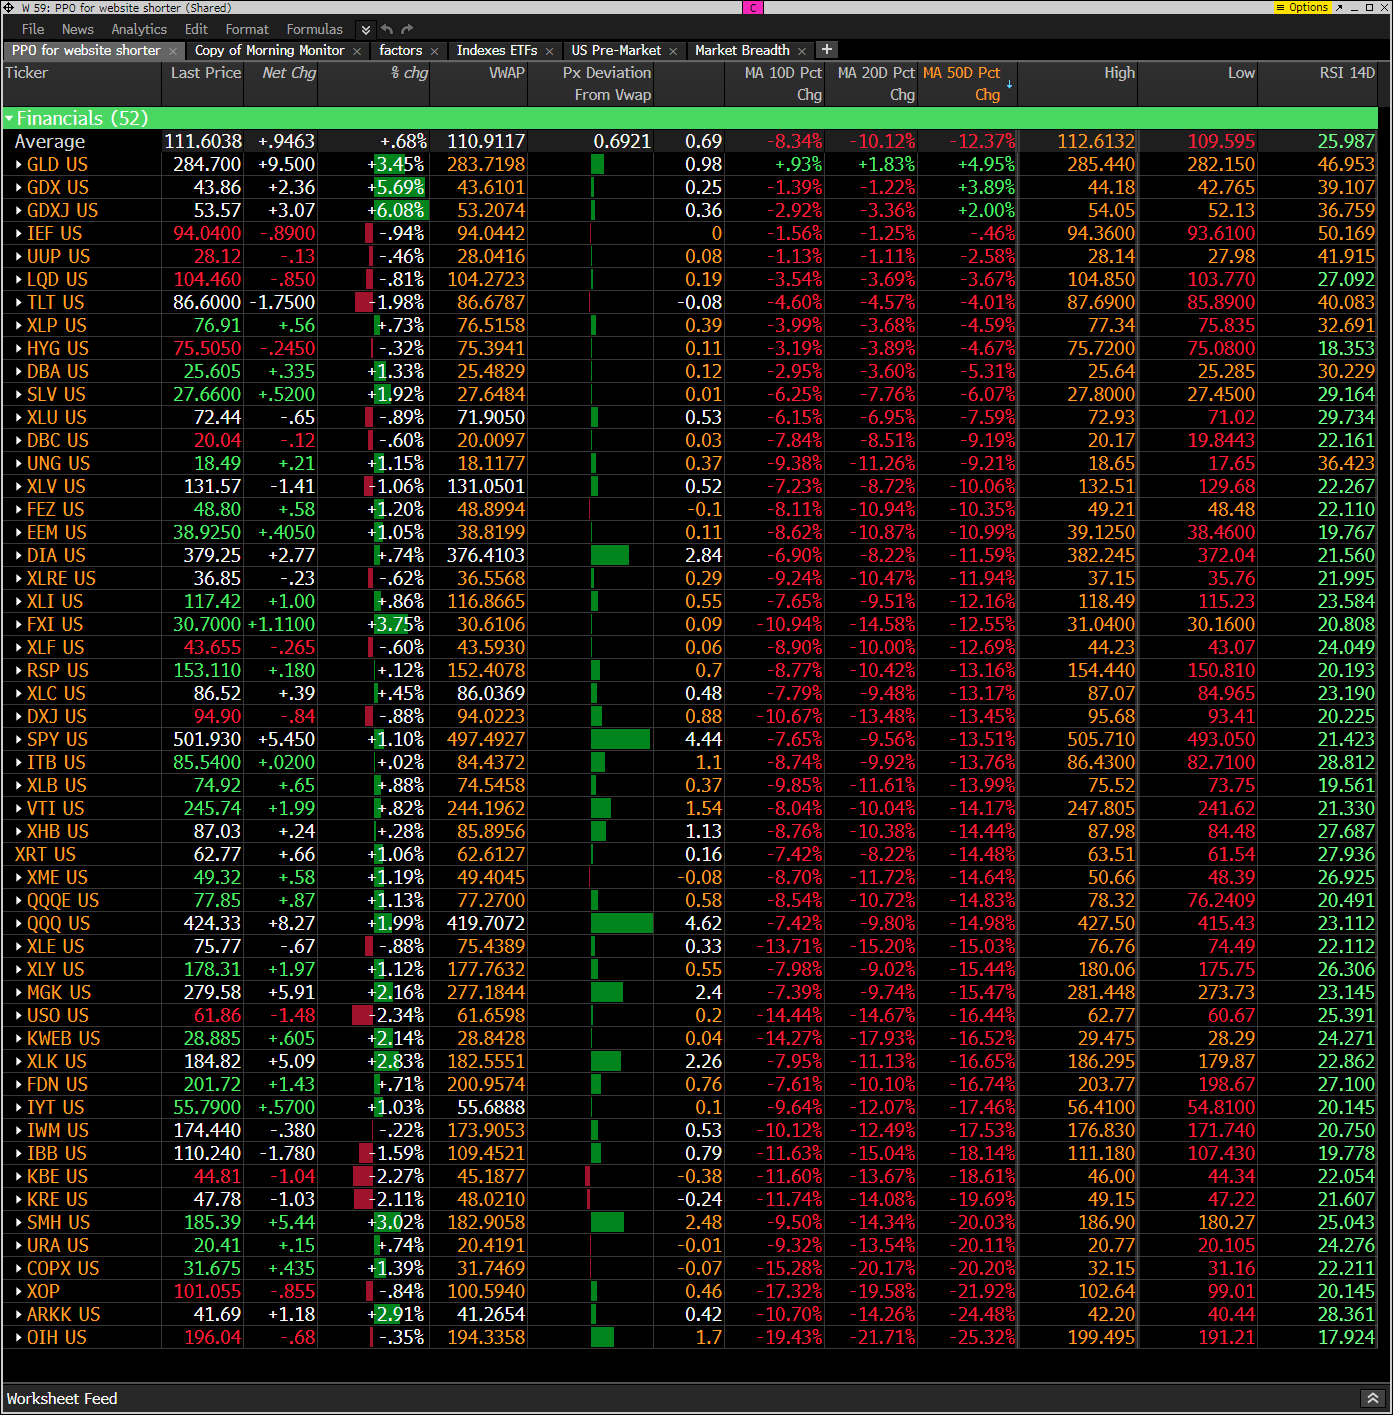
Hedge Fund Telemetry ETF Percentage Price Oscillator Monitor
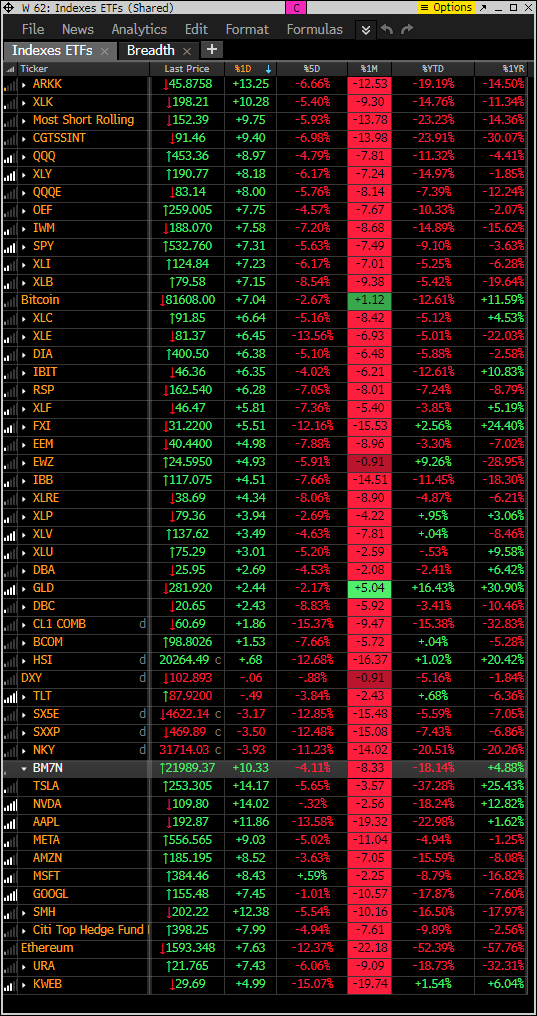
The PPO monitor (percentage price oscillator) force ranks ETFs by percentage above/below the 50-day moving average. For information on this monitor, please refer to this primer. This monitor and others are offered to Hedge Fund Telemetry subscribers on Bloomberg. Seeing more ETFs turn positive through the day and holding above today’s VWAP. The day isn’t over I know! (breaking news – here’s the after the tweet and before the tweet)
Index ETF and select factor performance
ETF with today’s 5-day, 1-month, and 1-year rolling performance YTD. Seeing some work higher with higher risk ETFs
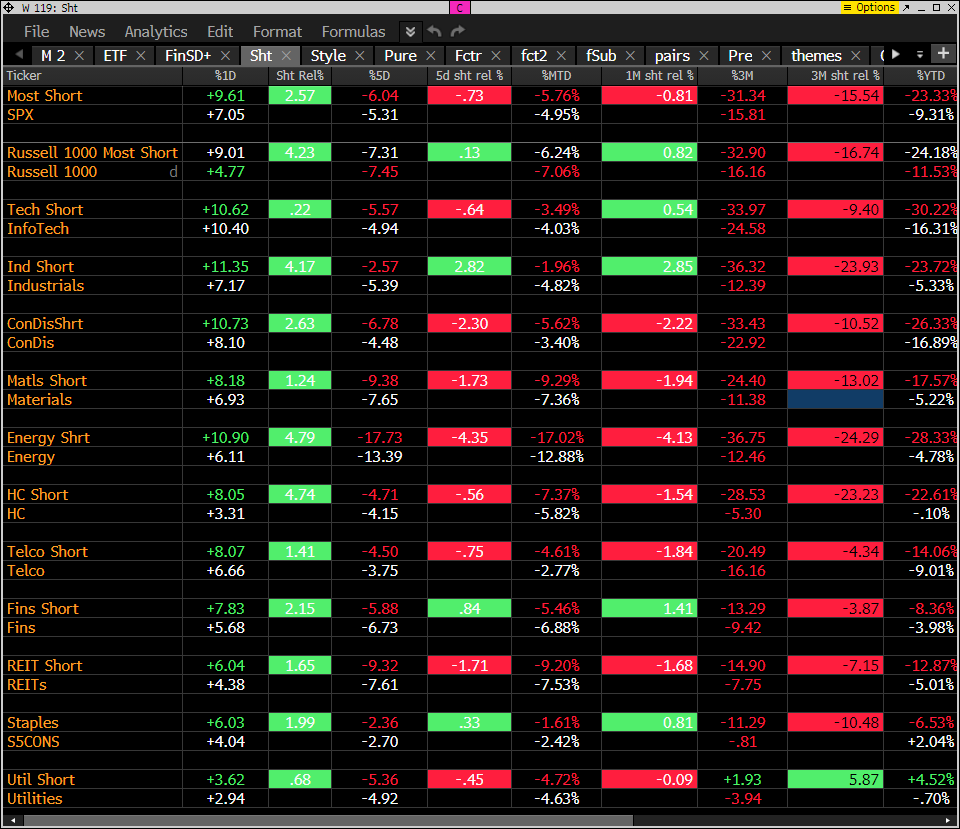
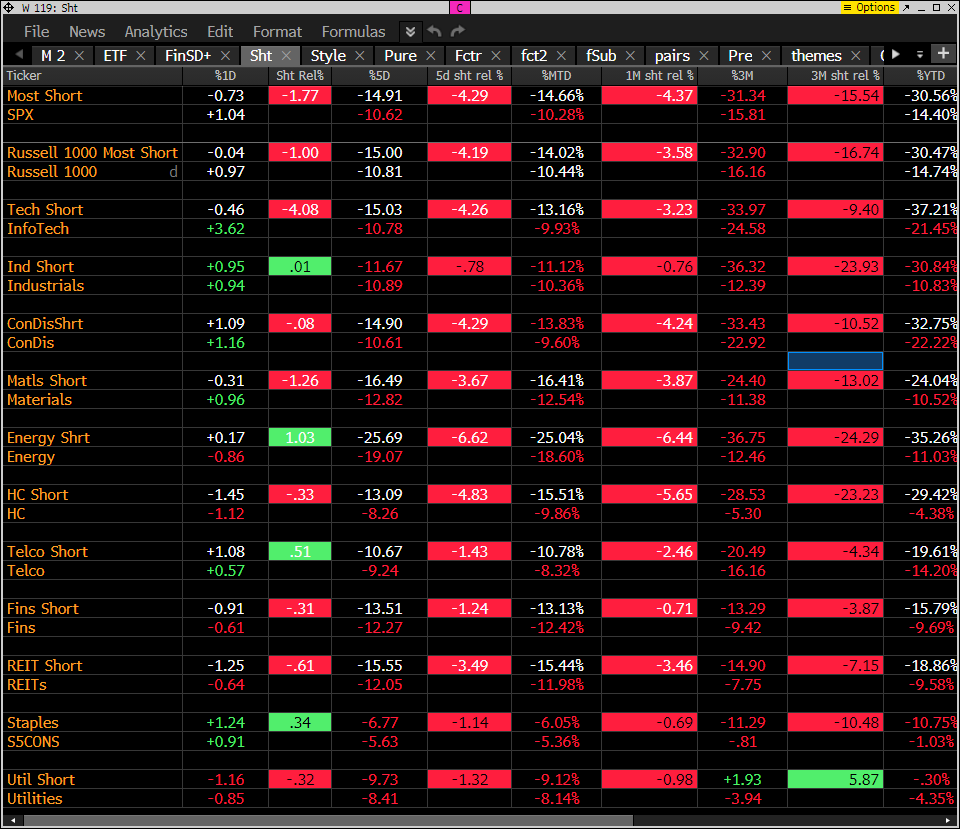
Goldman Sachs Most Shorted baskets vs. S&P Indexes
This monitor has the S&P indexes and the Goldman Sachs most shorted baskets. Not yet seeing covering across the board in the short baskets but the squeeze potential is there. This is post tweet and after! Covering squeeze!
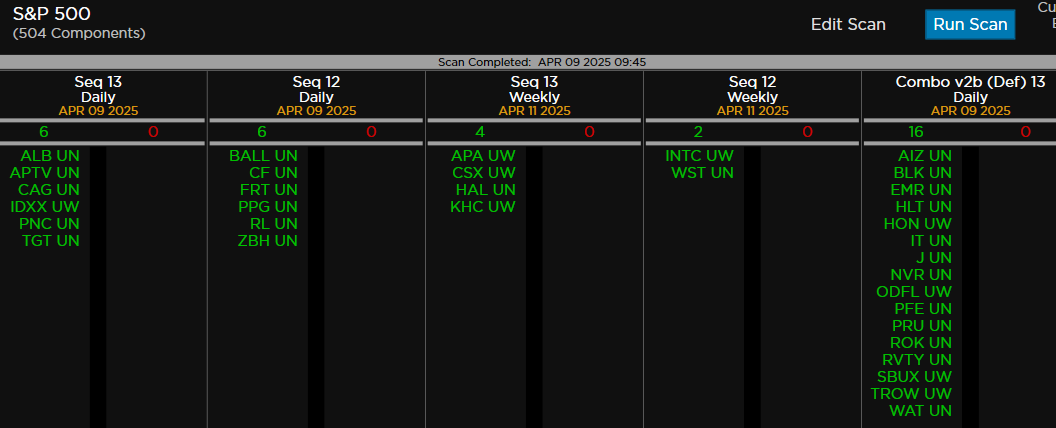
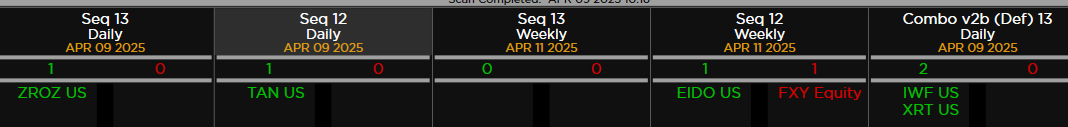
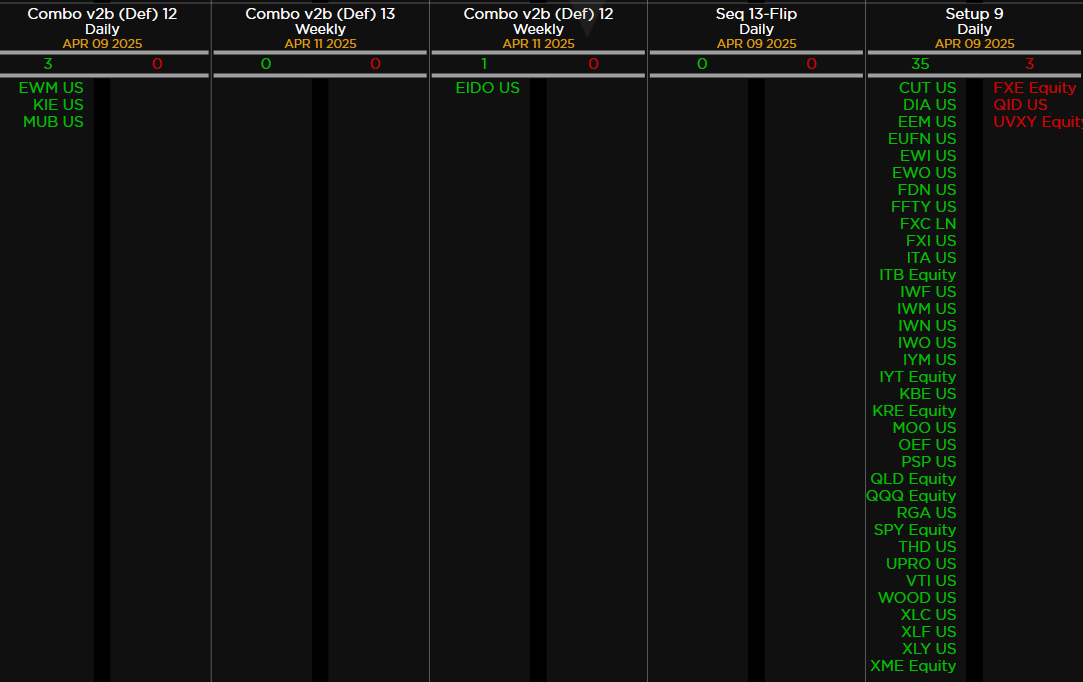
DeMark Observations
Within the S&P 500, the DeMark Sequential and Combo Countdown 13s and 12/13s on daily and weekly periods. Green = buy Setups/Countdowns, Red = sell Setups/Countdowns. Price flips are helpful to see reversals up (green) and down (red) for idea generation. The extra letters at the end of the symbols are just a Bloomberg thing. Worth noting:

Major ETFs among a 160+ ETF universe.
If you have any questions or comments, please email us. Data sources: Bloomberg, DeMark Analytics, Goldman Sachs, Street Account, Vital Knowledge, Daily Sentiment Index, and Erlanger Research