
Quick Market Views
Stocks: The S&P and Nasdaq 100 are higher due to the Mag 7 strength while the overall breadth is down. Both NYSE and Nasdaq are down ~900 issues each. The momentum might be getting a little tired while meme/momentum stocks continue to go higher. That might be a sign of narrow leadership again. Most of the ETFs on our monitor are down on the day. I’ve been raising cash on this bounce taking gains and some losses. PNL has been flat holding the 15% YTD gain. That is by design still with a net long positioning. I have a lot on this note including a look at WMT earnings preview, update on Point and Figure bullish percent charts and internals.
Bonds: The big risk remains rates breaking out and the 30 year is nearing 5%. I have the chart below of what I am watching.
Commodities: Mostly a down day. Grains are up small while everything else is lower. Crude down 0.4%, Natural Gas down 3%, Copper down 1.5%, Gold down 1.9%, Silver down 2.1%.
Currencies: US Dollar Index is down -0.15% off lows. Bitcoin is down 0.7%. I still believe the Dollar can rally from here.
Trade Ideas Sheet: A high level of cash reflects a cautious stance.
Changes: I will add 2% to each short: WING, UBER, ARKK, and 1% to TSLA (I will send a note focused on TSLA later). I will cover GLD with a gain but hold GDX short. I will add a new 2% weight short with FEZ Euro Stoxx 50 ETF.
Thoughts: I might have some more ideas on the next note. I believe the next 10% move is lower.
US INDEXES
S&P daily with Combo on day 11 of 13 with Sequential on day 5 of 13. Combo has been better at spotting tops and bottoms in the last year. Another couple of days of the golden age! ENJOY!

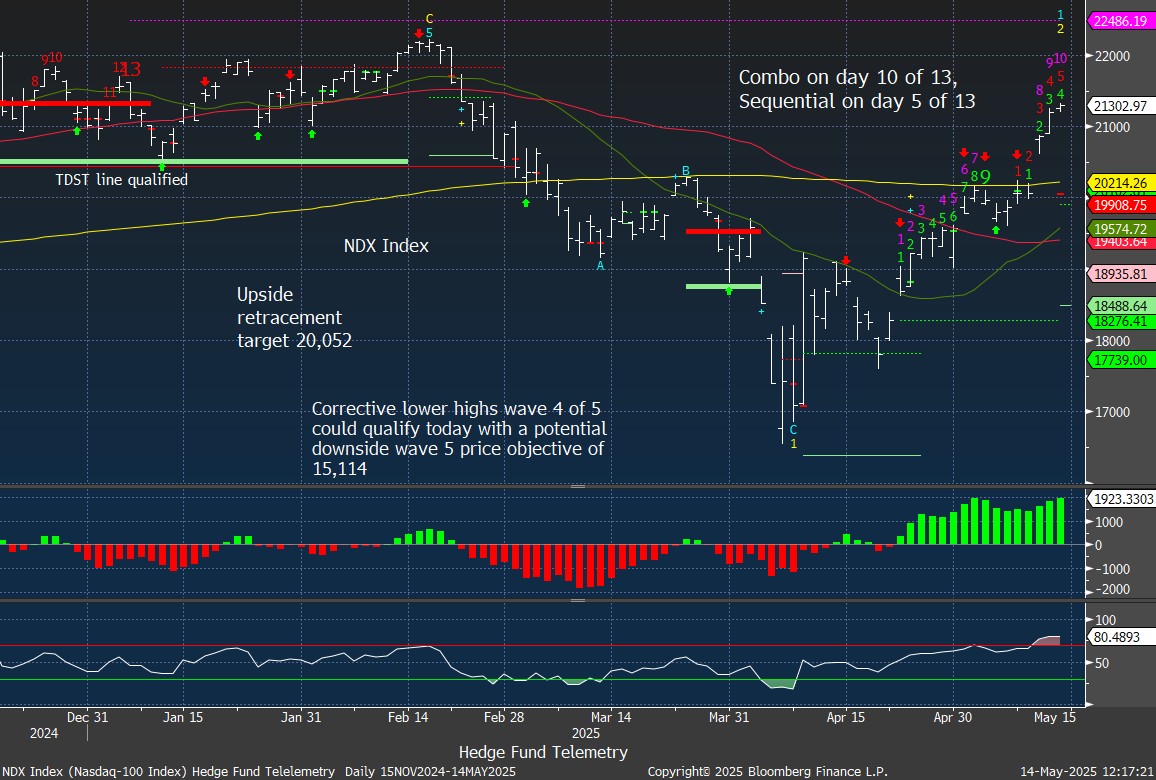
Nasdaq 100 Index daily on day 10 of 13 with Combo.
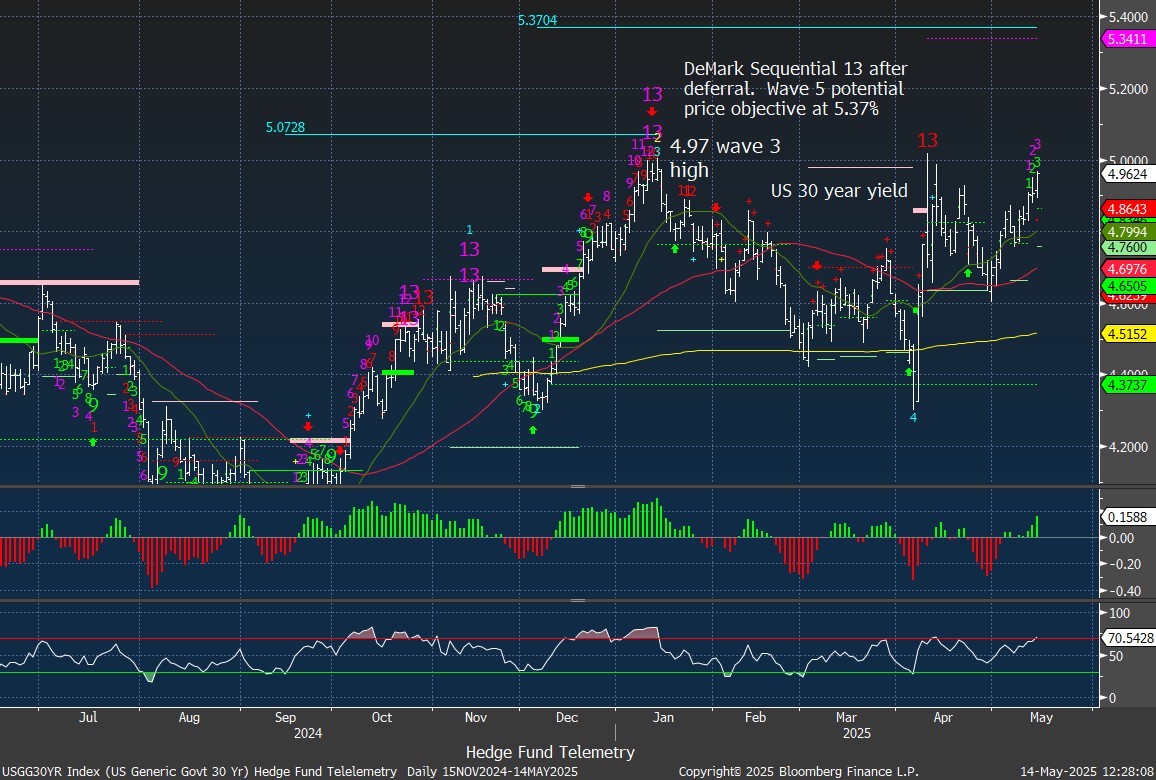
30 year yield nearing breakout
The US 30 year yield has risk of breaking out above 5%. This is a big macro risk that is top of my list right now. A close over wave 3 closing high of 4.97% would qualify wave 5 with a potential upside price objective of 5.37%
Trade Ideas Sheet
Pre changes

SPY and QQQ short term momentum remains on a buy after the gap up. Some small hook on the top earlier indicator but no change yet. Best case would be stalling to see turn then lower vs gaps which makes it difficult.

PG with a price flip up today. A move over the 20-day at 161.81 would add to the confidence of a durable bounce. A “price flip” is defined as a contra-trend move identified by a close that is higher/lower than the close four price bars earlier.

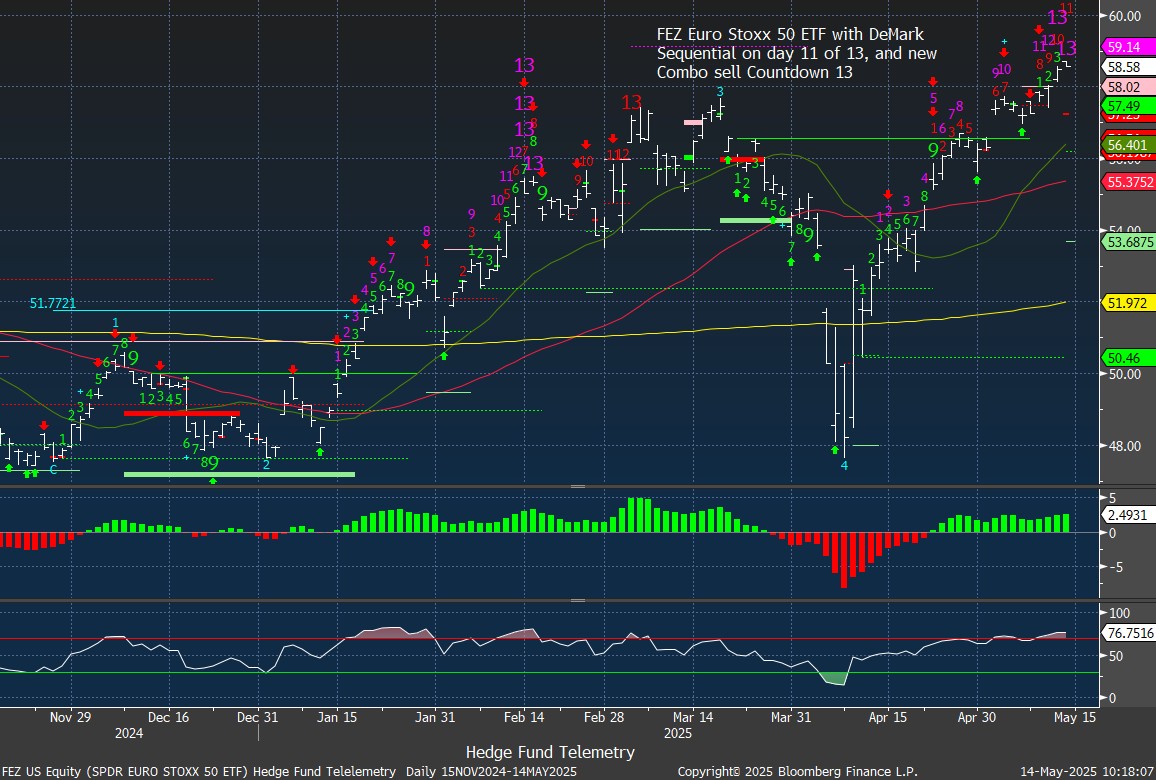
FEZ Euro Stoxx 50 ETF has new Combo 13’s (several versions) with Sequential on day 12 of 13. I am adding a 2% short weight today. This was a recent short that worked out well. Let’s try it again
VXUS is an ETF with ex US international stocks. It’s stretched and might sync well with the other big indexes recently with Combo and Sequential sell Countdown 13’s – Germany, Italy, Korea, UK

GDX Gold Miners continues lower. I have taken some gains on the way down and will hold what I have currently short 2%

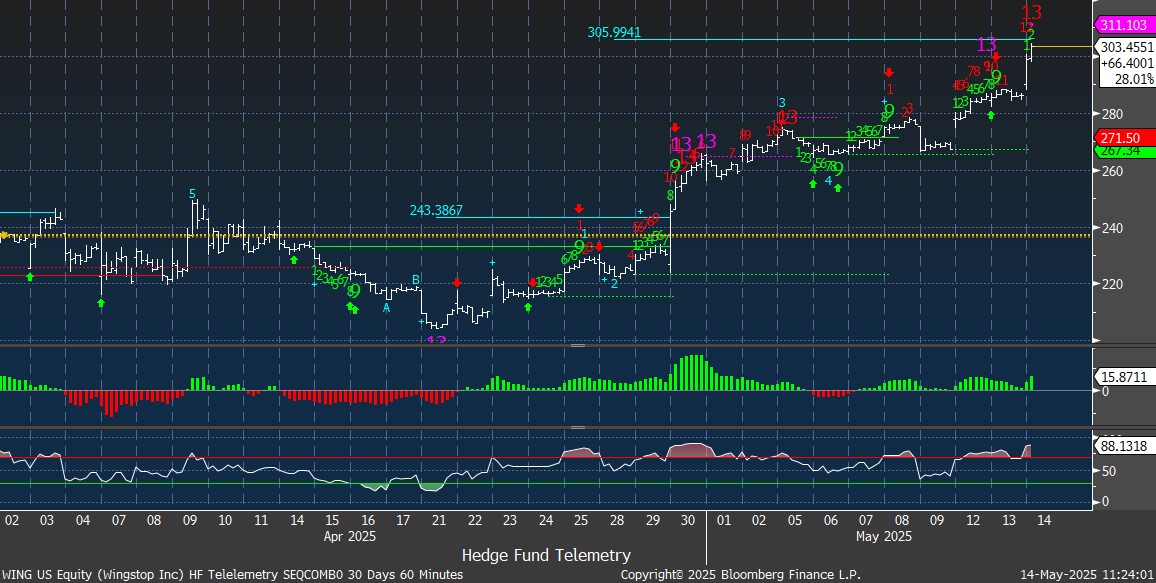
WING is a short that is underwater. Chicken wings! It’s stretched with Combo on day 12 of 13. I will add to this one as the earnings were not that good but hey, I’m told they are using AI to determine when to cook the wings. Nearly at 80x PE
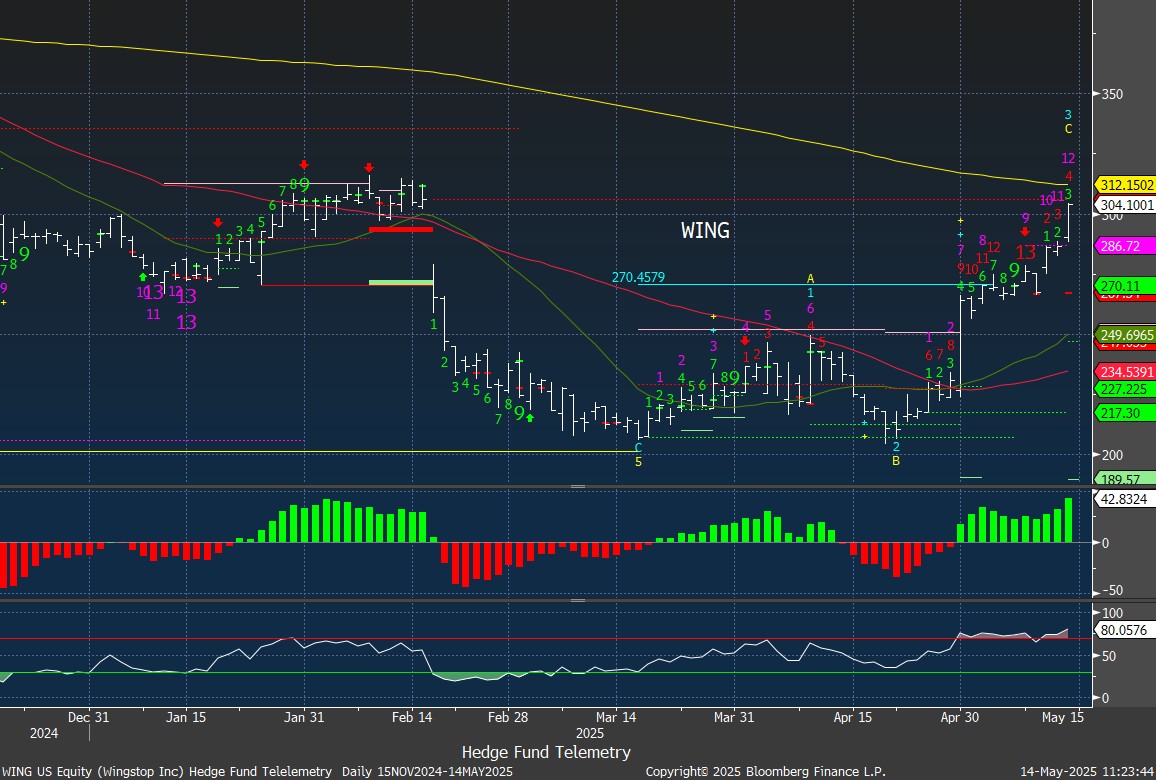
I noticed the short term 60 min on WING is getting to wave 5 with new Sequential 13
walmart preview
WMT (Walmart) FQ1 earnings preview (reports Thurs 5/15 before the US open) – the company held an analyst meeting back on Apr 9 and largely reaffirmed its FQ1 and FY outlook at that time, and it’s likely the guidance is reiterated once more on 5/15 (the fact the Apr 9 update occurred right after Trump’s Apr 2 Rose Garden bombshell is somewhat comforting in that conditions since then have stabilized and even improved a tiny bit). Walmart is benefiting from its massive size in the current environment, leveraging its enormous breadth and market power to keep prices low and gain market share. For FQ1, the Street is looking for EPS of 59c w/US Walmart comps +3.95%, Sam’s Club comps +4.8%, and GMs of 24.29%. Thanks Adam at Vital Knowledge!
WMT has recently slipped as the indexes moved higher after the tariff de-escalation. It’s a little odd since WMT would benefit with lower tariff rates, but still 30% for China is a big number for a margin-sensitive business, along with a consumer that has been stretched. Considering they preannounced last month the only risk is that they downtick small on guidance tomorrow. The chart looks better as a short however I’ll sit this one out with the risk of high short interest and forgiving market if they said they were withholding guidance which also might happen. This could be a big tell for whole market being that it is the largest retailer!
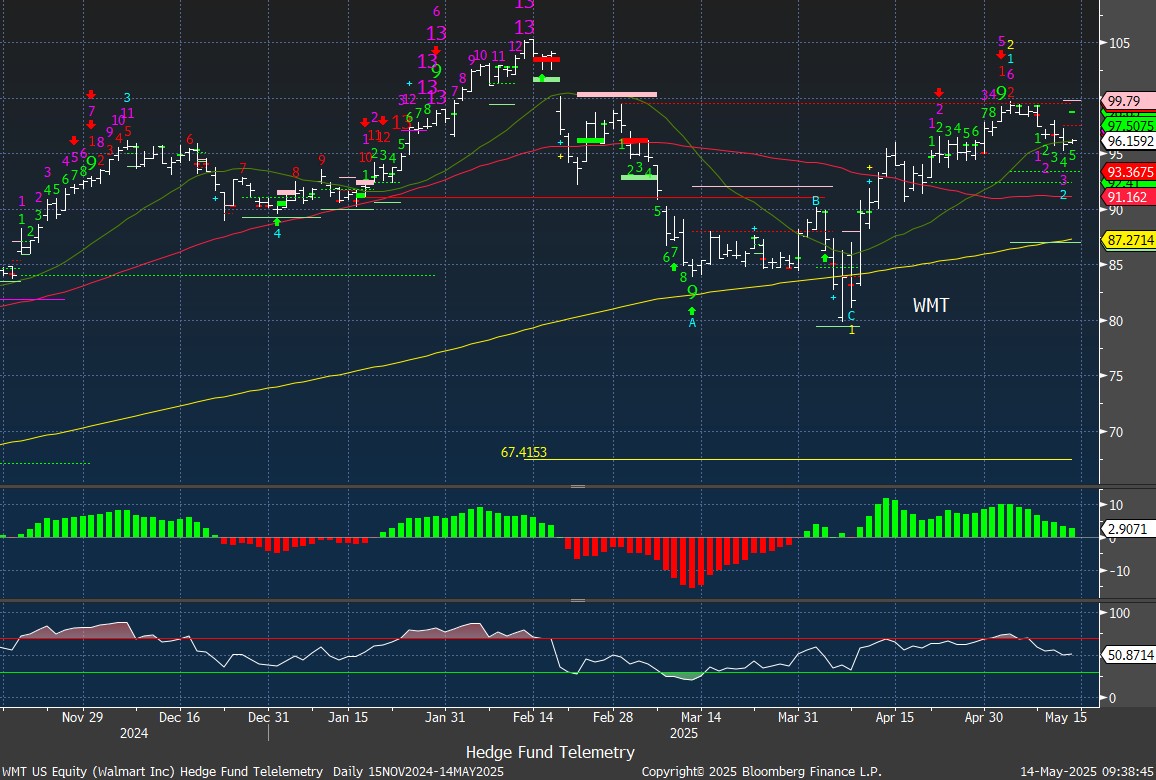
The implied move is 5%

Short interest is elevated with 2.65 days to cover. As it dropped in March, there was heavy put buying on the Options Rank illustrated with the green dots.

bullish percent indexes and internals update
The old school point and figure bullish percent indexes that I show on occasion are now back into overbought territory. In April at the lows I showed this and was a good indicator that gave us confidence to shift to the long side. I can’t recall a wire to wire move like this and I’ve used this for 30 years! Some moderation or pullback is due. Here’s a primer on point and figure bullish percent indexes.


The advance decline data was oversold in April which was one indicator that gave us confidence to add longs. It recently has moved into overbought territory with small negative divergences (index new high with slight lower levels on the AD data.

In April the 5 day moving average of equity put call ratio moved higher but not extreme with heavy put buying and now it’s dropping with heavy call buying. It’s hard to chase with this much heavy call buying.

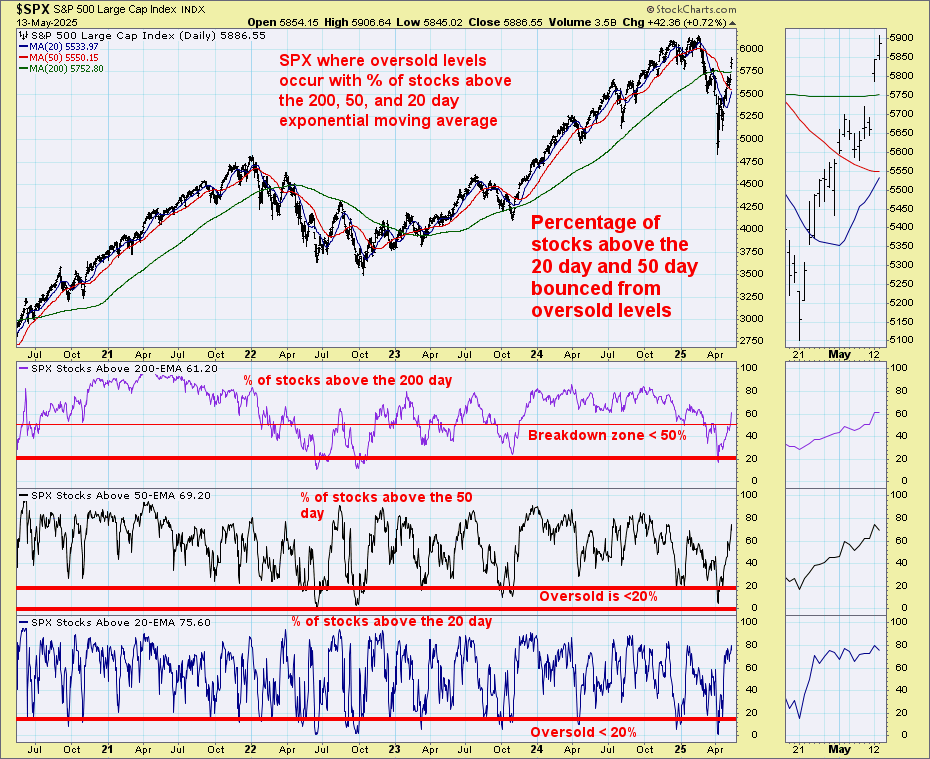
The percentage of S&P stocks above the 20, 50, and 200 day were oversold in April which was a great buying opportunity. Currently the 20 day and 50 day data is getting back to overbought levels.
S&P with McClellan indicators bottomed in April and moved higher. A little divergence with Oscilator and AD line but summation index still bouncing.

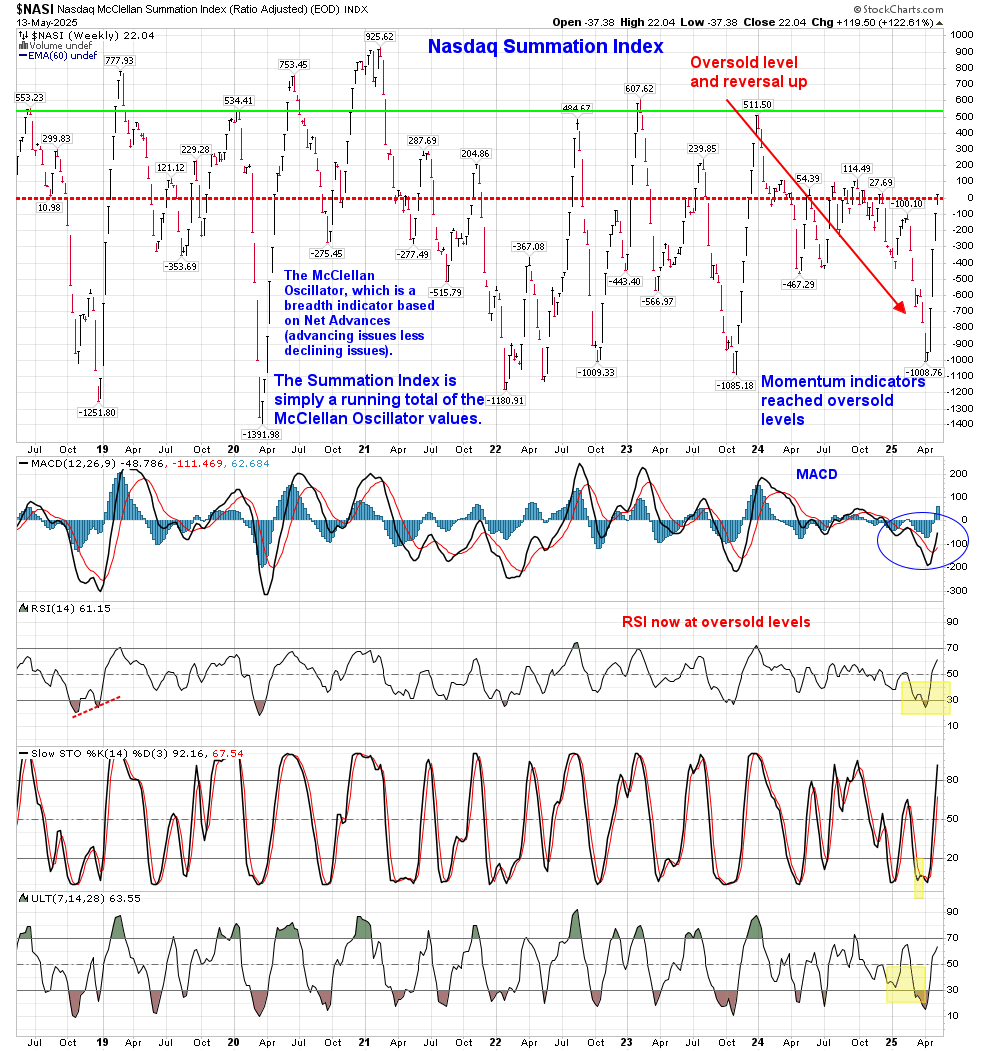
Nasdaq 100 similar to the S&P with the Summation index at the highs seen all last year.
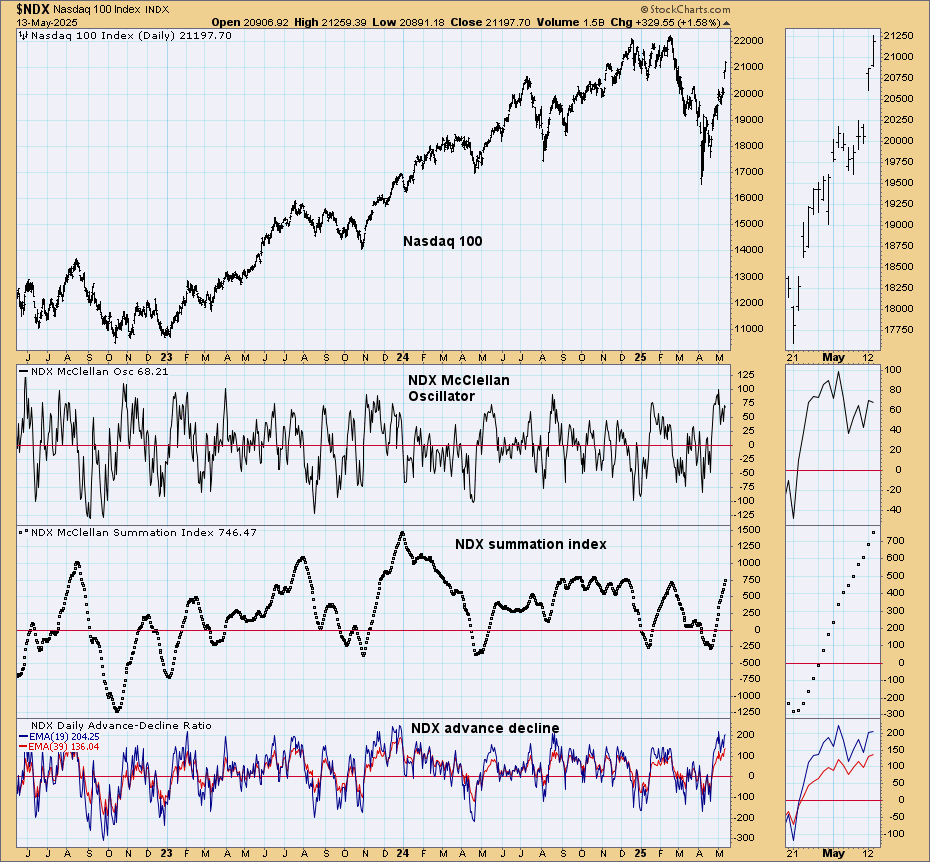
The Nasdaq Summation weekly has moved straight up for 4 weeks now. Not oversold but this week not up as much as the previous 3 weeks. Something I’m watching.
Hedge Fund Telemetry ETF Percentage Price Oscillator Monitor
The PPO monitor (percentage price oscillator) force ranks ETFs by percentage above/below the 50-day moving average. For information on this monitor, please refer to this primer. This monitor and others are offered to Hedge Fund Telemetry subscribers on Bloomberg. More narrow gains today focused in tech. China and Uranium doing OK.

Index ETF and select factor performance
ETF with today’s 5-day, 1-month, and 1-year rolling performance YTD. Narrow leadership today.

Goldman Sachs Most Shorted baskets vs. S&P Indexes
This monitor has the S&P indexes and the Goldman Sachs most shorted baskets. Seeing some squeezing in tech, industrials but not in other indexes.

DeMark Observations
Within the S&P 500, the DeMark Sequential and Combo Countdown 13s and 12/13s on daily and weekly periods. Green = buy Setups/Countdowns, Red = sell Setups/Countdowns. Price flips are helpful to see reversals up (green) and down (red) for idea generation. The extra letters at the end of the symbols are just a Bloomberg thing. Worth noting: A little quiet with a few sell signals developing. PG with price flip up. Needs follow-through

Major ETFs among a 160+ ETF universe. FEZ with new Combo sell Countdown 13

If you have any questions or comments, please email us. Data sources: Bloomberg, DeMark Analytics, Goldman Sachs, Street Account, Vital Knowledge, Daily Sentiment Index, and Erlanger Research