
I’ve now shown the sentiment data for equities in the extreme zone, with many DeMark Sequential and Combo sell Countdown 13’s developing, and some with secondary extended Countdowns that may also reach 13. Today, I analyzed a select number of stocks based on their current price-to-earnings ratios. The S&P price-to-earnings ratio is now trading at 23.5x, which isn’t as high as it was at the peak late in the year after Trump’s election.
However, at this level, it’s not overly favorable, as price has been rising faster than earnings. That’s multiple expansion, and something needs to catch up or catch down. Either earnings need to accelerate to justify the high multiple, or the price comes down to a more reasonable level. In this current speculative retail-driven market, I’d take 20x as a decent valuation. When you look at the charts below, the ratio spikes higher, indicating a strong and, in my view, unsustainable multiple expansion. One of the notable features of these charts is that the DeMark indicators overlaid have identified tops and bottoms in P/E ratios. Lastly, many will say never short valuation, and I understand that; however, when this line up with other indicators and sentiment extremes, the elevated valuations make the market more vulnerable to a downside.
Quick Market Views
Stocks: I’ve been asked why stocks are up today, and I believe it’s due to continued momentum on very low volume – perhaps a seller’s strike. Most people find a better reason to sell when things are going down. Breadth is solid, with the NYSE up 2,400 issues and the Nasdaq up moderately, by 1,300 issues. Short baskets are leading on the upside again now, with the GS most shorted basket up 15.5% vs the S&P up 3.8% month to date.
Bonds: Rates are down with 2’s down 6bps, 10’s down 4bps, and 30’s down 1bps. The 2/10 spread continues to steepen at 53bps.
Commodities: Mixed with Crude up 0.85%, Natural Gas down 4.25% (the heat wave ended in NYC area but will get hot next week). Grains lower, Copper up 2.8%, Gold flat, Silver up 1%. Coffee is getting closer to downside exhaustion and a bounce.
Currencies: Dollar Index down 0.5% hitting a new low. Bitcoin is flat.
Trade Ideas Sheet: Despite many shorts lifting, some are lower today the PNL is down about 20bps to 16.9% YTD vs SPX +4.4%
Changes: None. I will hold MU which as Jordan Klein said on his preview it was a tell on semiconductors. It’s fading down 2% as expectations were high and earnings and the guide was good. This might be a bigger tell heading into the Q2 earnings season as the good news could be priced in to a lot of things as well the bar is now very high.
Thoughts: i have shifting more short as I can work with the big gain I have over the indexes. I’ve kept most of the shorts with limited weight and look to add to some of them as things reverse. The default suggested stop is 5% and many are past them. On the new site I plan on having a more dynamic system. With a market that is as volatile on the upside and downside I’ve kept the ideas as I expect them to work or at least move lower which will benefit the overall PNL.
US INDEXES
S&P SPY 60-minute tactical time frame with new Sequential and Combo 13’s

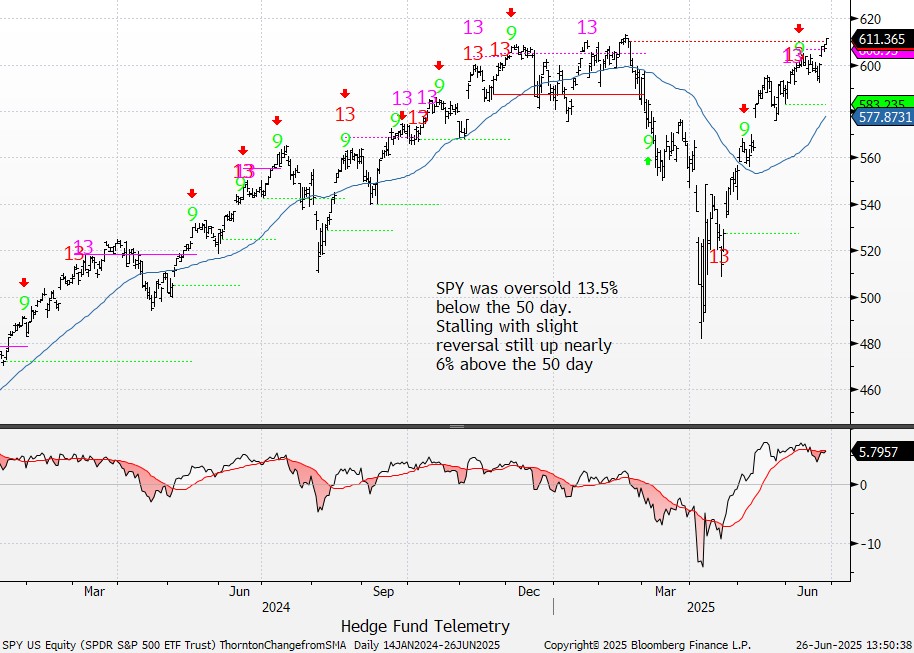
S&P 500 SPY daily is now about 6% above the 50 day historically elevated
Nasdaq 100 QQQ 60-minute tactical time frame with new Sequential and Combo sell Countdown 13s

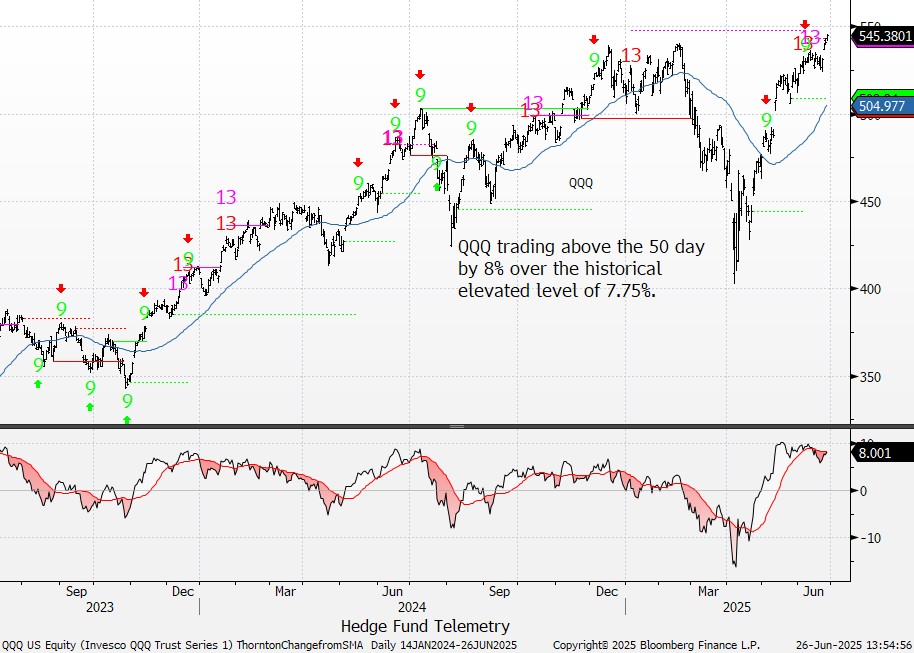
Nasdaq 100 QQQ daily is 8% above the 50 day at historically elevated levels.
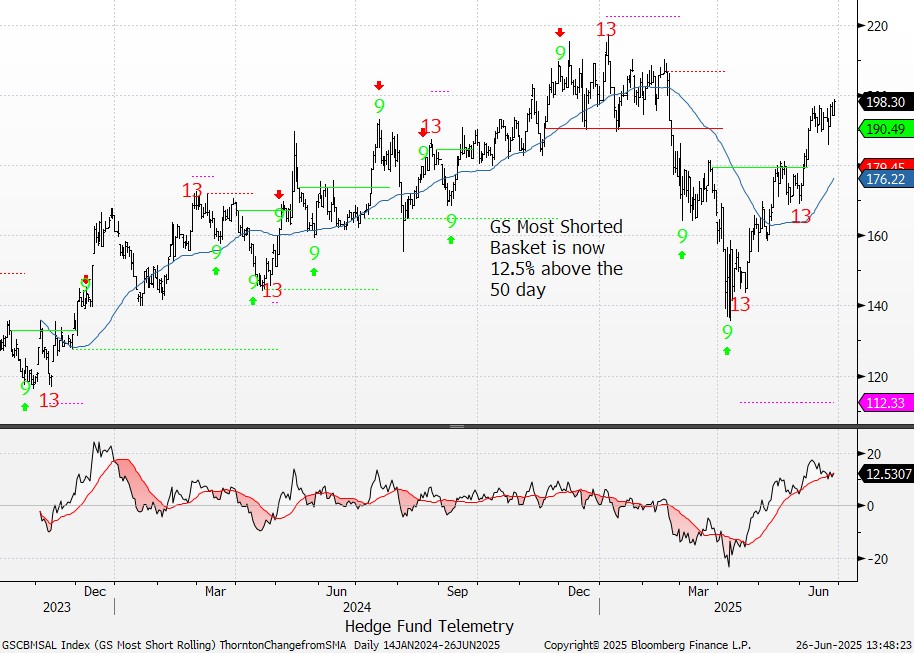
The GS most shorted basket is now 12.5% above the 50 day and only was higher back in December 2023 which was a decline shortly after that peak.
VIX Index dropped enough to qualify the Combo 13 following the recent Sequential 13

Trade Ideas Sheet

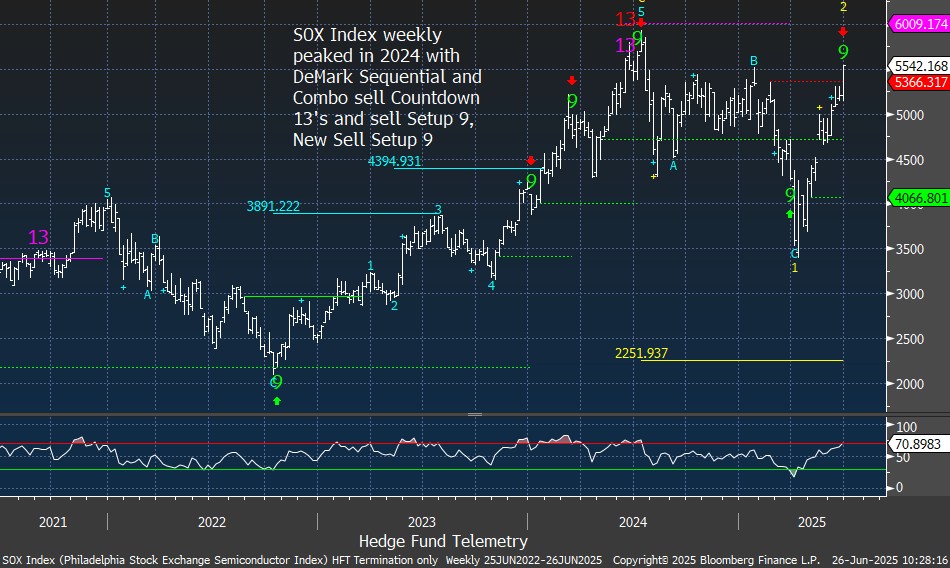
SOX Index Semiconductors daily with new Sequential 13 and Combo in play with elevated RSI. Weekly sell Setup 9.

MU is down today after good earnings with a cluster of a bunch of sell Countdown 13’s

AA Alcoa is one of my favorite names on the long side and it’s starting to breakout

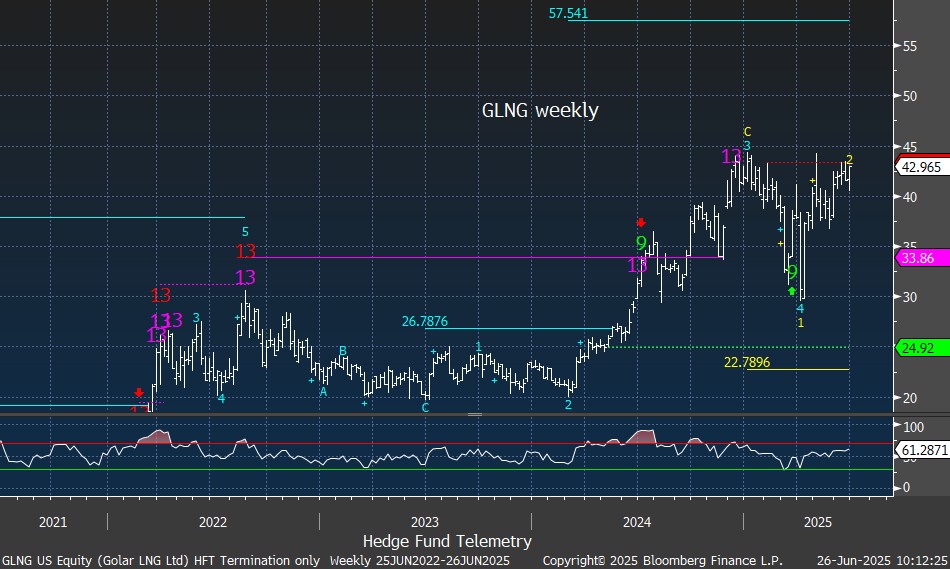
GLNG Golar remains a large long position and it’s lifting again towards the peak levels. A new buyback might help this breakthrough. Daily has a wave 5 target of 45.81 and the weekly at 57.54

I sold BABA long yesterday partly to add to short exposure and the pending Sequential on the downside. I would like to add this back around 100

bull market for multiple expansion
S&P 500 P/E is at 23.5x up from around 19x. This isn’t terrible but when you see the names that lifted the index there is real risk of a market drop.

TSLA is trading at 175x earnings and earnings are expected to be below 2021 levels. I could see this trade well over 200x unless price declines. With a $1 trillion market cap there is a lot of hope in this that could be uncovered as just that “hope”

NVDA at 36x is back to levels where it peaked. One of the reasons I bought this was that it was trading nearly at 20x

AVGO at 40x with multiple expansion steep

AMD was one that shook me out and the move from the teens to now 36x.

MSFT has moved from 28x to 37x and despite decent earnings the price has moved much further expanding the multiple.

AAPL has declined 20% YTD and at the highs it was trading at 35x earnings and I whined about how expensive it was with very little growth. It still might be overvalued as I like it more at 25x

NFLX trades at 50x. The average PE in media is half of this

PLTR at 250x earnings but people say “is one of the fastest growing companies in the market” The price to sales is 110x also the highest in the S&P. Nearly a $350 billion market cap and 2025 revenue estimate is $3.9b. You’re reading that right.

COIN at 70x is very high and up from 50x in the last week.

CAT at 20x earnings is elevated considering they guided down and flat YoY

Hedge Fund Telemetry ETF Percentage Price Oscillator Monitor
The PPO monitor (percentage price oscillator) force ranks ETFs by percentage above/below the 50-day moving average. This monitor and others are offered to Hedge Fund Telemetry subscribers on Bloomberg. Everything is wonderful

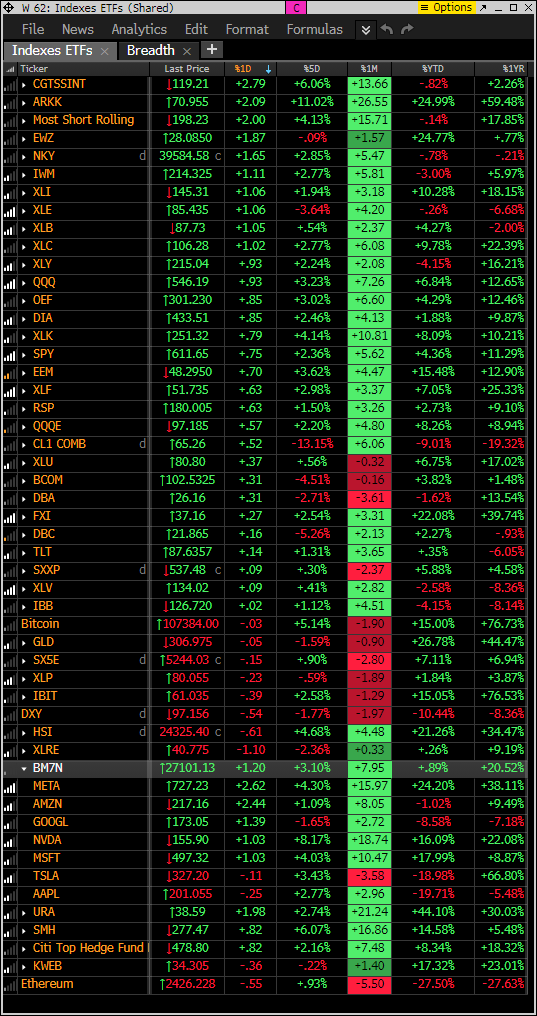
Index ETF and select factor performance
ETF with today’s performance with 5-day, 1-month, and 1-year rolling performance YTD. Most shorted baskets and ARKK leading. IWM Russell 2000 correlates with the most shorted baskets.
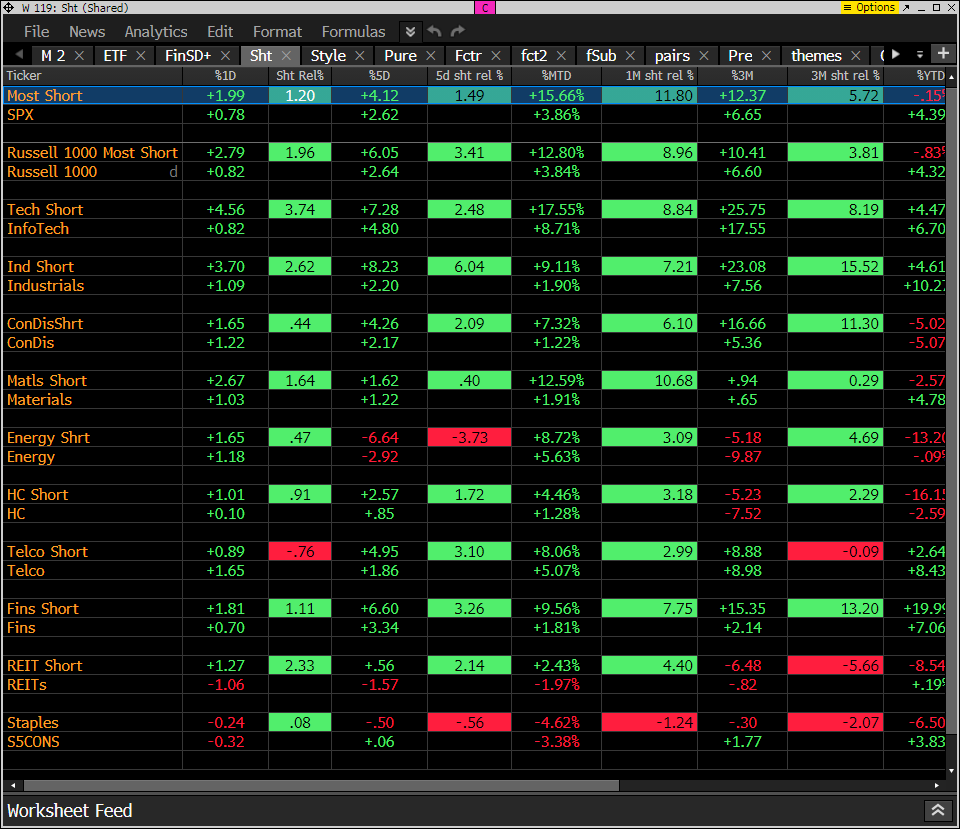
Gs Most Shorted baskets vs. S&P Indexes
This monitor has the S&P indexes and the Goldman Sachs most shorted baskets. Short baskets continue to lift more than indexes
DeMark Observations
Within the S&P 500, the DeMark Sequential and Combo Countdown 13s and 12/13s on daily and weekly periods. Green = buy Setups/Countdowns, Red = sell Setups/Countdowns. Price flips are helpful to see reversals up (green) and down (red) for idea generation. The extra letters at the end of the symbols are just a Bloomberg thing. Worth noting: Still plenty of sell Countdown 13’s developing.

Major ETFs among a 160+ ETF universe.

If you have any questions or comments, please email us. Data sources: Bloomberg, DeMark Analytics, Goldman Sachs, Street Account, Vital Knowledge, Daily Sentiment Index, and Erlanger Research