
In the history of stock markets, they top when the backdrop is good news and bottom when the backdrop is bad news. Nvidia’s earnings were great, yet the stock reversed its gains, taking the market down with it. Some people might wonder why, but it’s simply because people have been all in, crowded, and levered into the same stocks while feeling supremely confident and complacent. The Nvidia CEO was asked if there was an AI bubble, and he said, “There’s been a lot of talk about an AI bubble. From our vantage point, we see something very different.” OK, I guess. That’s like asking a dot-com founder in 1999 if valuations make sense: “Absolutely. We’ll monetize eyeballs… later.” Or asking a housing speculator in 2006 if real estate can crash: “Crash? Houses can’t go down. They’re made of land.“ Or perhaps the more obvious, asking a bartender if drinking is a problem: “Alcohol problem? Nah, buddy, it’s just liquid networking.“ (disclosure, I did not ask the bartender at Ernie’s, our local dive bar)
Markets don’t go straight down; there are always bounces, some rather sharp, as everyone wants to catch the bottom. I envision a similar situation that is happening now. Back in the tech bubble, there were numerous bounces with the same believers, thinking they were seeing something different… each time.
What can be crossed off the list of positive catalysts is the Nvidia earnings report. Q3 earnings are now done with only GOOGL out of the Mag 7 higher after earnings – AAPL and NVDA are close as I go to print. They were supposed to lead the markets to new all-time highs. Other catalysts, such as the Fed cutting rates, the Trump/Xi meeting, trade deals, and the government shutdown ending, didn’t get the desired response. Absent any other major catalysts, I don’t know what will propel the markets higher. I suppose people will be hoping for another Fed rate cut in mid-December.
Equity market sentiment has been steadily holding in the elevated-to-extreme zone for months. That is what it is supposed to do, especially with the major indexes holding above the 50-day for 139 days, but it started to break down at 50% two days ago, and today’s action will likely knock it lower. It’s a bit unique: the 20-day moving average of bullish sentiment is still at 70%, while decent bottoms have the 20-day moving average of sentiment well under 50%. In other words, this is unlikely to be a one-off day as sentiment is shifting. This is a very valuable indicator to monitor right now.
Quick Market Views
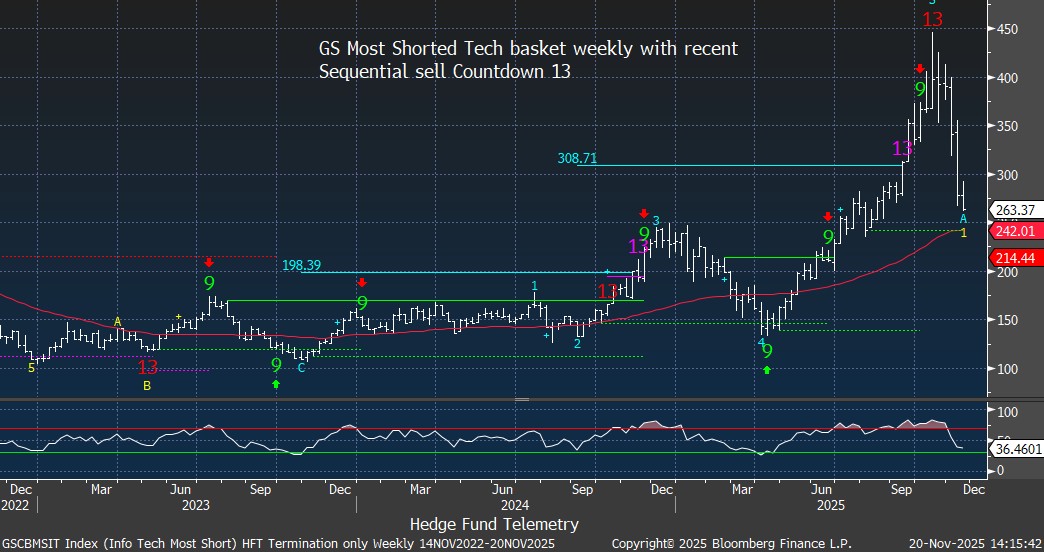
Stocks: Besides the index move breadth moved from +2500 on both the NYSE and Nasdaq to now NYSE down 1825 net issues and Nasdaq down 1500 net issues. Consumer Staples sector is up 1% (thanks to WMT uggg) and the recent DeMark Sequential buy Countdown 13. REITs are flat, while the major sectors are Tech -2%, Industrials -1.5%, and Consumer Discretionary down 1%. Short baskets are down hard with the GS most shorted tech basket down 3% and now only up 20% YTD after recently being up 100%.
Bonds: Rates are down 3-4bps after the mixed jobs data. Perhaps more of a risk off from equities move?
Commodities: Weakness. Natural Gas is down 1.5%, Crude down 0.3%, Grains down, Copper down 1.3%, Gold down 0.6%, and Silver down 1.7%
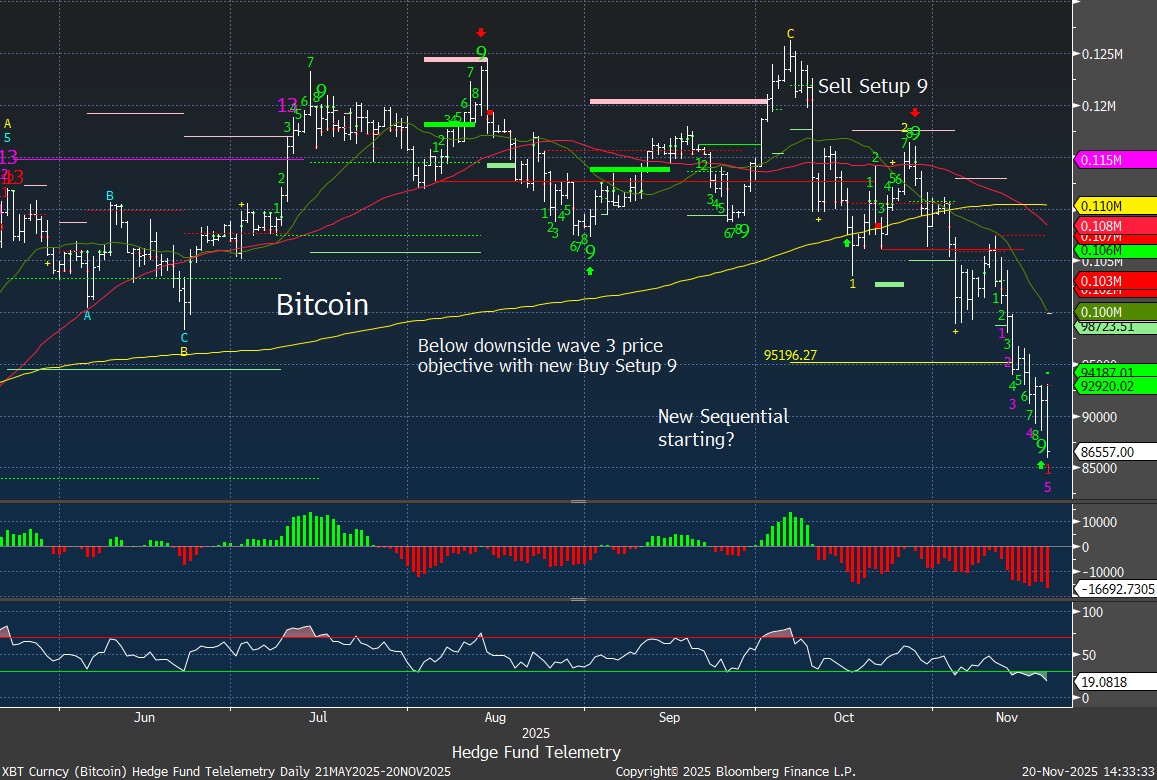
Currencies: US Dollar Index little changed. Bitcoin and other crypto are not little changed with Bitcoin down 6% breaking down with a potential new Sequential Countdown starting as I have discussed.
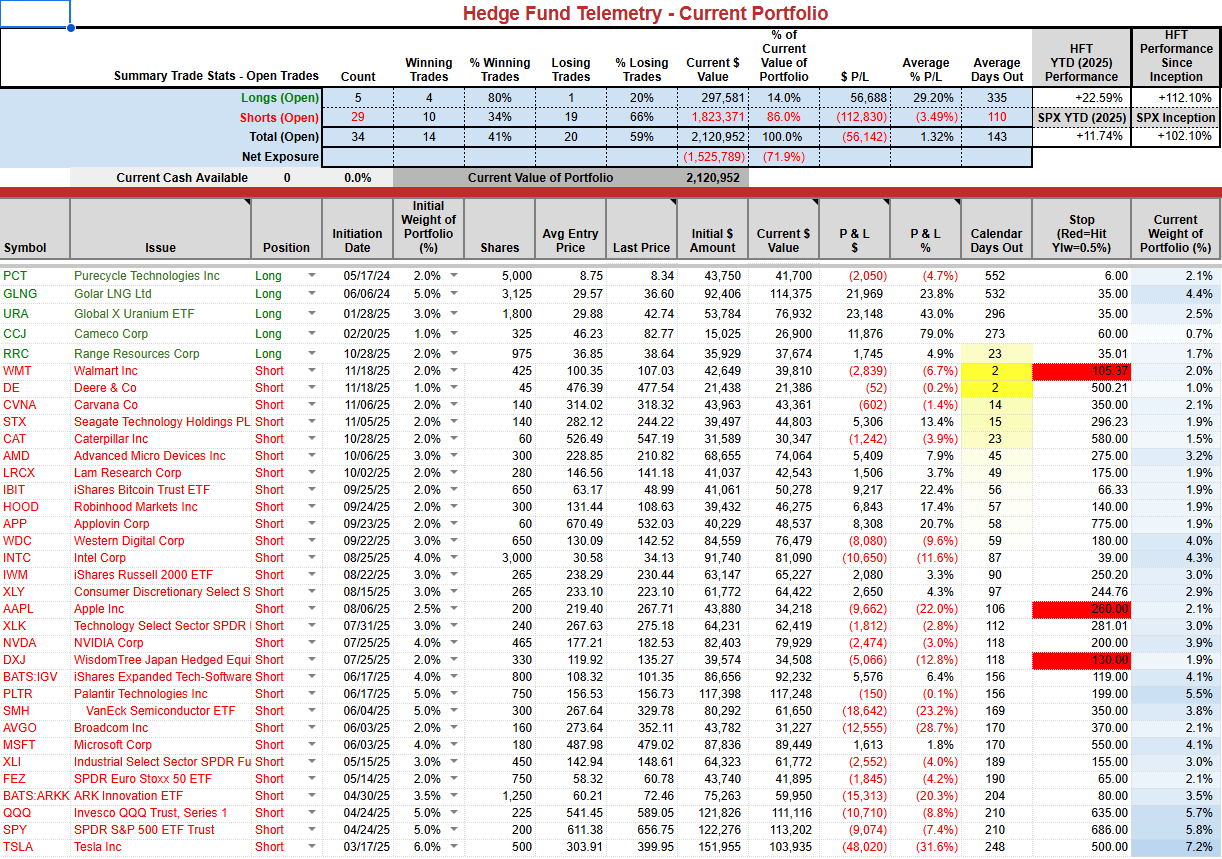
Current Portfolio Ideas: Strong PNL day with new YTD high water mark. 22.6% vs S&P 11.75%
Changes: The short term SPY and QQQ momentum nearly turned to buy but remains on sell. Using two indicators with one being more of a confirmation helped prevent a whip. I will cover/trim and take profits on a few shorts: MSFT take it all off +2% (it was a struggle) Reduce to 2% from 3%: AMD +8%, IWM +3.4%, XLY +4.5%. Reduce to 2% from 4% IGV +6%.
Thoughts: I’ve mentioned before how some of the shorts in the portfolio may not get to cost. Some will, and some that were unprofitable are now moving into profitability. Those that don’t might continue lower, which ultimately helps the PNL gain. I could cover some things today; however, I will follow the indicators and sentiment and endure some bounces. As always manage risk for you as everyone has different time frames and risk tolerances.
Just heard a commercial for Public, a brokerage firm trying to appeal to those not looking to speculate like a degenerate gambler. Respect


US INDEXES
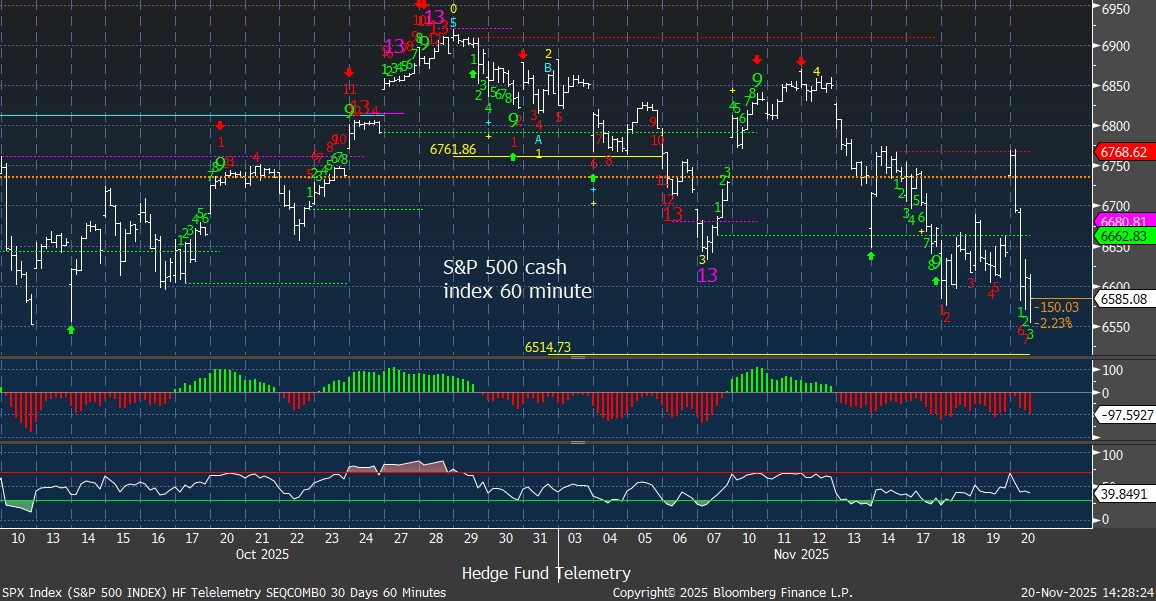
S&P cash index 60-minute tactical time frame fell hard making a new recent low with a Sequential in progress. Potential downside wave 5 price objective of 6514
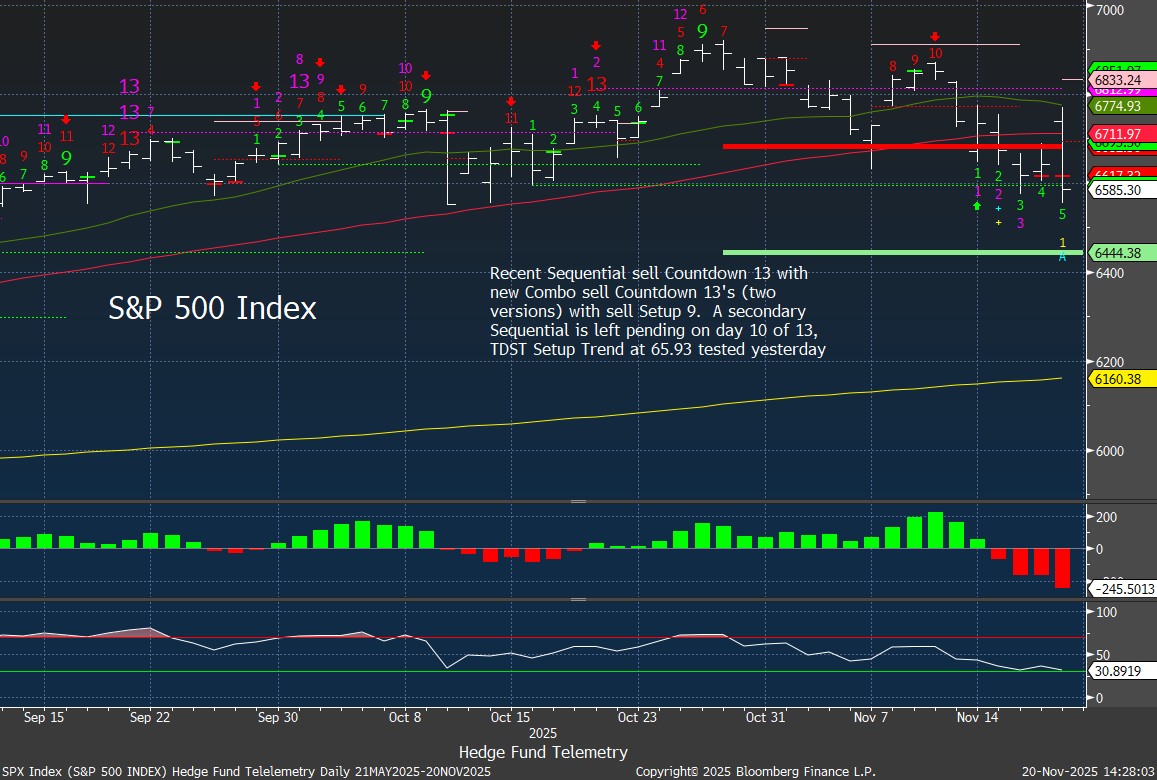
S&P 500 Index daily has potential downside DeMark Propulsion indicator with a downside target lower. This is qualified BUT it needs to confirm tomorrow with it jumping through a few hoops (DeMark has a few qualifiers that I won’t bore you with) Below the TDST keeps me biased short. I’ll let you know if this confirms tomorrow after the open.
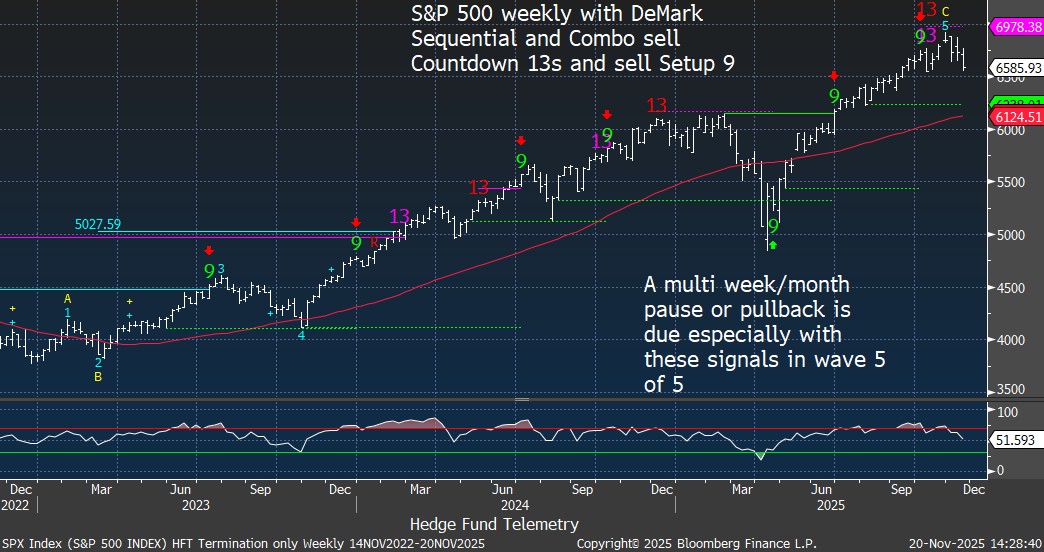
S&P weekly peaked 4 weeks ago. People are freaking out right now and this is all it’s down.
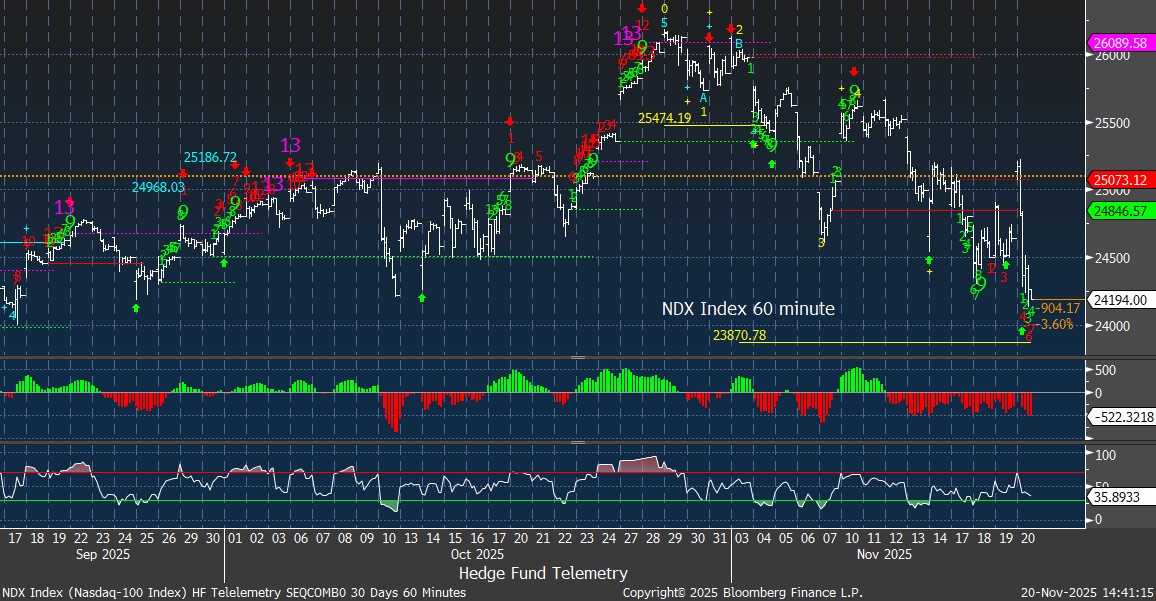
Nasdaq 100 cash 60-minute tactical time frame also reversing to make a new recent low with Sequential Countdown in progress
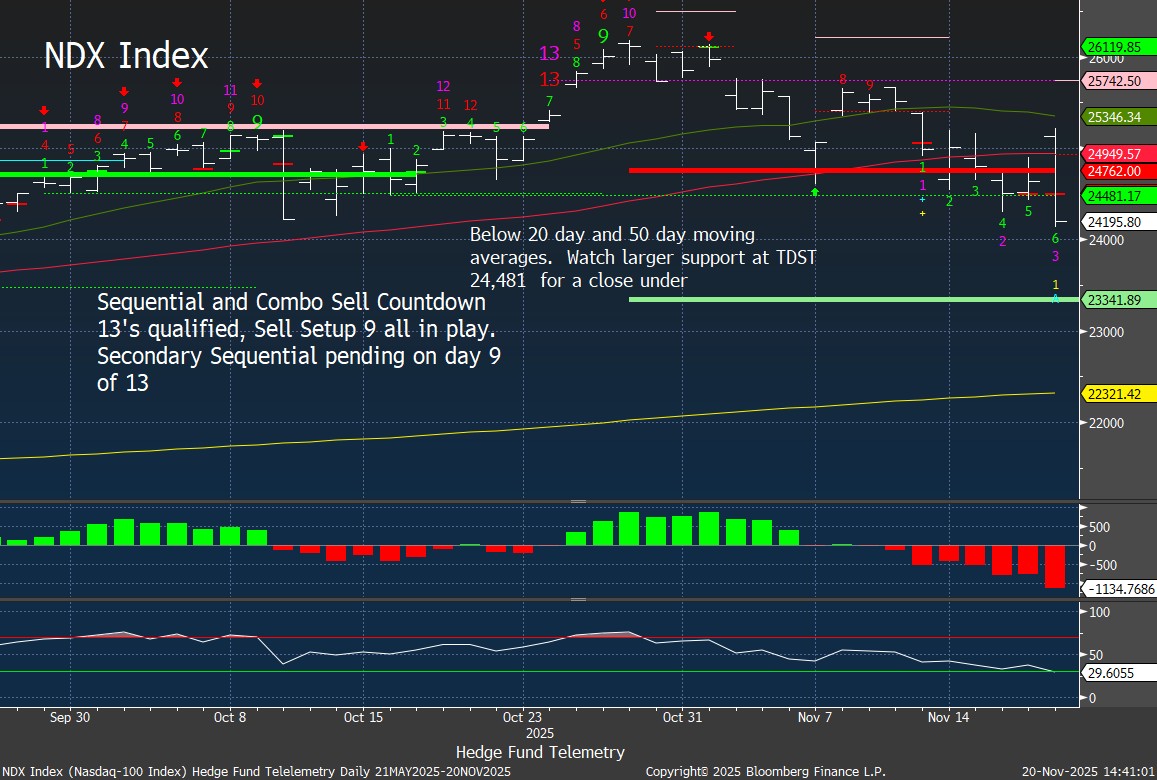
Nasdaq 100 Index daily also with a potential downside Propulsion downside target. Below TDST support
Current Portfolio
Bitcoin continues to fall and I remain short IBIT. Will be watching for follow-through and a new Sequential Countdown starting. This is what happens when people get trapped higher.
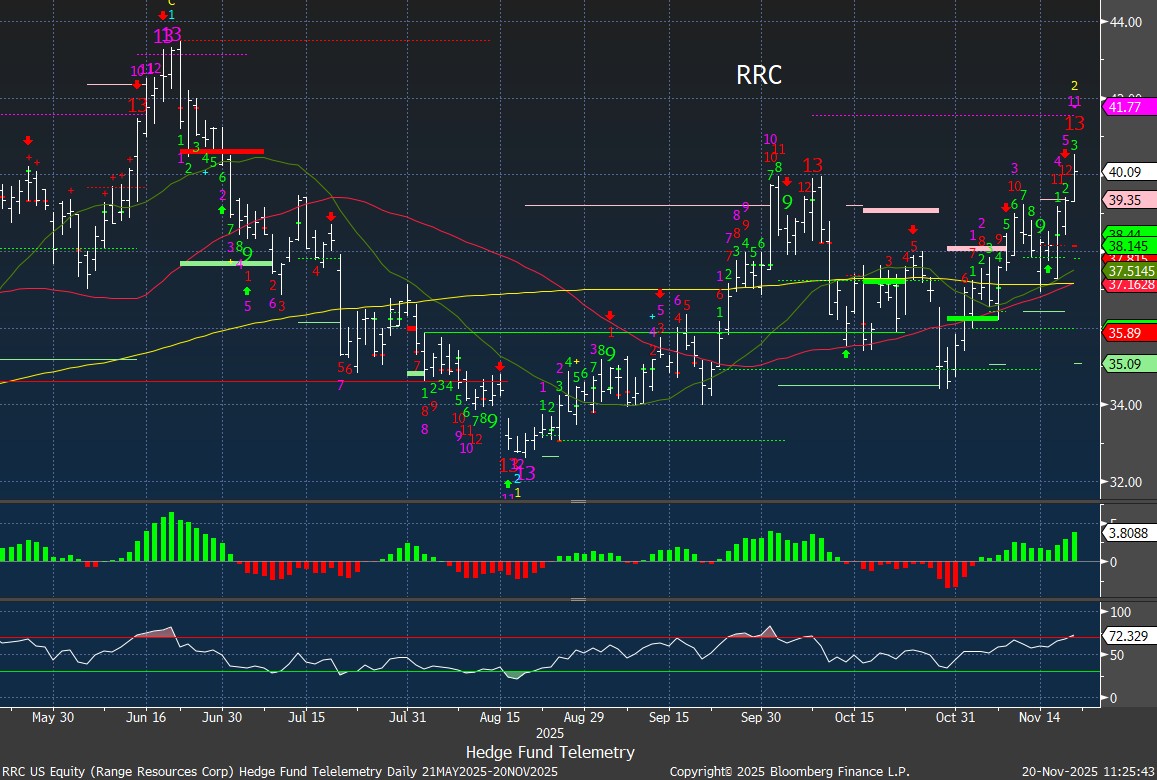
RRC has a new Sequential 13 today. I remain long and will hold longer, hoping to get the Combo 13.
Fridge worthy
The GS most shorted tech basket weekly chart is worth printing and posting on the fridge.
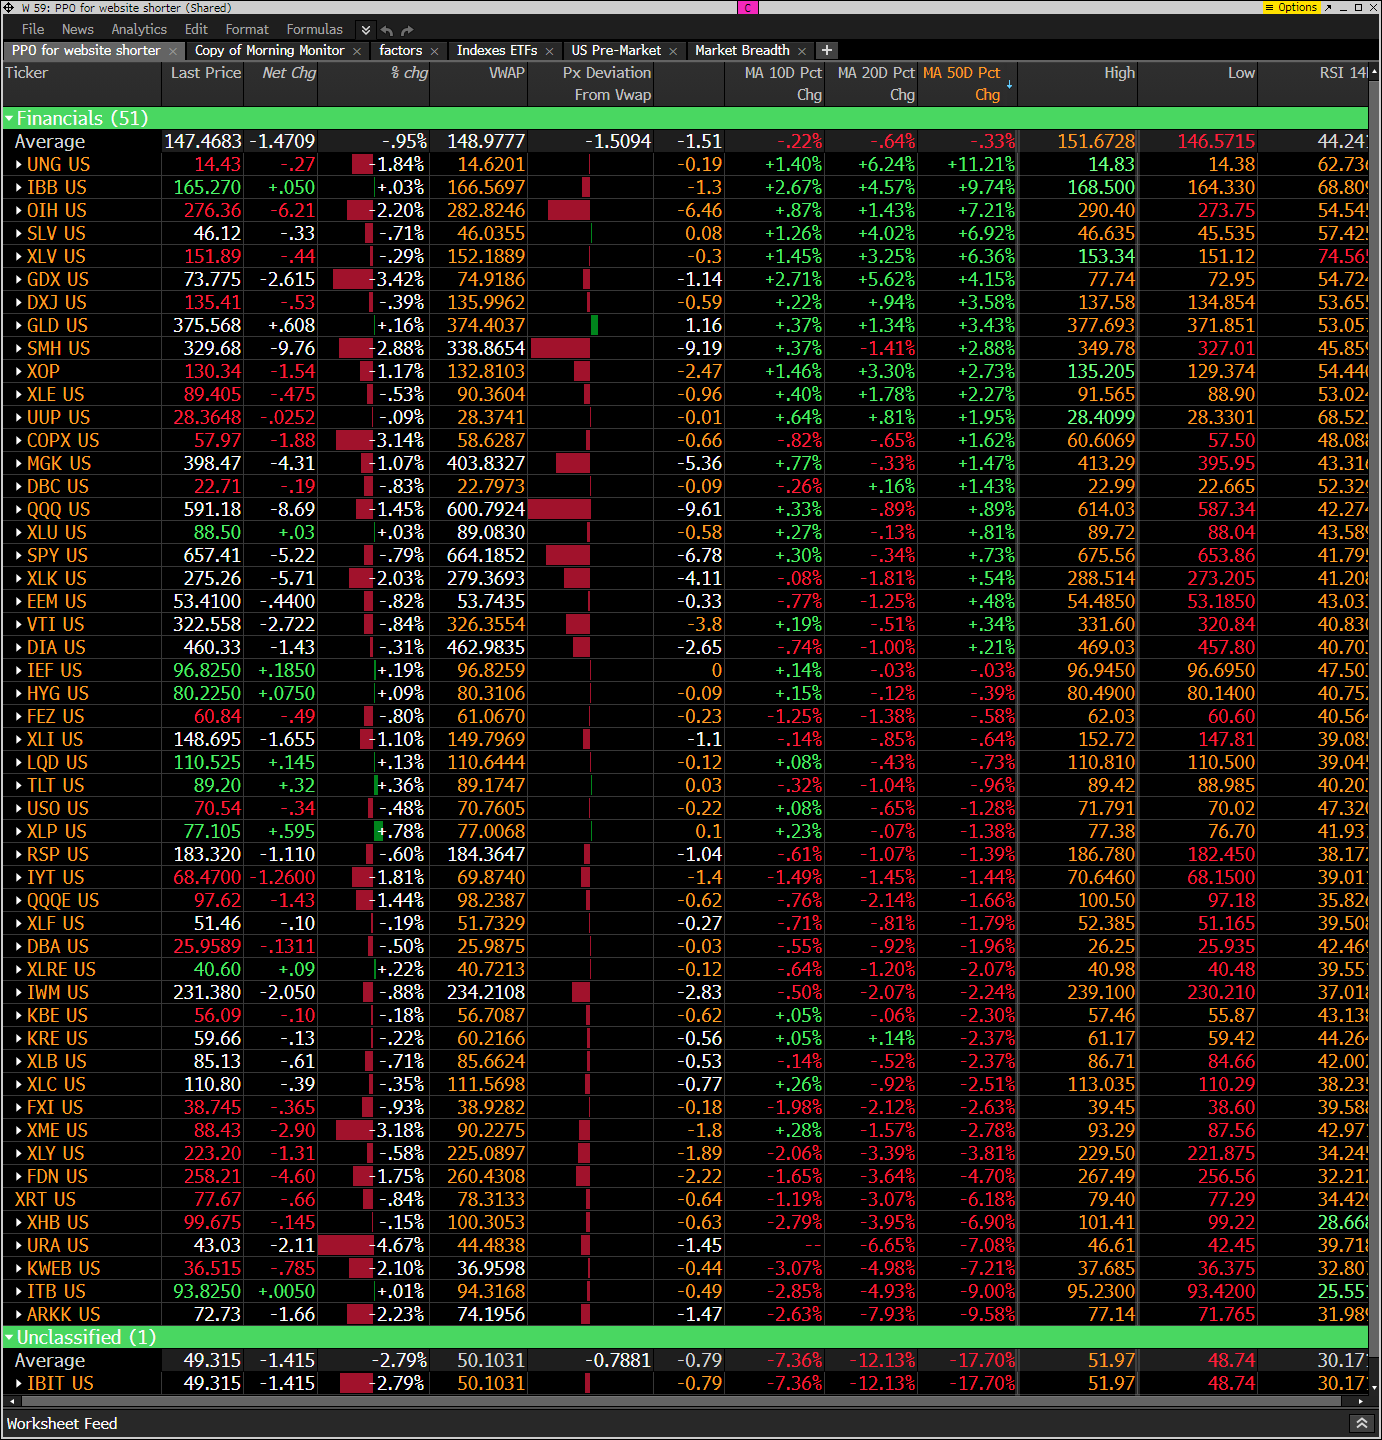
Hedge Fund Telemetry ETF Percentage Price Oscillator Monitor
The PPO monitor (percentage price oscillator) force ranks ETFs by percentage above/below the 50-day moving average. This monitor and others are offered to Hedge Fund Telemetry subscribers on Bloomberg. Ugly day with most down and below today’s VWAP levels.
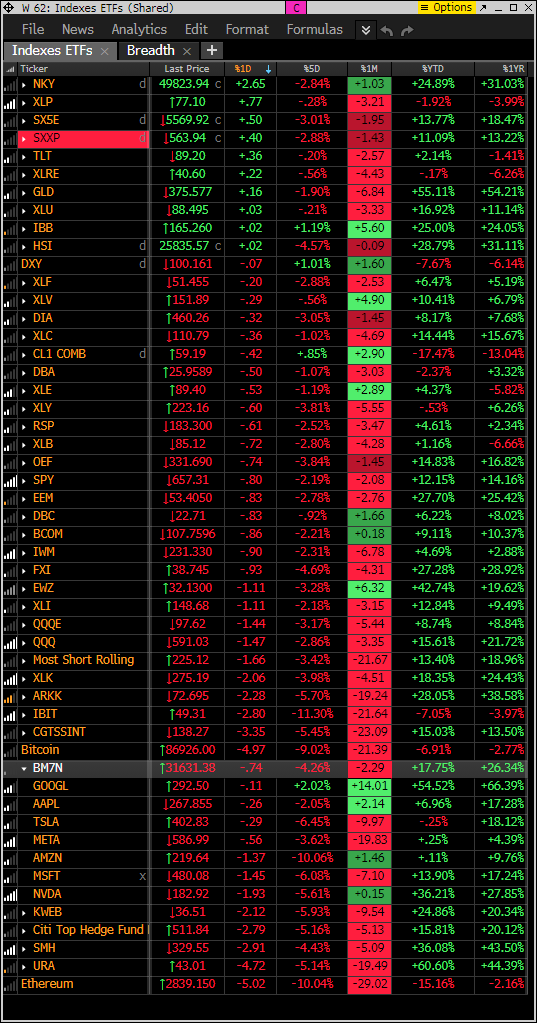
Index ETF and select factor performance
ETF with today’s performance with 5-day, 1-month, and 1-year rolling performance YTD. Most are down today, in the last 5 days and one month with a few ticking negative for the year. Pretty wild XLY Consumer Discretionary is now down YTD.
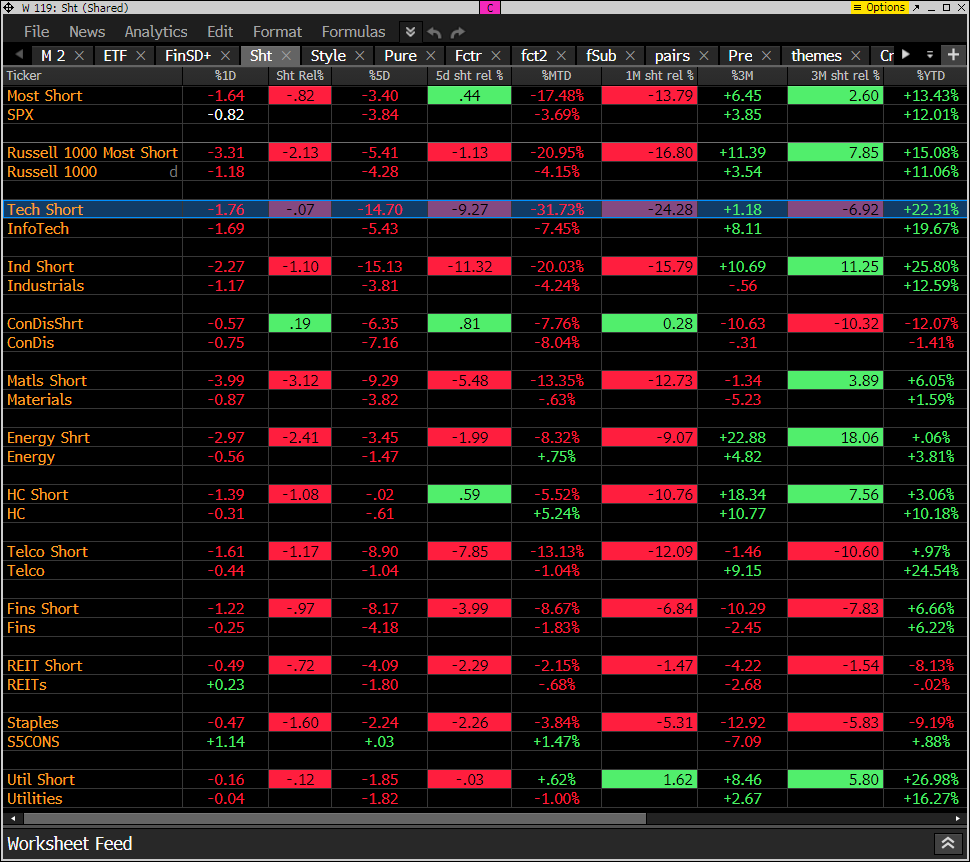
Goldman Sachs Most Shorted baskets vs. S&P Indexes
This monitor has the S&P indexes and the Goldman Sachs most shorted baskets. Down on the day for most short baskets
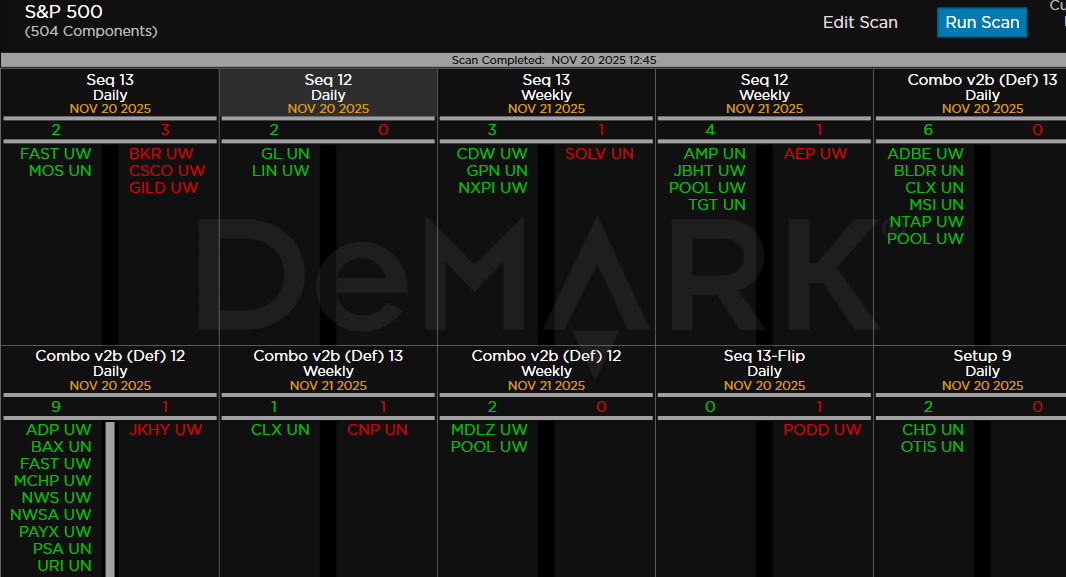
DeMark Observations
Within the S&P 500, the DeMark Sequential and Combo Countdown 13s and 12/13s on daily and weekly periods. Green = buy Setups/Countdowns, Red = sell Setups/Countdowns. Price flips are helpful to see reversals up (green) and down (red) for idea generation. The extra letters at the end of the symbols are just a Bloomberg thing. Worth noting: Mixed action with more Combo buy Countdown 13’s developing
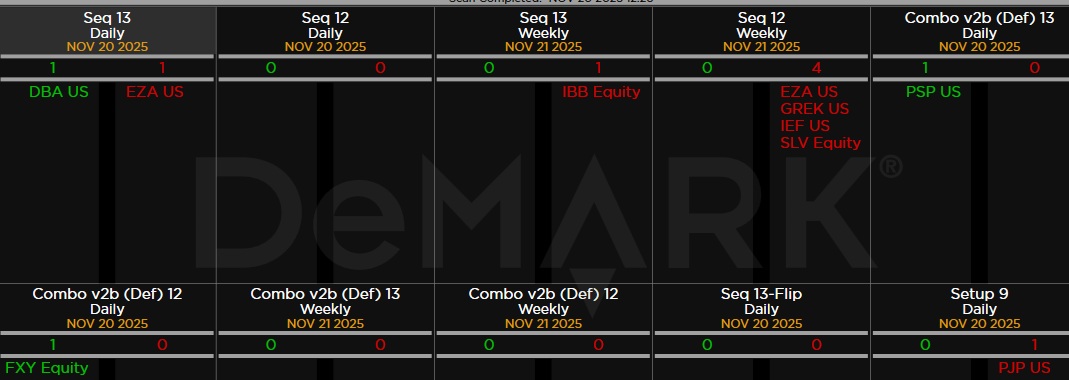
Major ETFs among a 160+ ETF universe. Quiet. DBA Ag ETF buy Countdown 13
If you have any questions or comments, please email us. Data sources: Bloomberg, DeMark Analytics, Goldman Sachs, Street Account, Vital Knowledge, Daily Sentiment Index, and Erlanger Research