

I’ve been in the markets for over 30 years, mostly at dedicated tech stock funds. I’ve seen it all. But this one is right up there among the most insane, frenzied actions ever in memory chips. Memory chips, as a reminder, are commodity chips controlled by an oligarchy of semiconductor companies. DRAM chips and NAND chip spot prices have spiked. Memory has been moved into the AI data center narrative, creating a huge demand for high-bandwidth memory, as traditional DRAM for PCs, smartphones, consumer electronics, and automotive has faced supply shortages as the oligarchy shifted production. Whenever commodity prices increase, companies and sectors face margin and demand risks, which will see pushback on memory makers. Even the most bullish sell-side and buy-side investors are now viewing this as a stock price frenzy. Jordan Klein from Mizuho, one of the best tech desk strategists, is viewing this as a frenzy. I love his work. Here’s a clip of his latest:
MEMORY LOVE FEST – More Memory Supply, Don’t Worry, Just BUY, BUY, BUY – pretty amazing that news MU plans to spend $24B for a new greenfield NAND fab expansion at an existing Singapore facility and this news has the stock up 4% in pre-mkt like the company just discovered some massive new gold deposit. You can’t make this stuff up. Even better, NAND competitors all RIPPED HIGHER ON NEWS OF CAPACITY EXPANSION IN THE SECTOR. This is like CATS AND DOGS LIVING TOGETHER!! Pull up the intraday charts for NAND peers Kioxia, Samsung and Hynix. RIP FEST. And SNDK is up 2% in the pre. I have been covering NAND and memory stocks for over 20 years. Never ever seen news of new planned capacity expansion creating a buying frenzy. That would be like oil prices ripping higher with OPEC planning supply additions into mkt. But this is NOT A NORMAL MEMORY MKT. It is a frenzy. Like toilet paper during early Covid lockdown. Remember that mayhem. Or buying gym eqpt and then outdoor patio furniture. But how did all that end? Eventually everyone could get what they needed and the PTON, ZM, CHWY stock love fests collapsed. But for now in memory ALL NEWS IS GOOD NEWS.
I’ve been completely wrong on the timing of adding these as shorts. Will I be wrong on the other side of the trade? I don’t think so, and the other side will be steep on the downside. I see this as an opportunity ahead. I can and will add more on the short side, as the rationality of these stocks at these levels is well past fully priced in. The steepness of the gains from late summer is unsustainable, and the people who have been lured into this trade will face the risk when everyone hits the red sell button at the same time. Short interest remains low, and this is clearly a chase by short-term traders on the long side. As I have said over the years, the mob of short-term traders in this market has been nomads going from one green stock to another; this is no different. The danger for those buying here is similar to that for those who believed in the past: This time is different. Perhaps it is, it’s more dangerous. By the way, DRAM spot prices with upside exhaustion signals, as shown recently, ticked down for the first time today, not much, but not up. So there’s that.
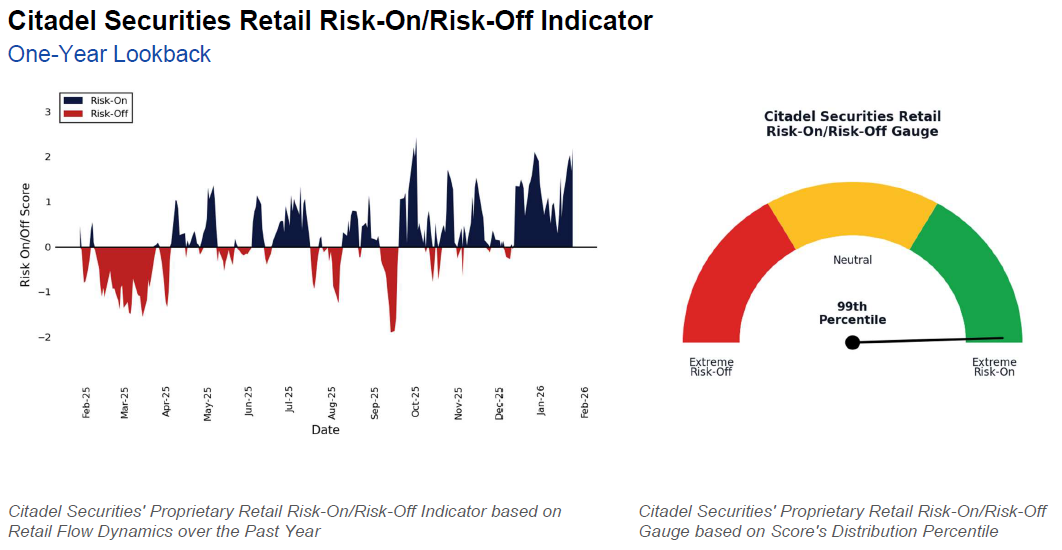
Speaking of dangerous, the Citadel retail risk-on/risk-off indicator is at the 99th percentile. I guess there’s still is 1% to go.
Quick Market Views
Stocks: The main US indexes are higher with S&P up 0.4% and Nasdaq 100 up 0.9%. Russell 2000 is down fractionally. RSP S&P equal weight is down fractionally. Mag 7 strength up 1% while the S&P 493 ex Mag 7 is flat on the day. Rotation from the broadening theme going back to the Mag 7 ahead of earnings starting this week. Breadth hasn’t been overly supportive with NYSE up 700 net issues, Nasdaq up 350 net issues. S&P has 248 up and 252 down. Nasdaq 100 has 49 up and 52 down. S&P and Nasdaq have new or developing DeMark 13’s. As I have explained before, other recent 13’s have led to nominal reversals. Check out the DeMark Observations section as I added my Market Indicators monitor – lots of 13s there too.
Bonds: Rates are mixed with 2’s down 2bps, 5’s little changed, 10’s up 1bp, and 30’s up 3bps. I mention 5’s as the bond auction today was weak.
Commodities: Mixed with Crude up 2.2%, Natural Gas reversing earlier losses and up 1.8%, Copper is down 2.4%, Gold is up 0.1%, and Silver is down 6.6%. As a reminder, yesterday I added to the SLV short and cut half of the UNG Natural Gas ETF long.
Currencies: Another very weak day for US Dollar index down 0.85% with Yen strength nearing 152 USDJPY which Tom Keene on Bloomberg said earlier that level is a HUGE risk level. Bitcoin is down 0.25%
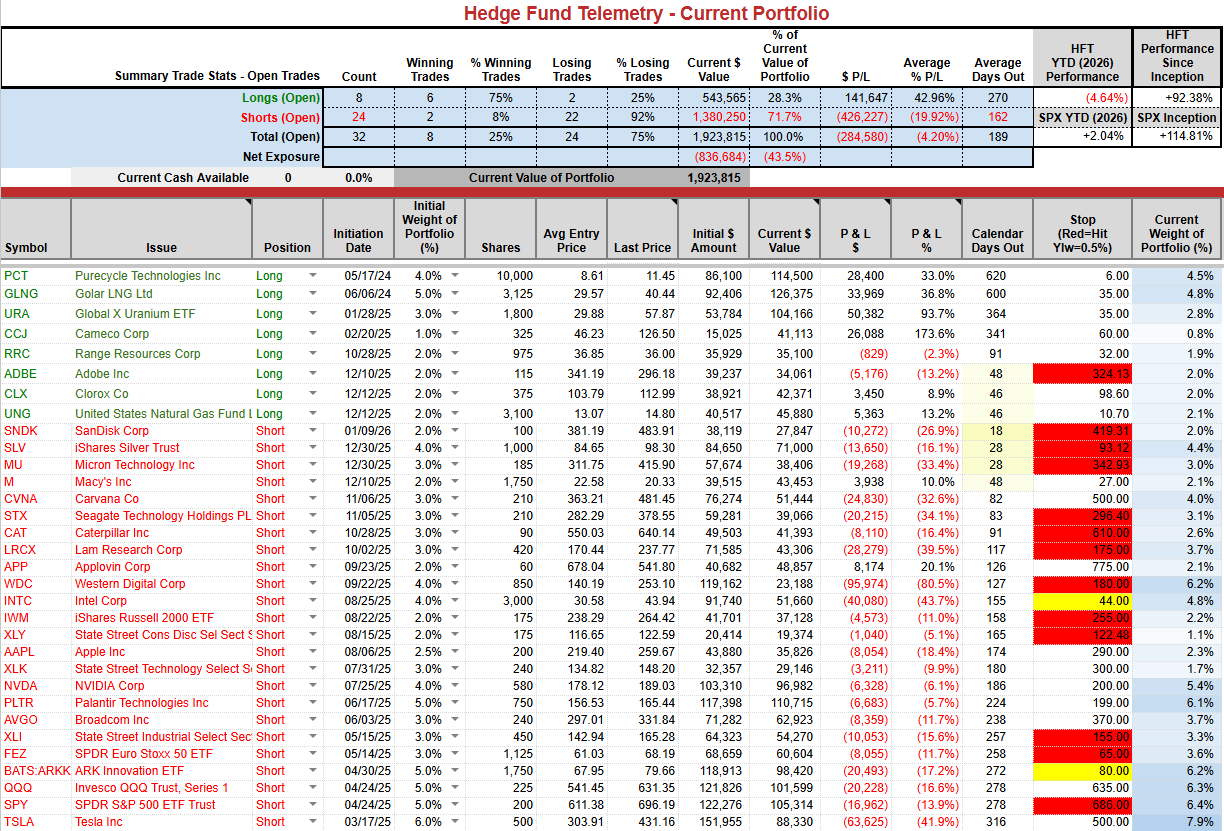
Current Portfolio Ideas:
Changes: No change to the short-term SPY and QQQ momentum indicators as they remain on buys. I’ll hold the memory shorts into STX to see if this crazy action is priced in.
Thoughts: I continue to hold URA Uranium ETF the second best performing ETF on my monitor up 35.50% On the other hand SLV is up 51% YTD and I added yesterday to the SLV short with my cost basis only 15% (not 51% as much as it feels like it) away which I expect to see below.
US INDEXES
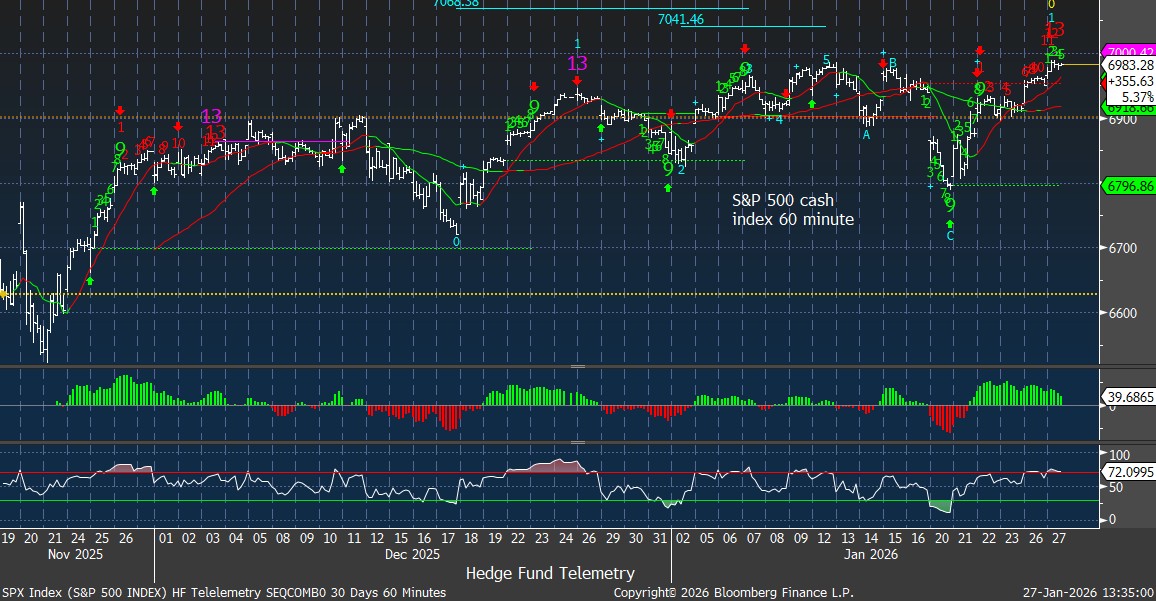
S&P cash index 60-minute tactical time frame with new Sequential sell Countdown 13
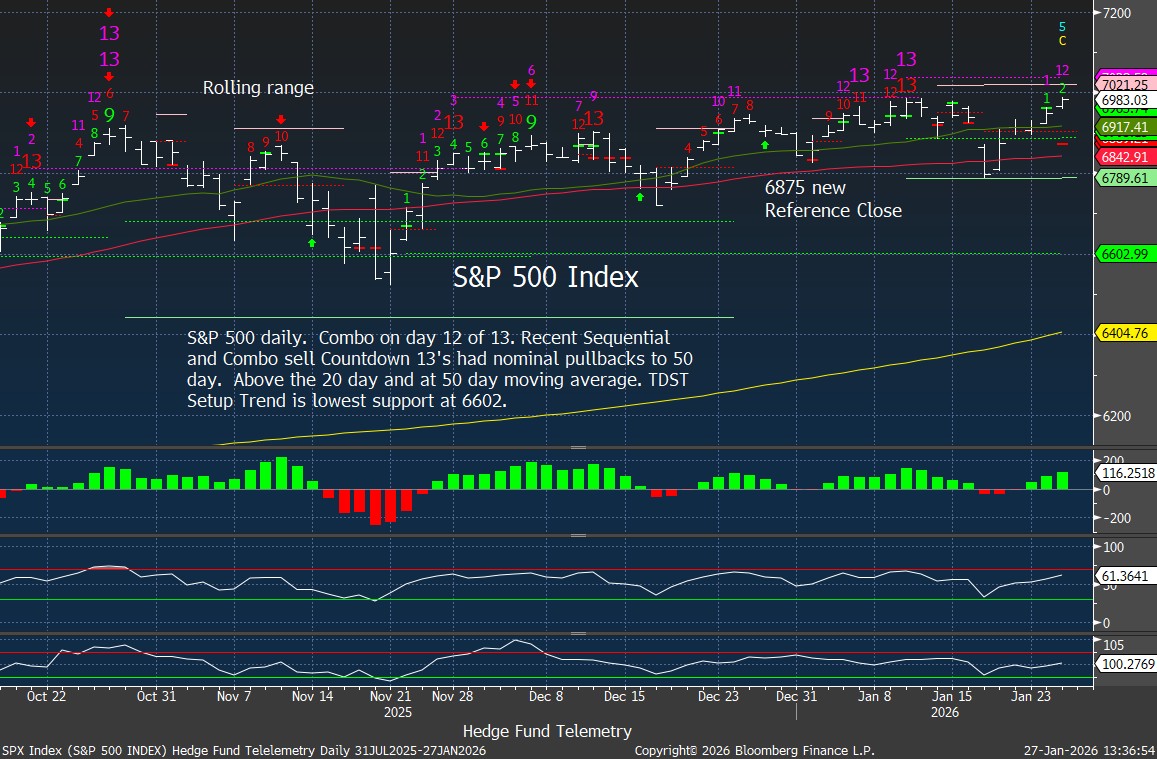
S&P 500 Index daily has had recent 13’s with nominal pullbacks and there has been a pending Combo now on day 12 of 13 using default version. A new high tomorrow will qualify this.
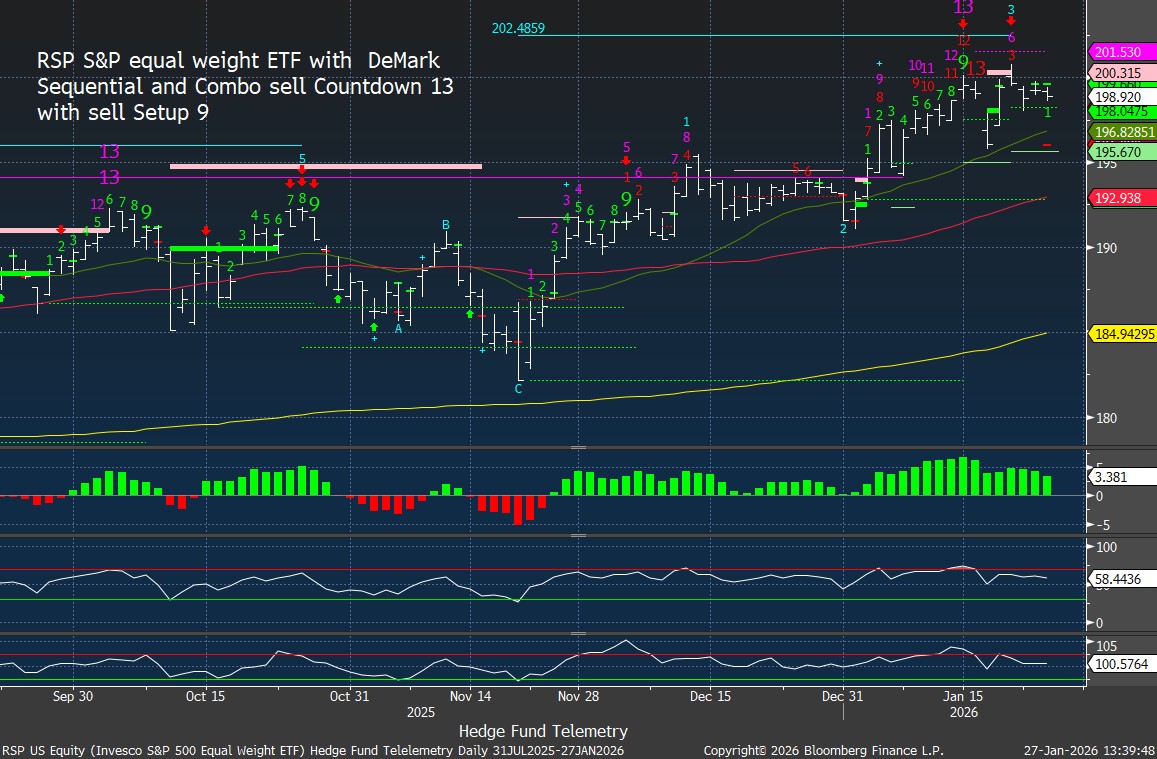
RSP S&P equal weight is down fractionally today after recent DeMark sell Countdown 13’s.
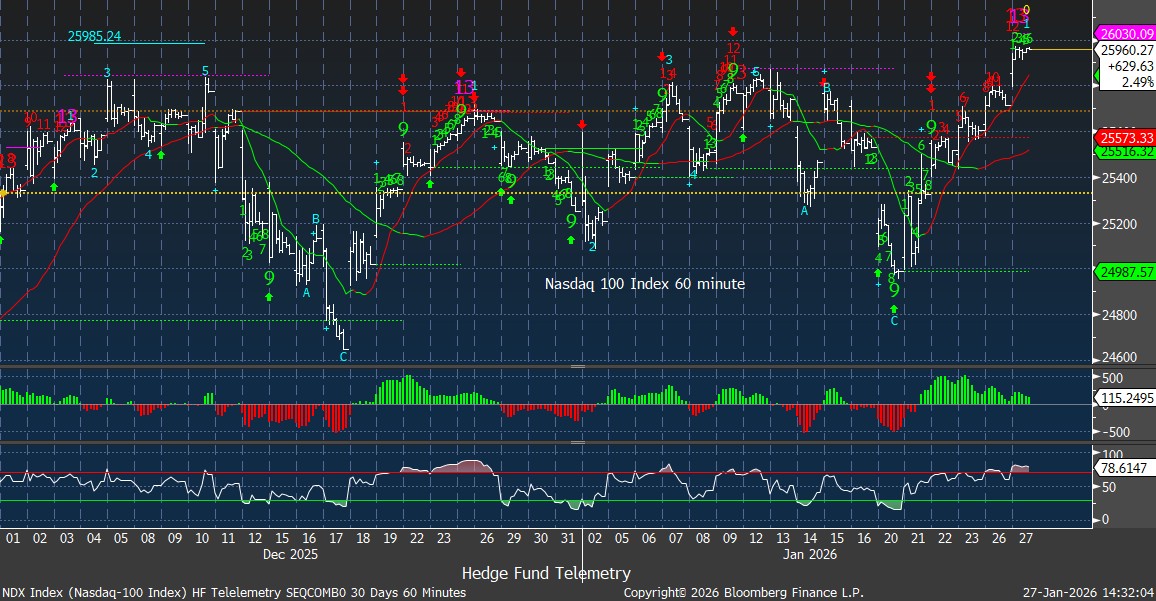
Nasdaq 100 cash index 60-minute tactical time frame with both Sequential and Combo sell Countdown 13’s. RSI in the short term is also overbought
Nasdaq 100 Index daily with new Sequential sell Countdown 13. Other 13’s have seen periods of nominal pullbacks or stalling periods. This index has still not surpassed the October high.

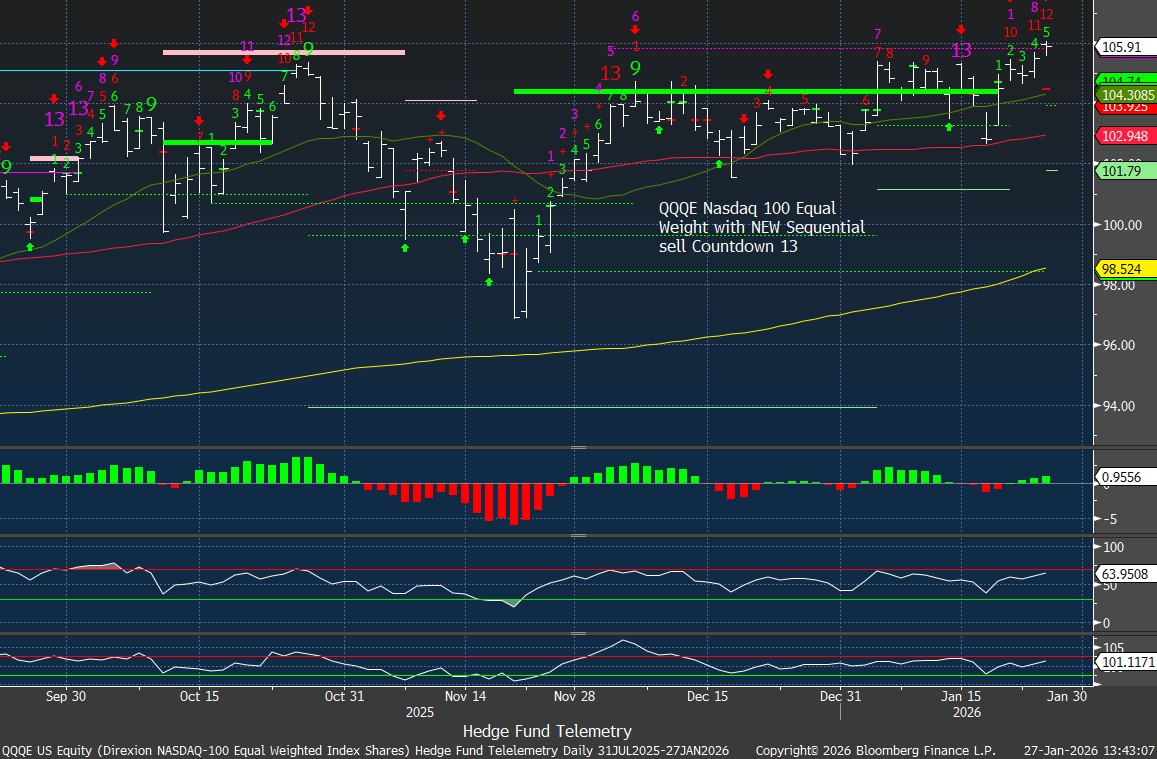
QQQE Nasdaq 100 has made a new high with Sequential on day 12 of 13.
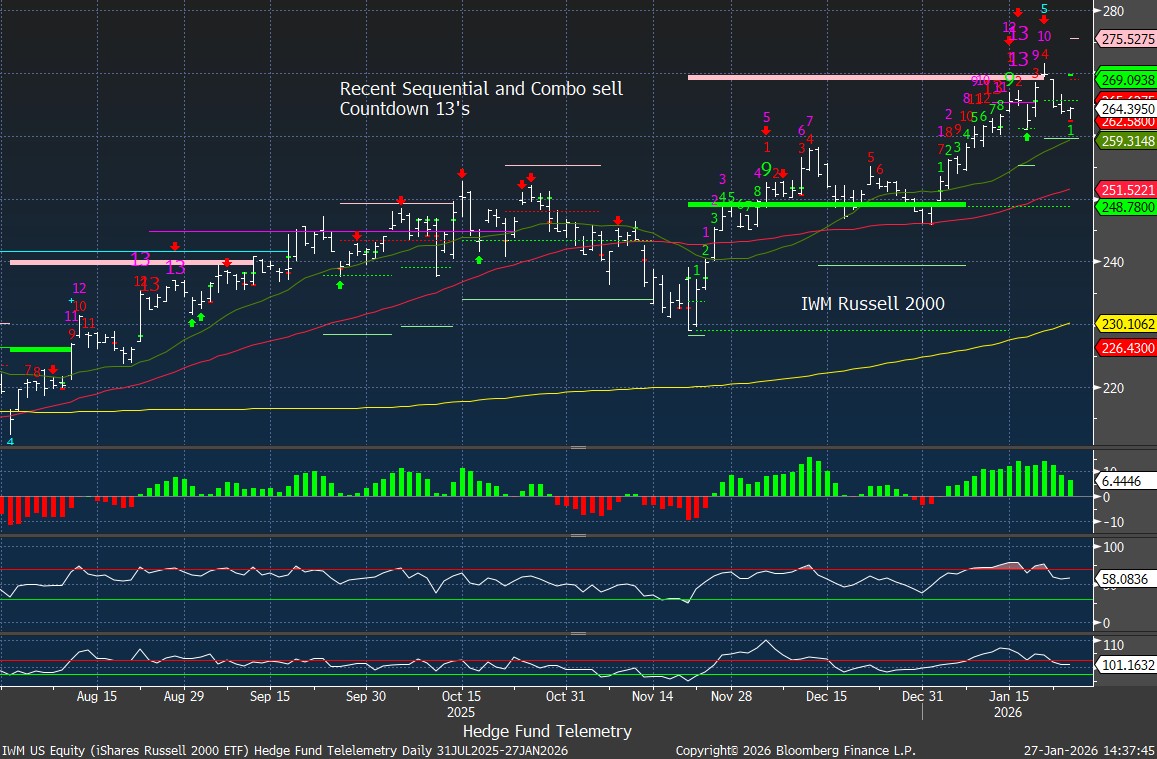
IWM Russell 2000 with recent upside exhaustion signals too
Current Portfolio
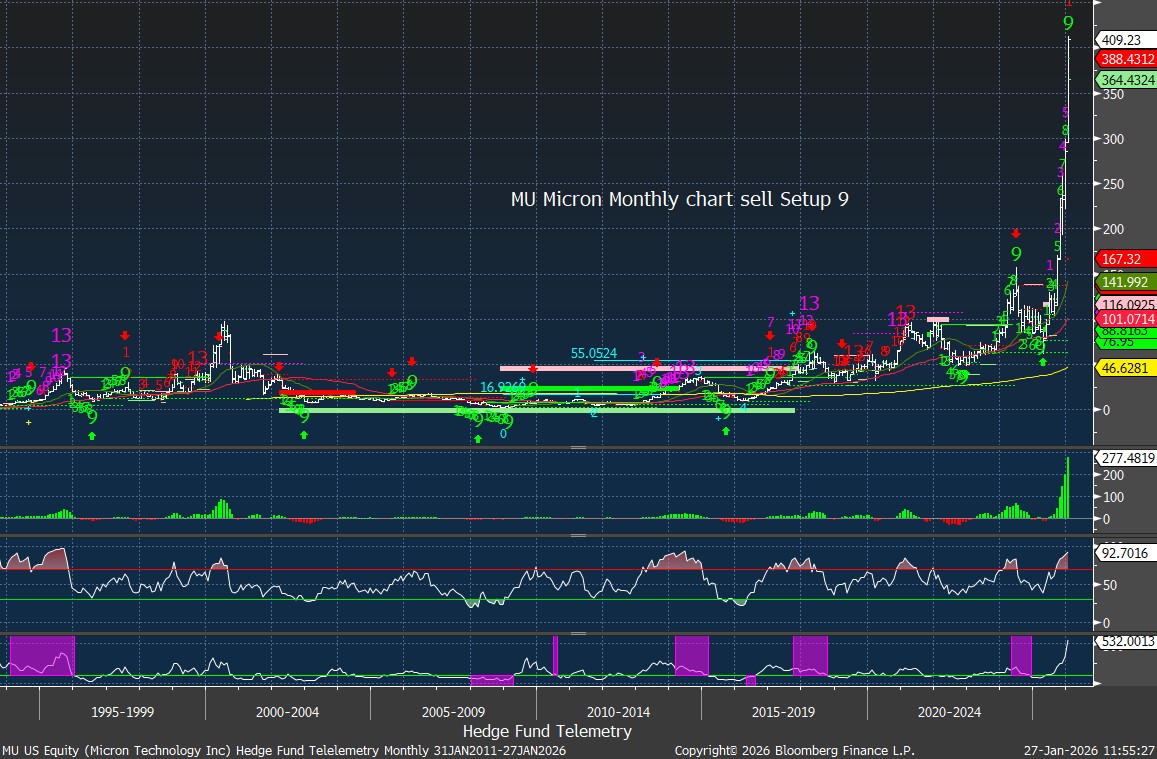
MU’s Micron weekly and monthly charts show a parabolic move, with DeMark exhaustion signals in play.
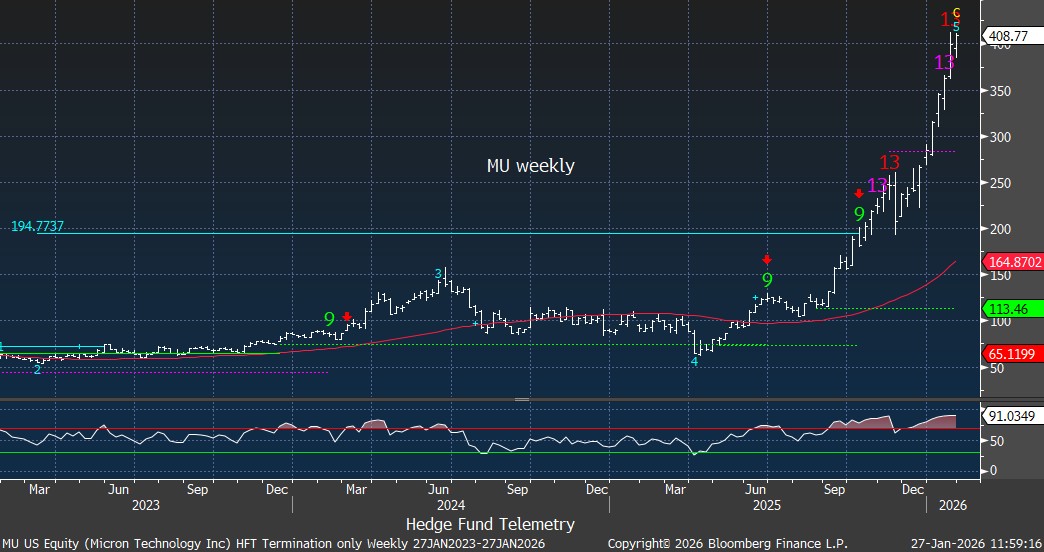
This isn’t short covering, it’s chasing by long-only traders. Complete frenzy and unsustainable. When it falls, people won’t be able to get out or short. I won’t seem so crazy on the other side of this.
MAG 7 and S&P 493 ex Mag 7 update
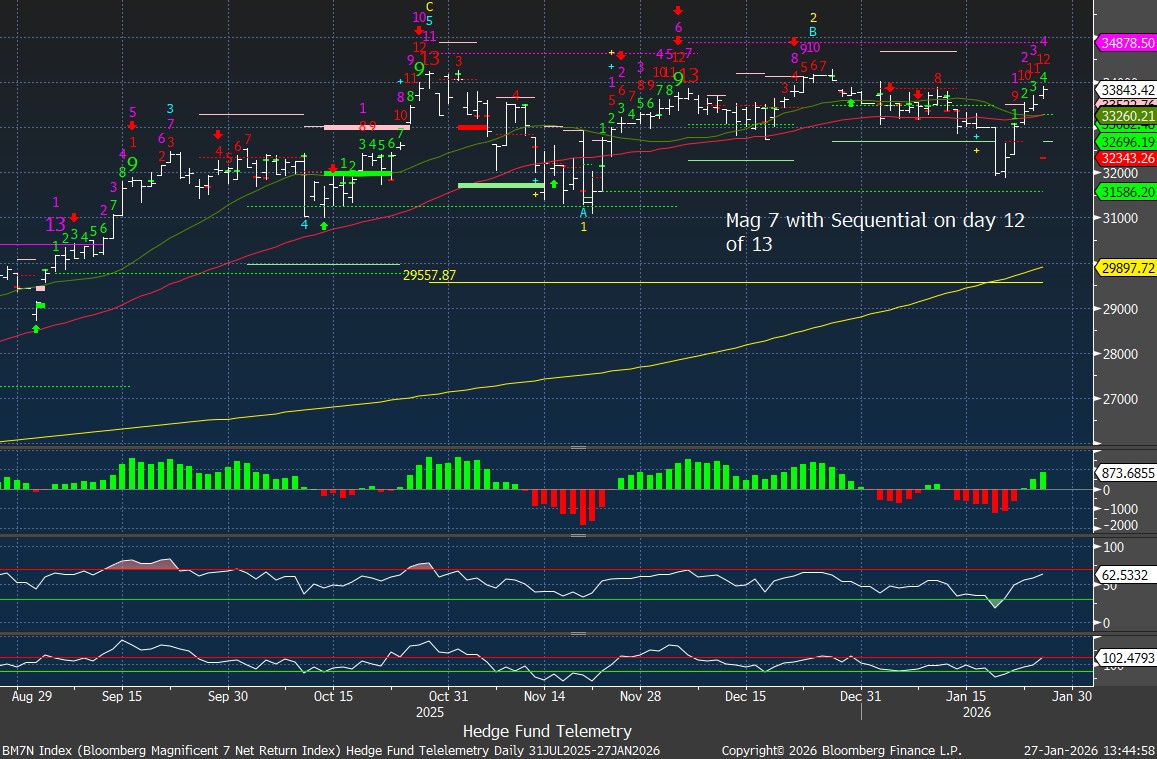
Mag 7 daily chart has a Sequential on day 12 of 13.
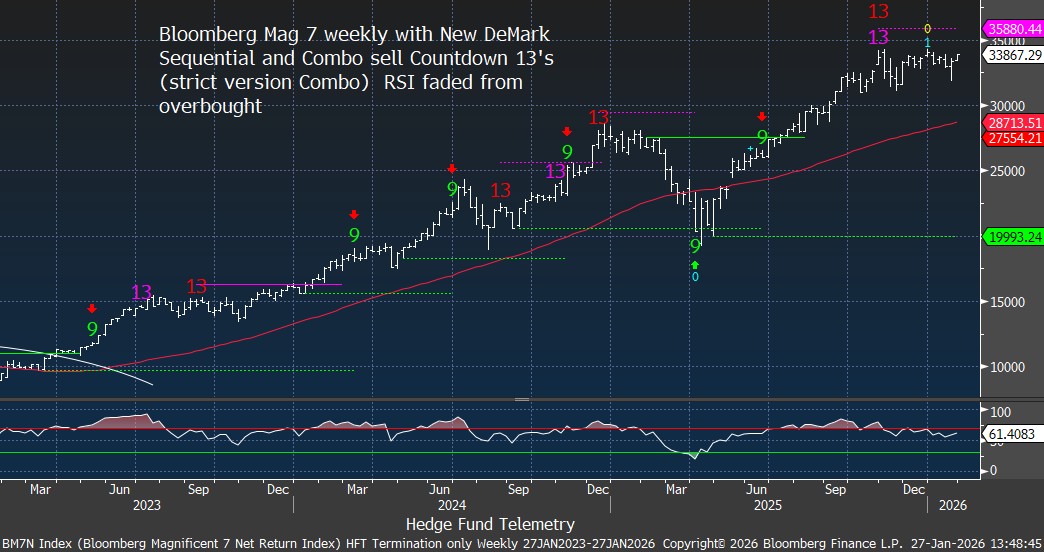
Mag 7 weekly stil has not hit a new high
S&P 493 ex Mag 7 has been moving sideways in the last several weeks
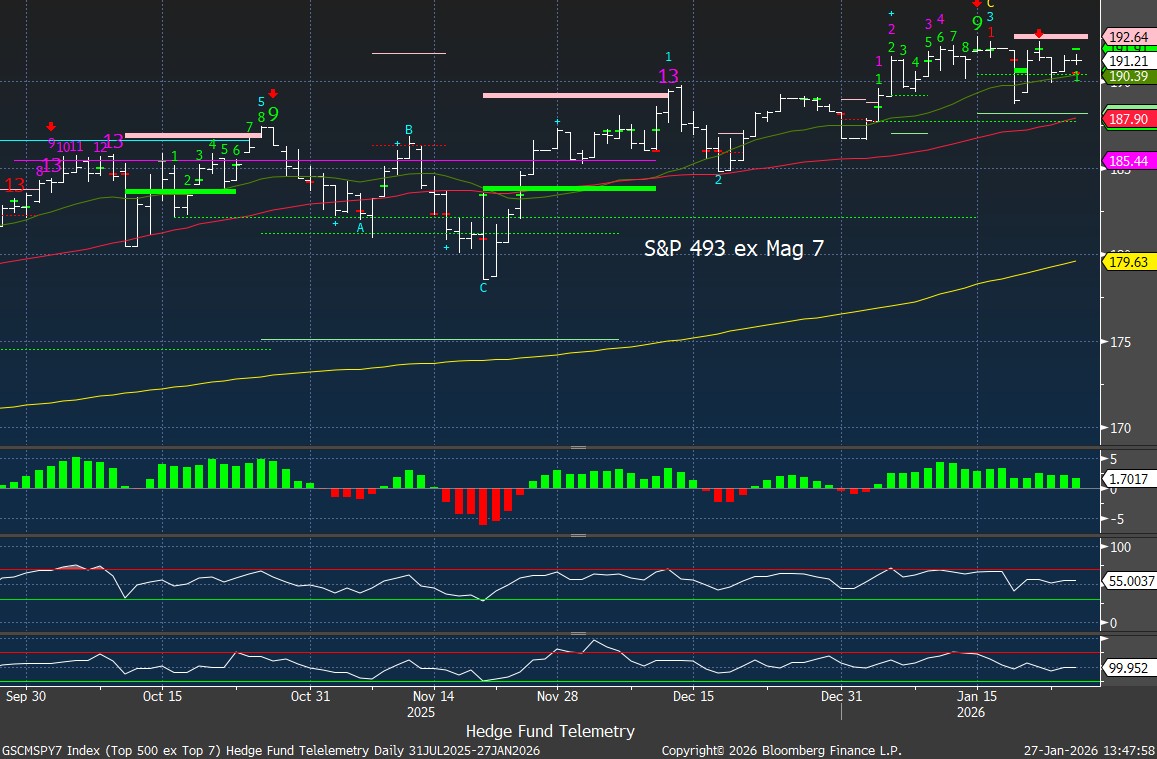
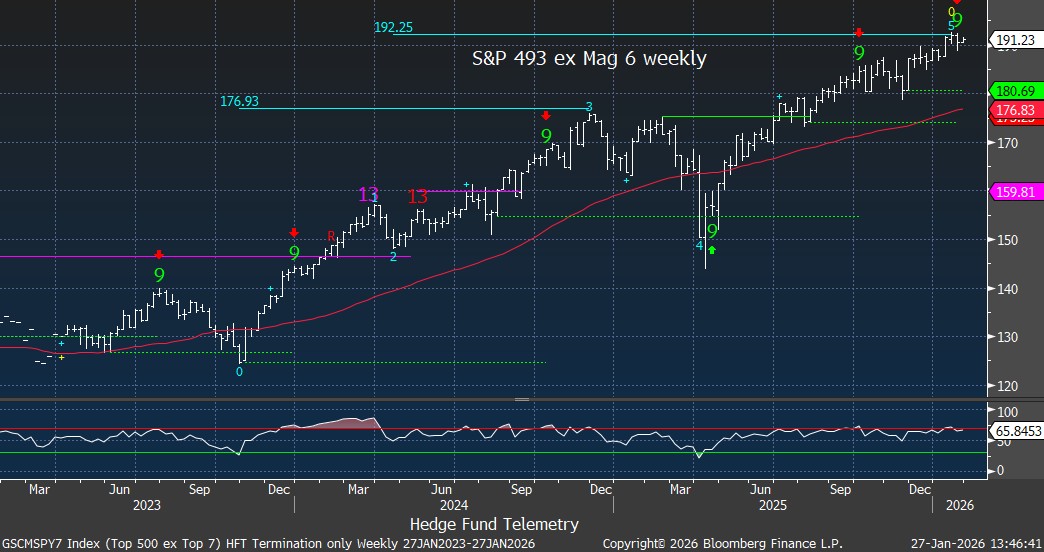
The weekly for the 493 hit the upside wave 5 price objective just as it hit the wave 3 price objective.
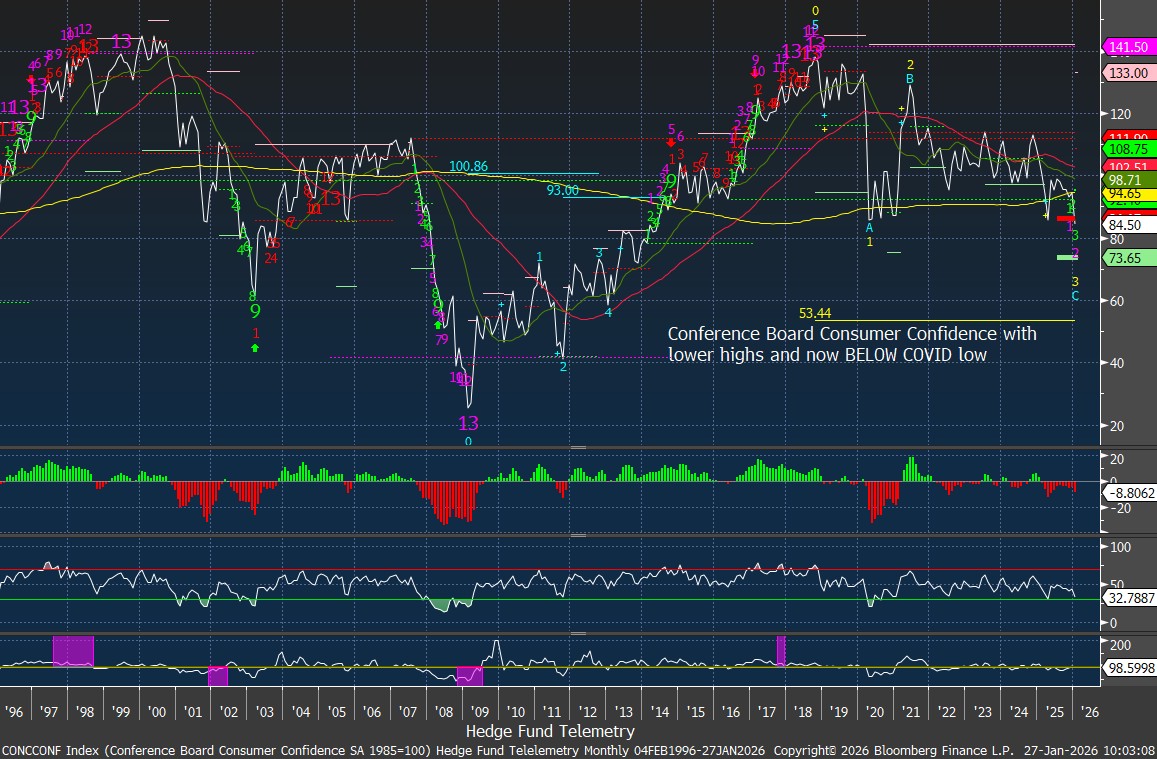
consumer confidence with new low
The Conference Board consumer confidence survey hit a new low – under the Covid low and the lowest since 2014. I see this as the growing problems with concerns about high prices/inflation as well worries about job losses. It’s unusual to see this with the S&P at a high – to say the least
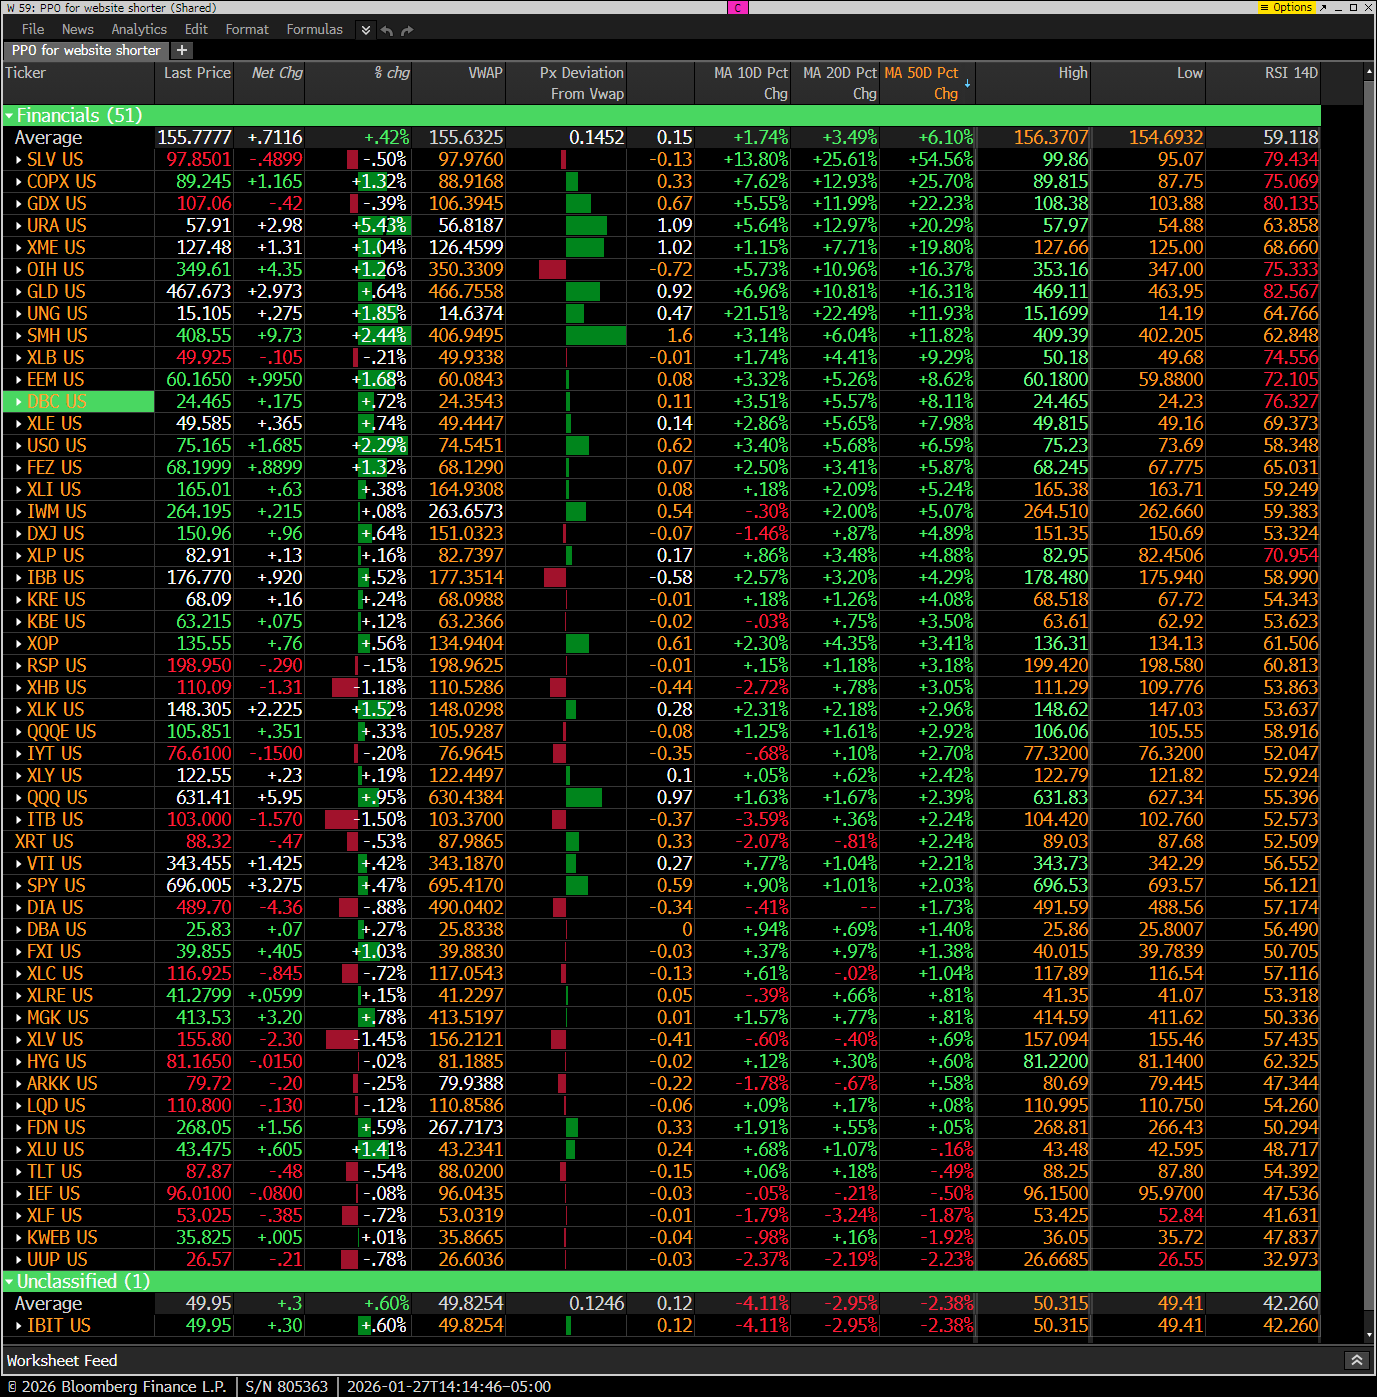
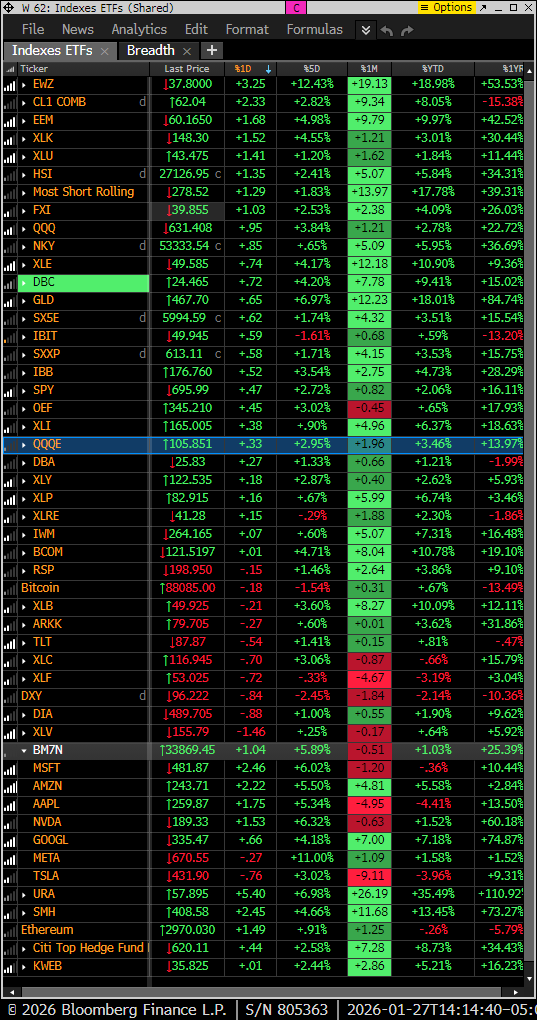
Hedge Fund Telemetry ETF Percentage Price Oscillator Monitor
The PPO monitor (percentage price oscillator) force ranks ETFs by percentage above/below the 50-day moving average. This monitor and others are offered to Hedge Fund Telemetry subscribers on Bloomberg.
Index ETF and select factor performance
ETF with today’s performance with 5-day, 1-month, and 1-year rolling performance YTD.
Goldman Sachs Most Shorted baskets vs. S&P Indexes
This monitor has the S&P indexes and the Goldman Sachs most shorted baskets. Mixed action but overall shorts baskets continue to get squeezed higher vs index action. But some are down – consumer disc, telco, fins, reits, staples – defensive.

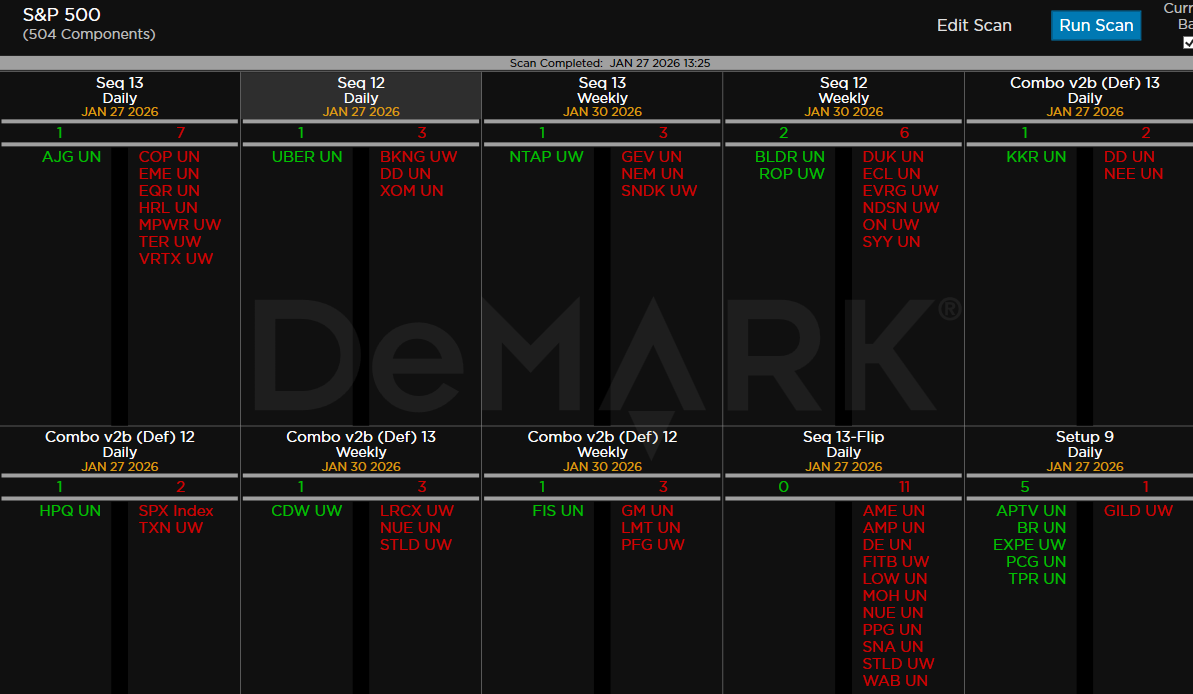
DeMark Observations
Within the S&P 500, the DeMark Sequential and Combo Countdown 13s and 12/13s on daily and weekly periods. Green = buy Setups/Countdowns, Red = sell Setups/Countdowns. Price flips are helpful to see reversals up (green) and down (red) for idea generation. The extra letters at the end of the symbols are just a Bloomberg thing. Worth noting: Still more sell Countdown 13’s on daily and weekly. Decent number of price flips on the downside too
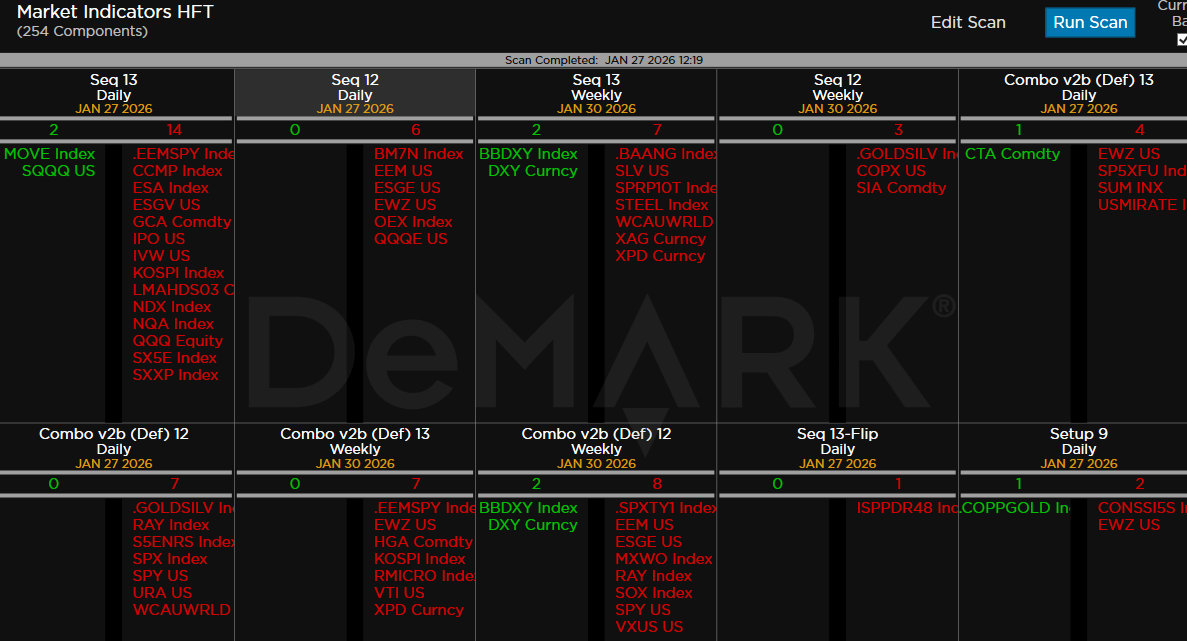
I don’t show this one everyday but it’s my market indicator monitor and there are quite a lot of important indexes, ETFs with sell Countdown 13’s developing on both daily and weekly time frames.
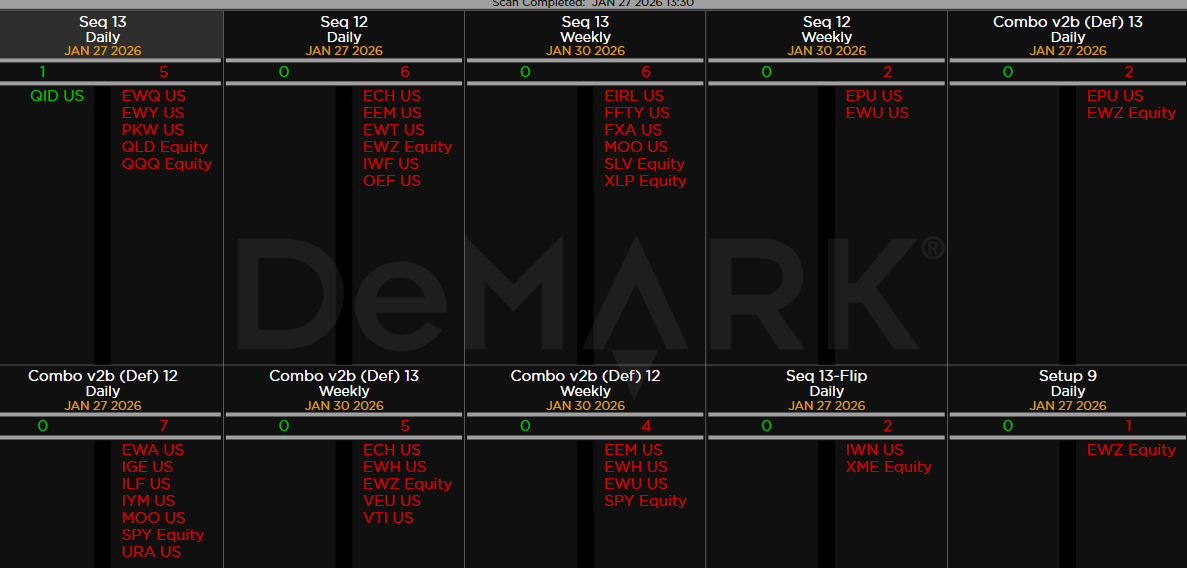
Major ETFs among a 160+ ETF universe. More sell signals on daily and weekly time frames
If you have any questions or comments, please email us. Data sources: Bloomberg, DeMark Analytics, Goldman Sachs, Street Account, Vital Knowledge, Daily Sentiment Index, and Erlanger Research