

- As a reminder I will be taking tomorrow off. I’m traveling to Charleston to see my daughter and her new baby boy. I figured this was a good weekend as the earnings bulk would be behind and markets would be relatively quiet. The bulk is behind but the markets are far from quiet. I’ll post a note if market volatility warrants comments.
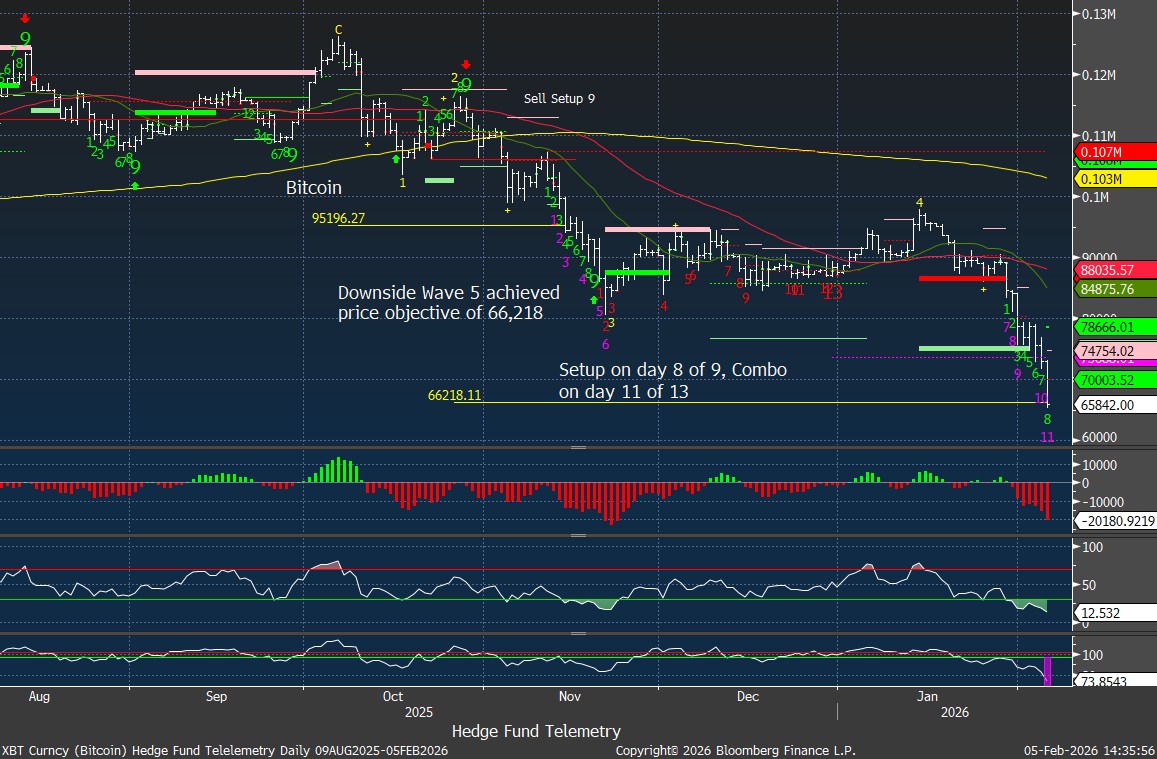
- I wrote this week how the market confidence chain has links breaking. Various sectors are seeing sharp moves lower as well crypto and Bitcoin are still going lower. I’ve had a mechanical downside wave 5 price objective on Bitcoin at 66k which was achieved today. That doesn’t mean it’s time to buy as it can and might down more especially knowing there are some heavily levered players that are underwater. I don’t think it’s capitulation yet.
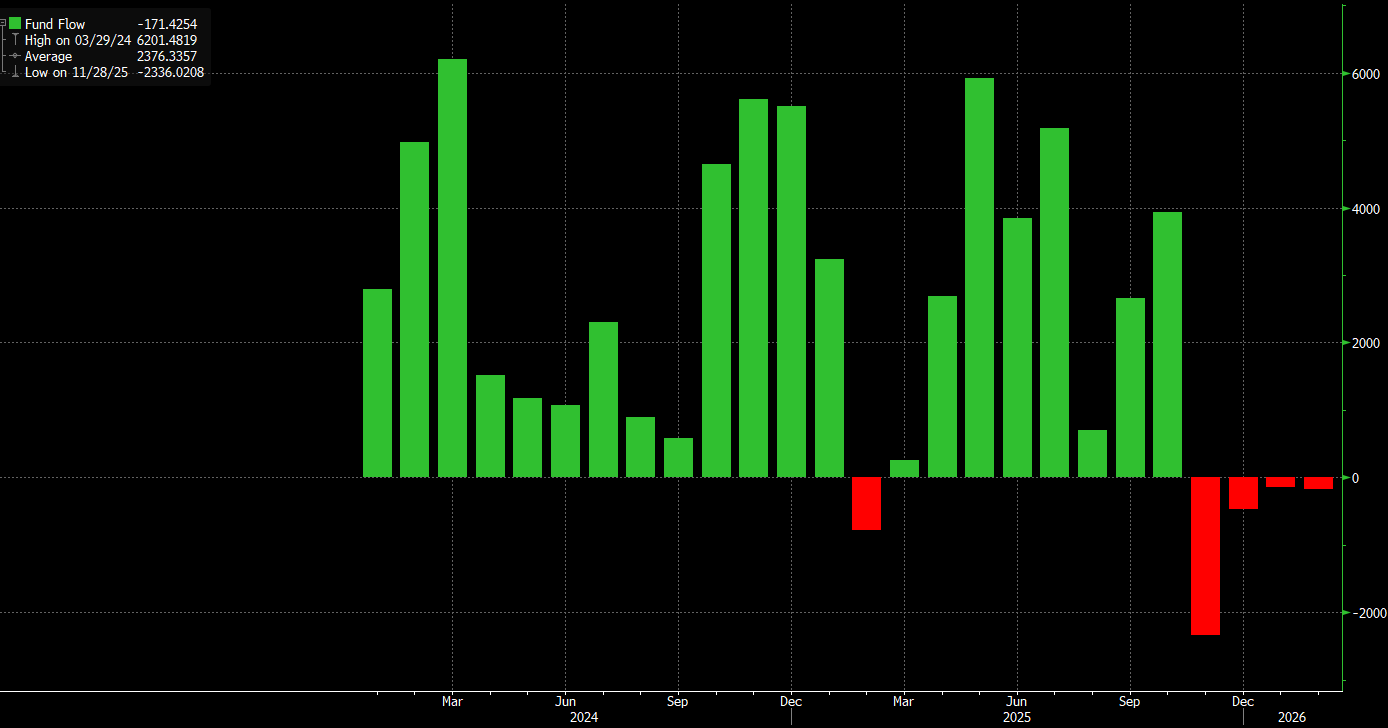
- IBIT the Bitcoin ETF has a average cost for owners of $81k Bitcoin equivilent. I posted the monthly inflows/outflows below. Let’s say there were a lot more inflows at much higher prices with the last 4 months only small outflows.
- The crazy thing about crypto and Bitcoin is that despite a history of some insane downside moves, the enthousiam has remains sky high with the faithful. I don’t know of another asset that has had that type of enthousiasm.
- People are hoping President Trump will save the crypto market by instructing Treasury Sec Bessent to buy Bitcoin with government money. As much as this is a terrible moral hazard of an idea, Trump might. I’m not for bailing out highly levered speculators in an asset that has no intrinsic value nor is a SIFI (systemically important financial institution).
- A high number of people are overeager to buy asking me what and when to buy and that is because of being conditioned that there is always bounce right around the corner has been ingrained in the last several years.
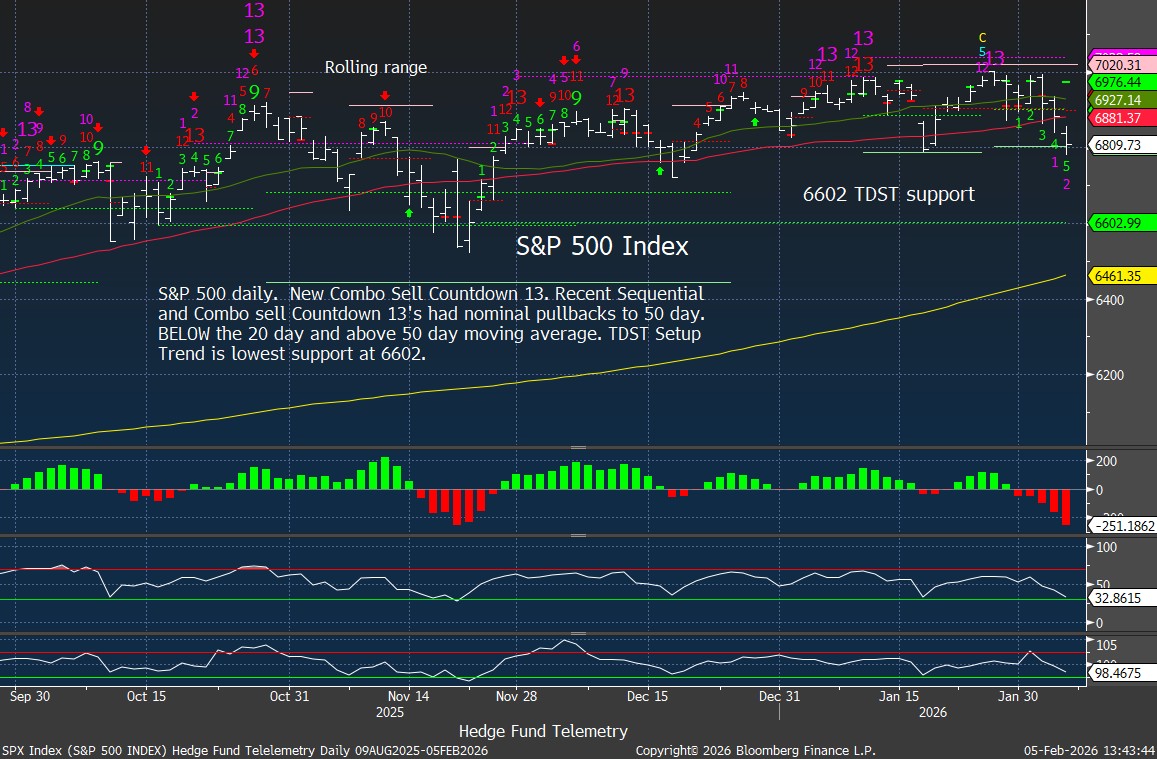
- There are a lot of pot holes out there that are turning into sink holes for some assets, sectors. Overall the S&P has not broken any significant levels. 6600 on the S&P is a level I’m watching – the Oct/Nov lows. If that breaks – I could see 5600 and even 4800 as lows using some Fibonacci retracements. Valuation on the S&P would be more inline with historical levels and I would be covering shorts and shifting long like I did last April. The problem right now is sentiment is far from oversold, internals are not oversold, and the indexes are barely off the highs with no DeMark buy signals close. Positioning remains fully long with retail, institutions, and levered!
- Liquidity is like oxygen – you never notice it until you need it! I have this written down on a post it as it’s so true right now.
- Investors/traders have had a gambling mentality and have moved from one thing to another that is green on the day. Markets tend to bottom when there are no places to hide other than cash.
- A lot of private credit, BDC’s (Business development companies) have reported and have made the rounds on Bloomberg TV. Everything is fine according to them. The price action in the sector shows the market sees it differently. I have a guest comment below from my friend Kevin Cope on auto finance.
- I am a professional trader and am always involved in the markets. If I wasn’t and had another job, I’d raise cash, sleep at night and wait for the markets to clearly bottom and present lower risk buying opportunities.
- With that I will end it here. I hope the Patriots win the Super Bowl although the Seahawks are the better overall team.
- Have a great weekend and enjoy the game. Again, if something important happens tomorrow, I post a short note.
Quick Market Views
Stocks: Broad weakness with indexes sharply lower. Yesterday despite the index weakness breadth was solid. Today it is very weak with NYSE down 1650 net issues, Nasdaq down 2250 issues. S&P has 194 up and 309 down. Most sectors are down ex Consumer Staples with Utilities and REITs flat on the day. A defensive posture has been in the market for the last week as I have shown Consumer Staples reversing higher – a tell tale sign of rotation to defensive positioning.
Bonds: Rates are sharply lower down 6-8bps – some of the weaker econ data and a risk off move into bonds.
Commodities: Crude is down 3%, Natural Gas is now flat, Grains higher by 1%, Copper down 1%, Gold down 2%, and Silver down hard 12%.
Currencies: US Dollar Index is up 0.2% creeping higher in the last week. Bitcoin is down nearly 13%
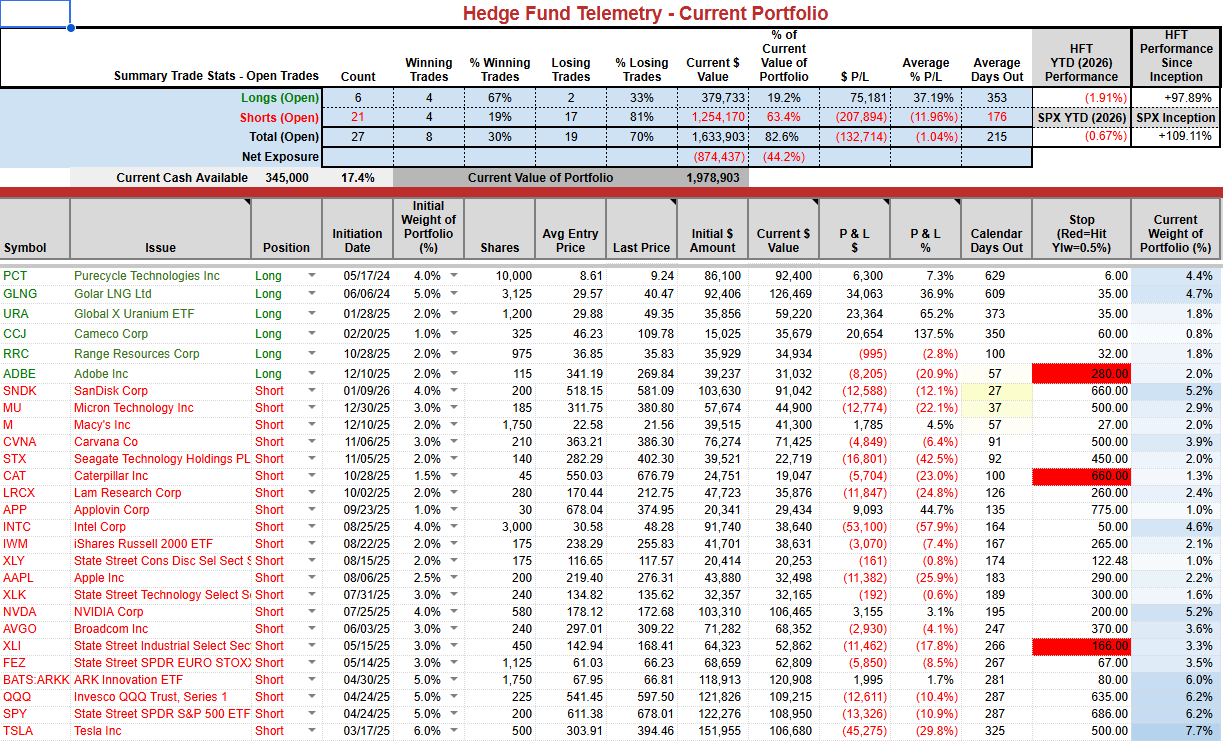
Current Portfolio Ideas:
Changes: I have plenty short. I will cover 2% ARKK short with a gain and leave 3% short.
US INDEXES
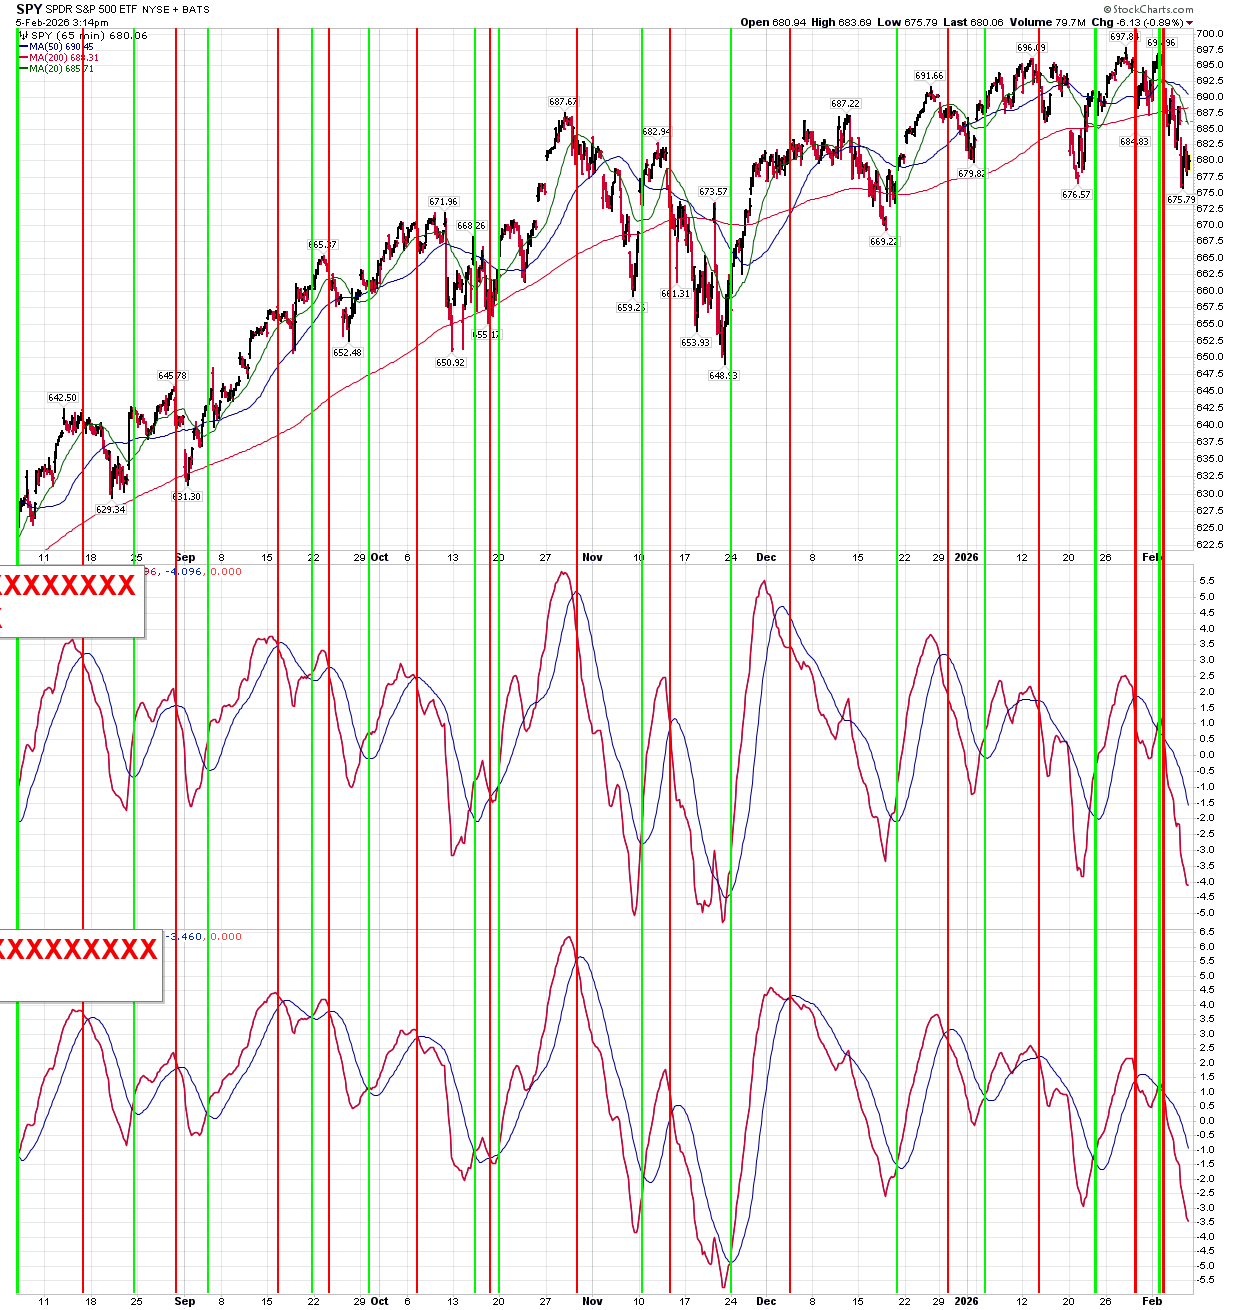
S&P futures 60-minute tactical time frame
S&P 500 Index daily has not broken any levels other than the 50 day. 6602 is the TDST Setup Trend support that is the most important level to watch in the big picture.
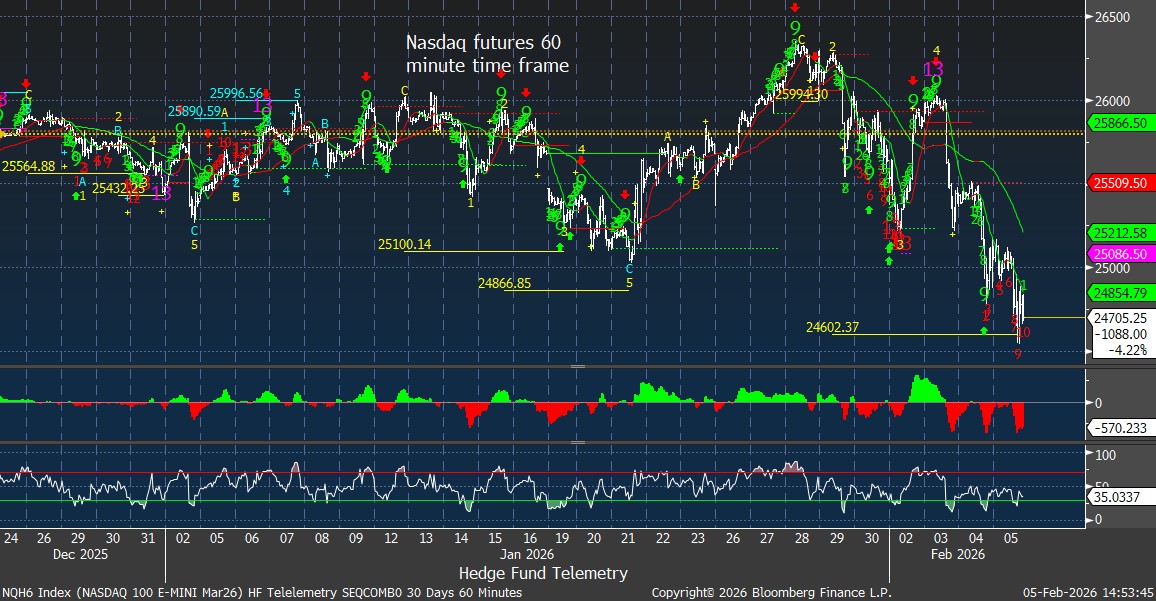
Nasdaq 100 futures 60-minute tactical time frame at downside wave 5 with downside Sequential in progress
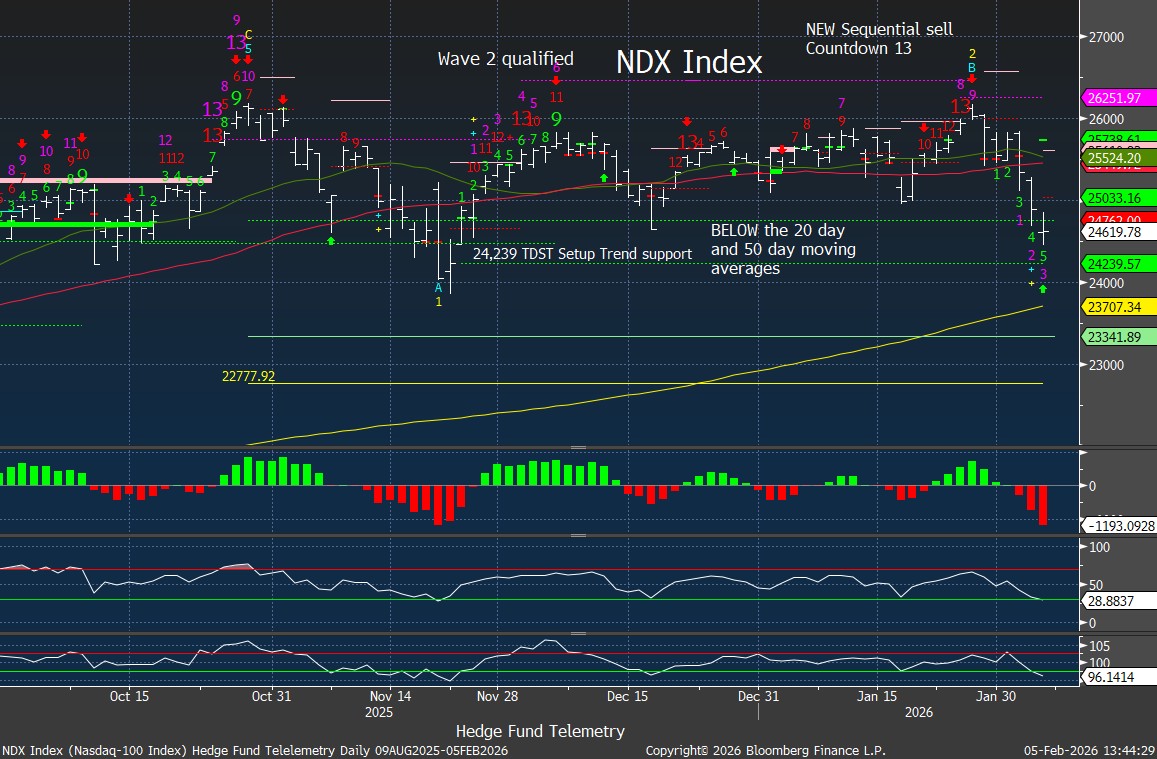
Nasdaq 100 Index daily closer to the TDST support which is most important right now
Current Portfolio
Short term SPY and QQQ momentum indicators remain on sell signals.
Bitcoin update
Bitcoin daily achieved the downside wave 5 price objective at 66k. Combo on day 11 of 13 will need several more new lows to qualify the 13 and the Setup 9 due tomorrow. Oversold yes, overloved and overlevered, yes
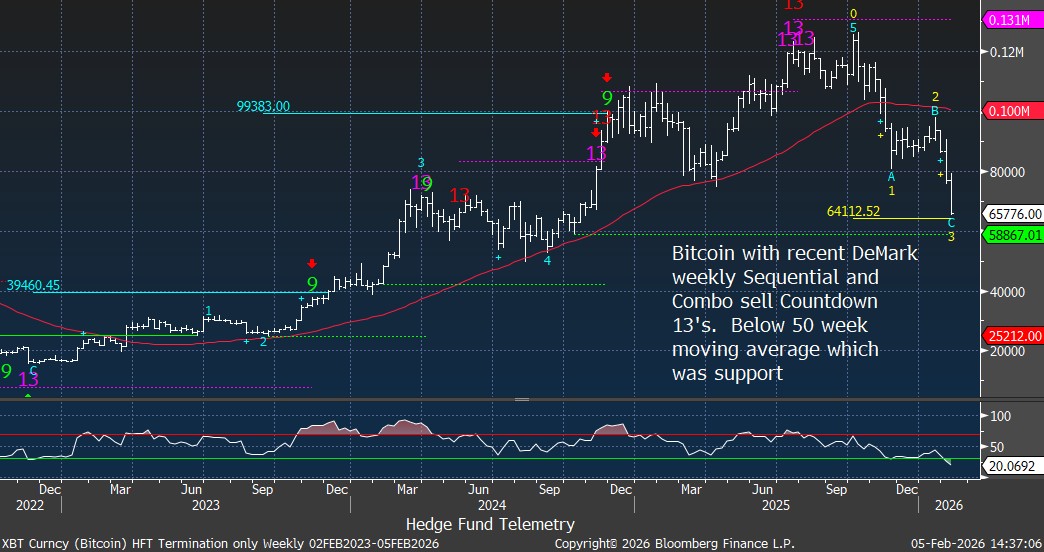
Bitcoin weekly is in wave 3 down near the downside wave 3 price objective. TDST support at 58,867 needs to be watched
The monthly inflows/ouflows for IBIT Bitcoin ETF shows 4 months of outflows with a lot more inflows that occurred at higher levels. Estimates are that the average price of Bitcoin ETF buyers is 81k. Trapped buyers? Definately a risk.
guest comments
My friend Kevin Cope, portfolio manager from C4M Global Advisors posted a new letter for his investors. Kevin is one of the brightest and deep thinkers I know in the markets. He is a value investor and had a strong ability to get into the weeds with ideas as well big picture themes. I highlighted some stuff from his last note and he allowed me to share a piece regarding early causalties in the coming credit crisis. Auto finance is something that interests me as I am short some Carvana. Carvana has been a monster on the upside and it was recently discovered a complex web of related companies with some questionable accounting practices.
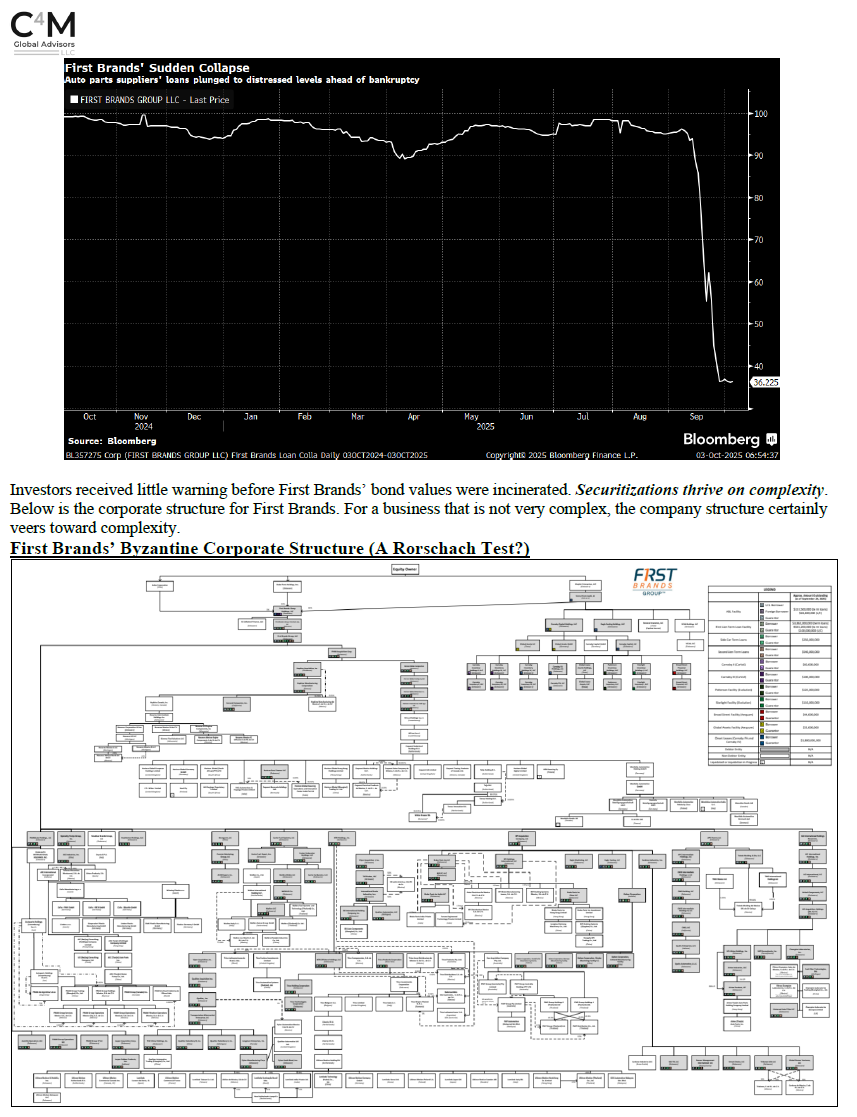
First Brands fell fast and has a “Byzantine corporate structure” or a Rorschach Test? Crazy!
Carvana went up big and the insiders sold stock and bought on the lows and have been active sellers on the way up. The end of the game might be coming up with the details of that report show the related companies (owned by the Dad) losing money while Carvana benefits. The related companies are now getting maxed out with leverage 20-40% so there isn’t much more room to run this game. Add in the SEC has already initiated an investigation.
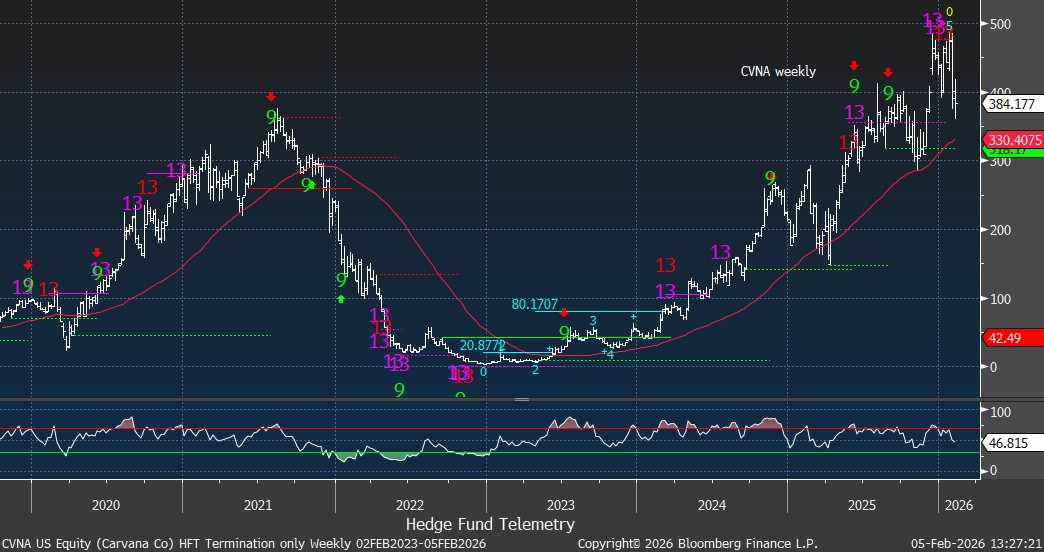
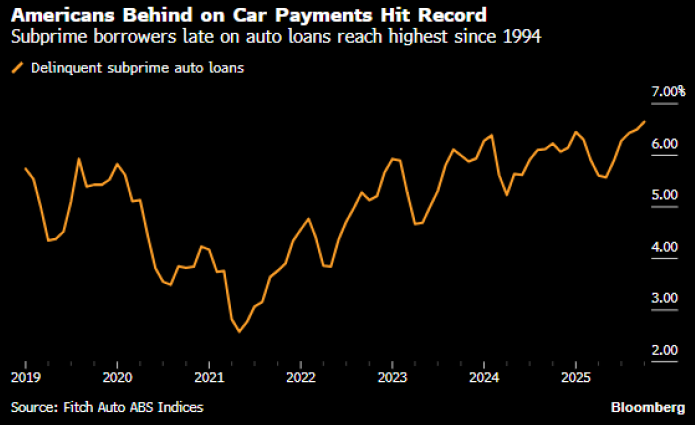
It has been so confounding for CVNA shorts since subprime auto loan delinquencies and repo’s have shot higher. There is a high level of short interest with 12% of the float short and 5 days to cover. So keep your sizing managable.
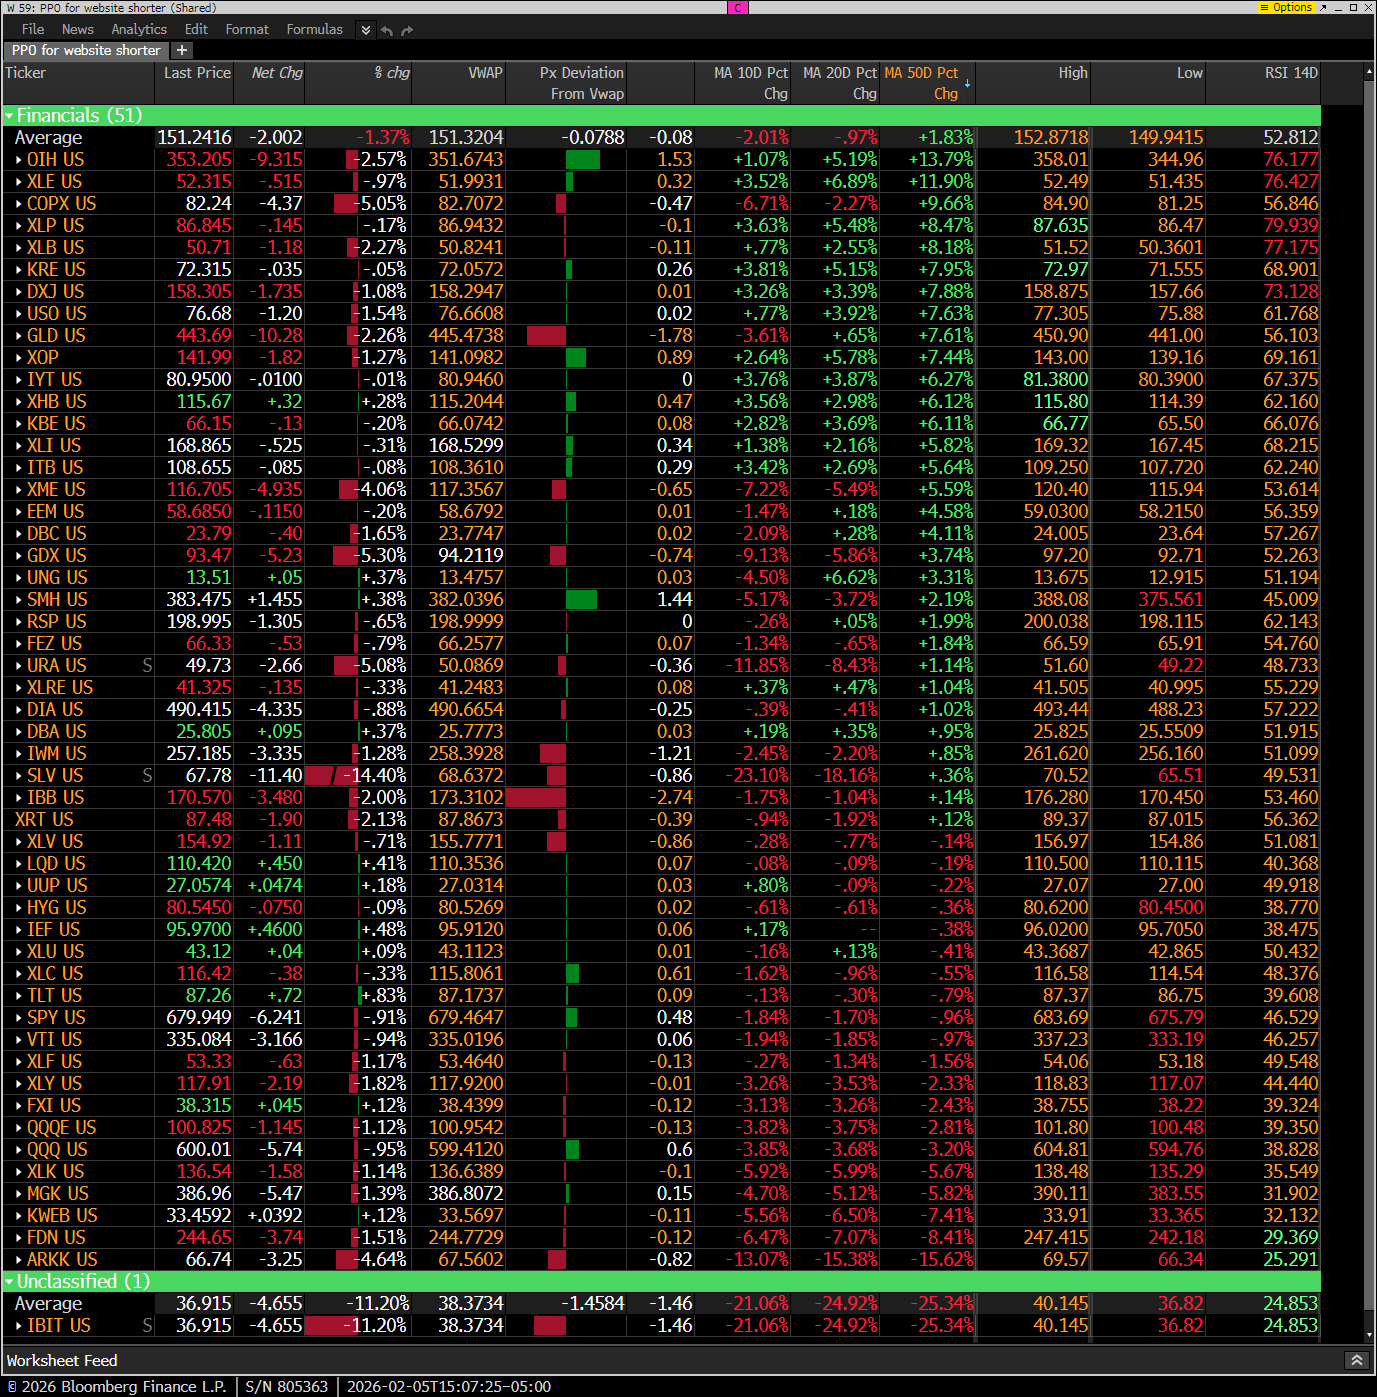
Hedge Fund Telemetry ETF Percentage Price Oscillator Monitor
The PPO monitor (percentage price oscillator) force ranks ETFs by percentage above/below the 50-day moving average. This monitor and others are offered to Hedge Fund Telemetry subscribers on Bloomberg. Starting to see more ETFs trabe below the 10 and 20 day moving averages as well some big ones under the 50 day. Seeing a lot more 20 day lows too.
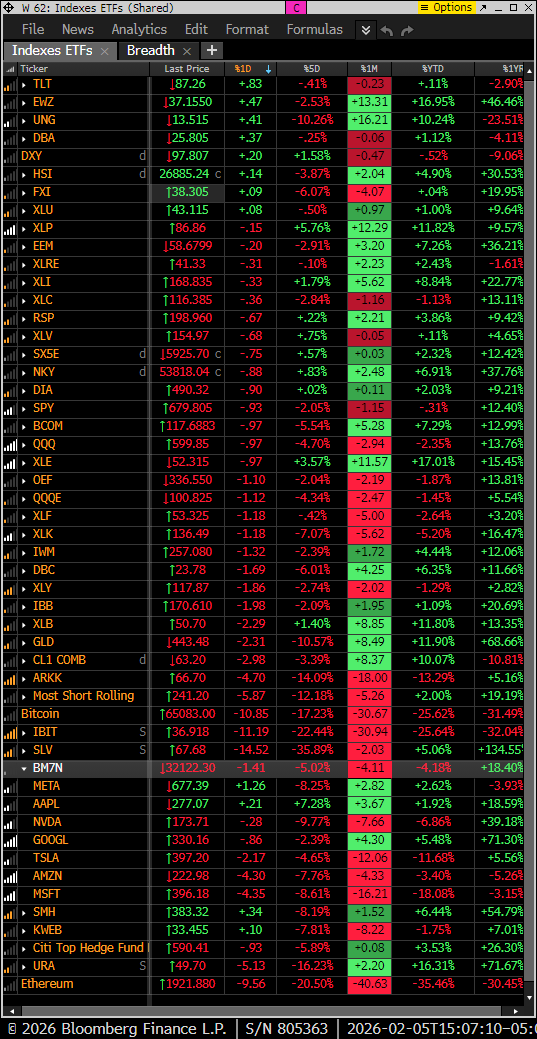
Index ETF and select factor performance
ETF with today’s performance with 5-day, 1-month, and 1-year rolling performance YTD. Not much working today
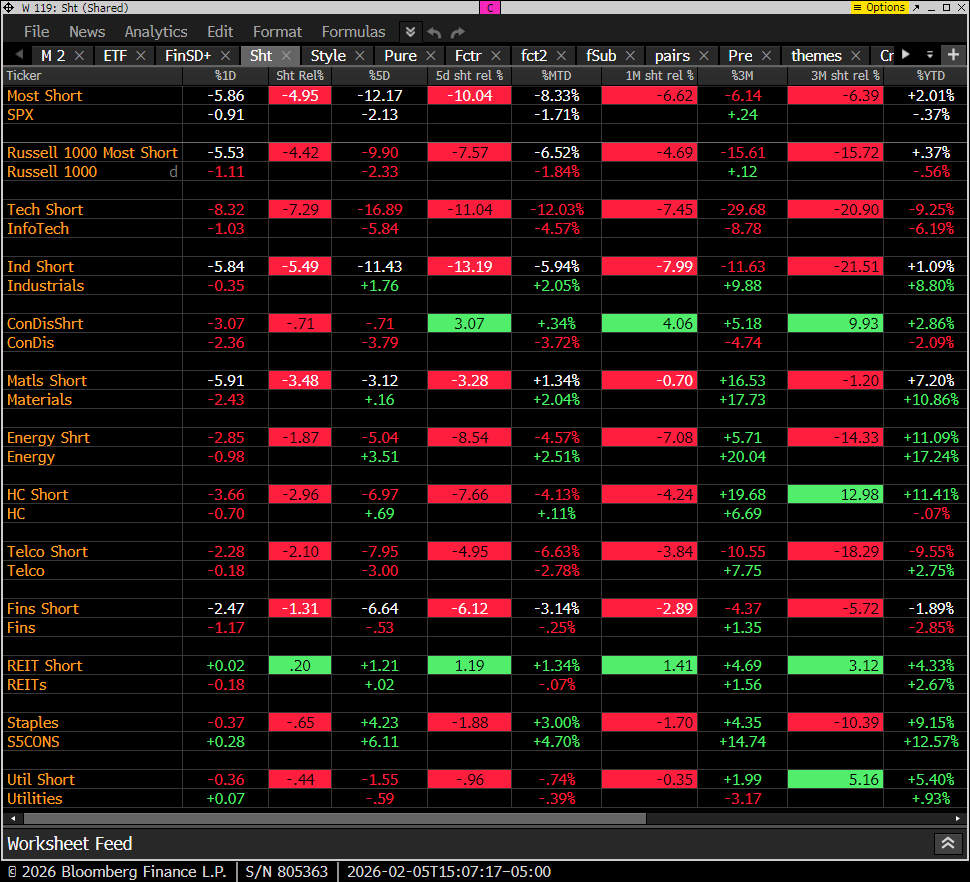
Goldman Sachs Most Shorted baskets vs. S&P Indexes
This monitor has the S&P indexes and the Goldman Sachs most shorted baskets. Short baskets have done well in the last week down 12% yet still is up 2% YTD
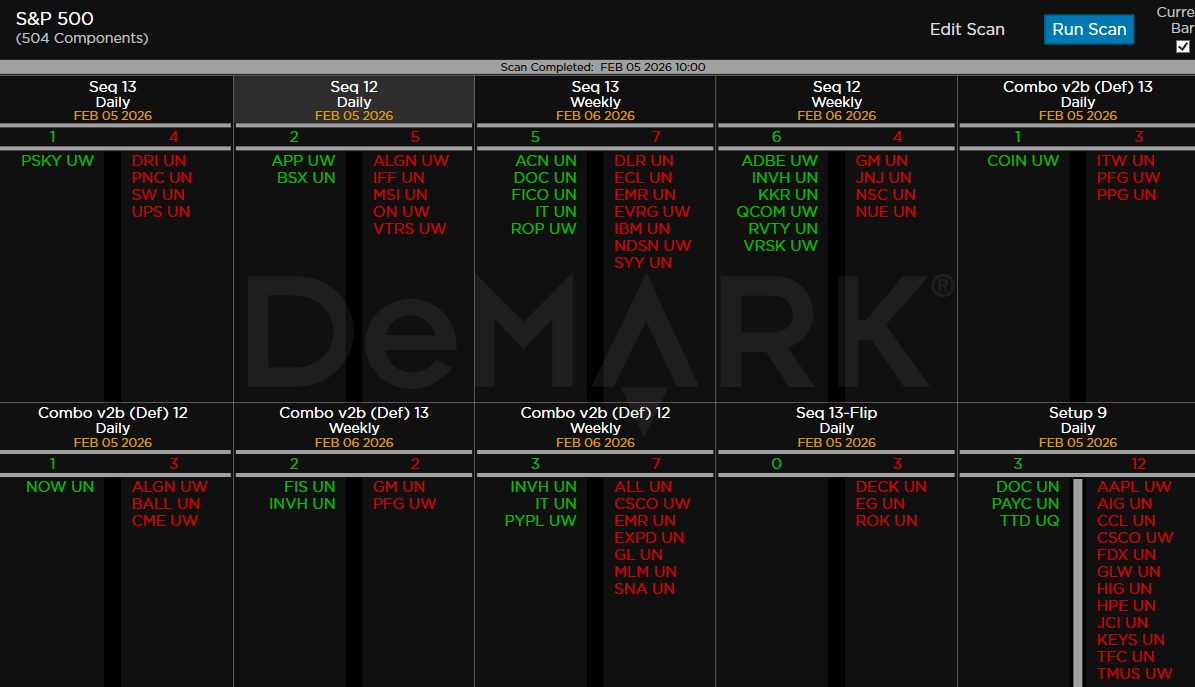
DeMark Observations
Within the S&P 500, the DeMark Sequential and Combo Countdown 13s and 12/13s on daily and weekly periods. Green = buy Setups/Countdowns, Red = sell Setups/Countdowns. Price flips are helpful to see reversals up (green) and down (red) for idea generation. The extra letters at the end of the symbols are just a Bloomberg thing.
Major ETFs among a 160+ ETF universe.

If you have any questions or comments, please email us. Data sources: Bloomberg, DeMark Analytics, Goldman Sachs, Street Account, Vital Knowledge, Daily Sentiment Index, and Erlanger Research