

Today, there is a Trump cabinet meeting that was televised (of course), and it didn’t seem like the recent comments that Iran wants to make a deal are exactly true. There wasn’t a Trump comment that some hoped would be another “TACO.” I wouldn’t doubt there have been some talks, but Iran isn’t backing down from all the comments coming out of the country. Stories of US troop deployments continue, as well as stories of Iran calling up 1 million to fight. Then this *IRAN HARDLINERS RAMP UP CALLS FOR NUCLEAR BOMB: SOURCES – RTRS. Scary headline for sure.
Getting a nuke is unlikely; putting together a dirty bomb is possible. Delivering either is difficult but not impossible. I said when this war started, we would see the markets shift narratives: Containment and escalation. Escalation risks remain, especially with Trump’s imposed deadline for Iran on Friday. Yesterday, I said the markets were untradeable, and today’s action proves the point.
The risk I see is equity indexes breaking or near-breaking support levels, with downside DeMark Countdowns in progress, while interest rates continue higher near breakout levels, with upside DeMark Countdowns in progress. It’s a dangerous technical setup. Also breaking down again are metals and Bitcoin – both seen as proxies for risk on, but not right now. Investors at times like this might want to hold gold or Bitcoin, yet have to sell anything not nailed down to raise liquidity.
From institutional sell-side desks, I am hearing little about concerns, panic, or even angst. People seem to be hoping things hold, and considering the S&P is only down 5%, and the S&P equal-weight is now fractionally down on the year, I can understand how large funds are trying to remain patient. The concentration in some areas, such as semiconductors, is seeing deep declines on news of GOOGL having AI solutions that would require less memory – a story that isn’t exactly new. This is also hitting the NVDA/OpenAI group, which I would throw META in there too. Yesterday, there was little reaction to a lawsuit that went against META and GOOGL’s YouTube that accused them of creating addictive apps that harmed kids. I’d say that was fairly obvious, but it’s more than just kids on social media. It’s more of a societal thing, and for us in the markets, following one person who can move markets on Truth Social has been mandatory.
Tomorrow I will do a run down on all the indicators, sentiment and internals to lay out how oversold things are and when I see a durable bounce potential. I especially want to see the data after today.
Regarding the Big Picture note. Wow, the number of subs that added the note was overwhelming and gratifying. I explained more about it on First Call but a few things. Stripe our credit card processor has been running slow and caused two issues for a few people – notably slowness and an error message after the charge went through and people were signed up. Some people hit the send button twice and duped payments. We’ll get those sorted so have no fear. The number of people who took the 2 year discounted rate was about 90% vs the 1 year. Thanks for your confidence and I promise this will be a useful note packed with a lot of info.
If you would like to sign up:
$250 / year or $400 for a two-year discount option Use this link to sign up now.
This is the introductory pricing for the first 1000 subscribers. I have also been told I have underpriced this, so I can and will raise prices in the future. If you sign up for the introductory price offer, it will renew at this price for life.
The focus will shift between equities, macro, rates, commodities, and currencies depending on where the most important opportunities and risks exist. Here’s the March Big Picture note. If you have any questions or issues signing up reach out by email to info@hedgefundtelemetry.com
Quick Market Views
Stocks: Breadth is not good but not horrible with NYSE down 2200 net issues and Nasdaq down 1750 net issues. S&P has 190 up and 312 down – not dire but getting worse through the afternoon. Mag 7, however, is down 4%, so the concentration in the market is getting sold.
Bonds: Rates continue higher with 2’s up 10bps nearing 4%, 10’s are up 8bps above 4.4% and 30’s are up just 3bps at 4.93% with 5% as the alarm bell level to watch.
Commodities: Energy is higher, metals lower. Crude up 4.5%, Natural Gas up 1.3%, Copper down 1.75%, Gold down 3.6%, Silver down 7%.
Currencies: US Dollar Index is near 100 up 0.3%. Bitcoin is down 3.6% at 68,400
Current Portfolio Ideas: New high water mark for 2026 +7.6% vs S&P -5%. 8% cash, 52% net short.
Changes: None. Plenty of ideas on the sheet that I continue to discuss and like.
I still have the recent three put spread ideas expiring on April 10th. SPY 645-630ps. QQQ 580-565ps. TSLA 365/350ps
Thoughts: I love the news today with Golar. The management is hiring GS to explore ways to increase shareholder value. Some people asked if they should buy now. I added earlier, as I mentioned on First Call. If you are not in and didn’t pick up my 1000 calls to buy this over the last 2 years, add 2-3% and hope to buy more on a pullback under 50. I am comfortable with the long side (what’s left of it after trimming some recently). On the short side most are moving in the right direction with memory chips falling hard. We need to see more downside of course and will for sure get some sharp bounces, yet I will hold these and cover lower. It’s when the crowded names get sold, and bounces fail the buy-the-dip crowd that’s needed.
US INDEXES
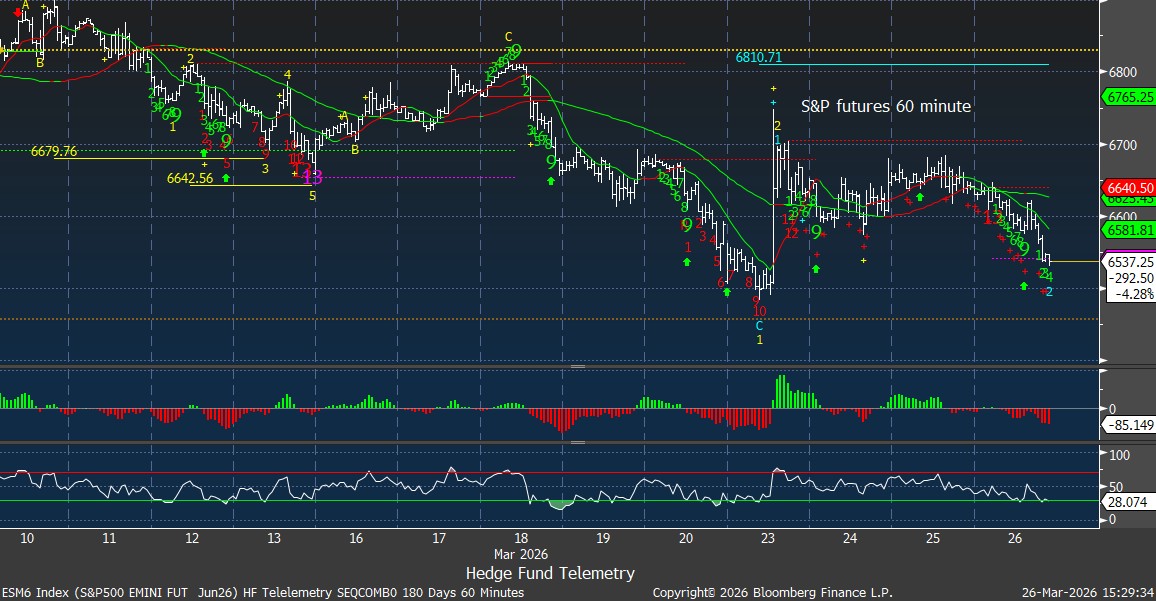
S&P futures 60-minute tactical time frame is still above early Monday’s lows at 6500. Below this level and some fear could creep into the markets.
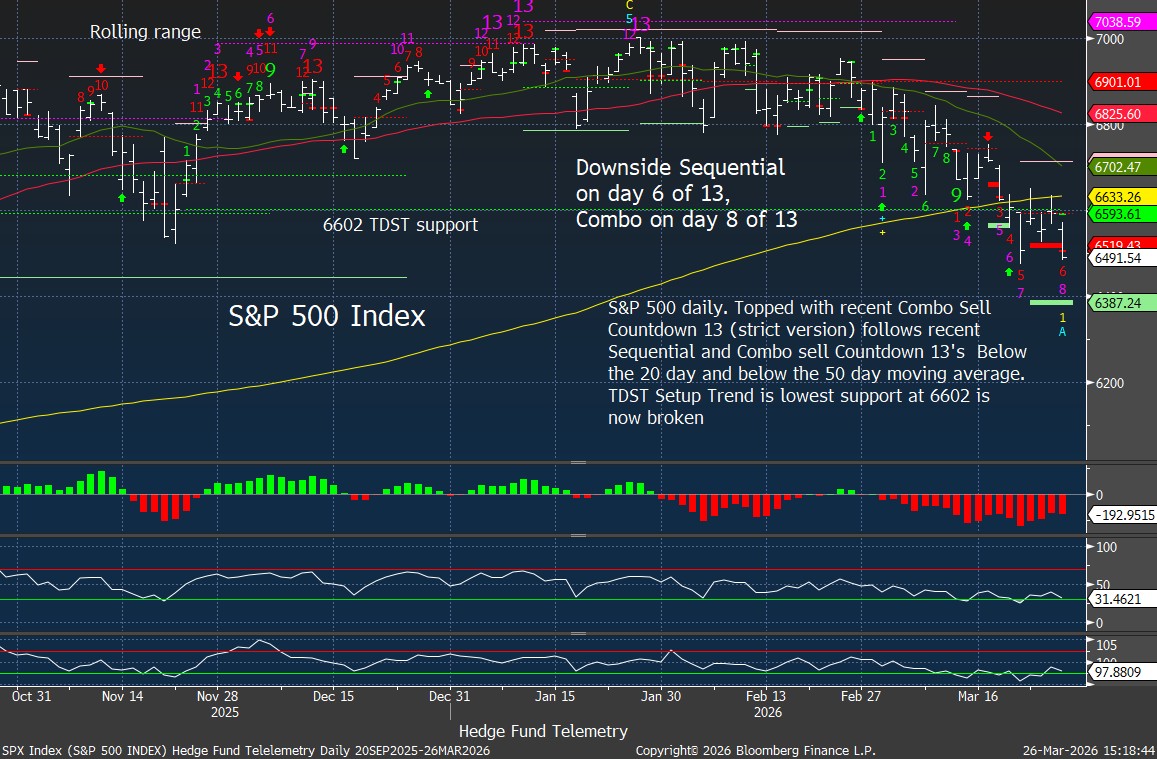
S&P 500 Index daily with downside DeMark Sequential and Combo Countdowns in progress. Potential new downside Propusion target of 6387 is qualified but will need to confirm tomorrow – I’ll let you know if it confirms. This is one of DeMark only indicators that works on offense vs defensive exhaustion signals.
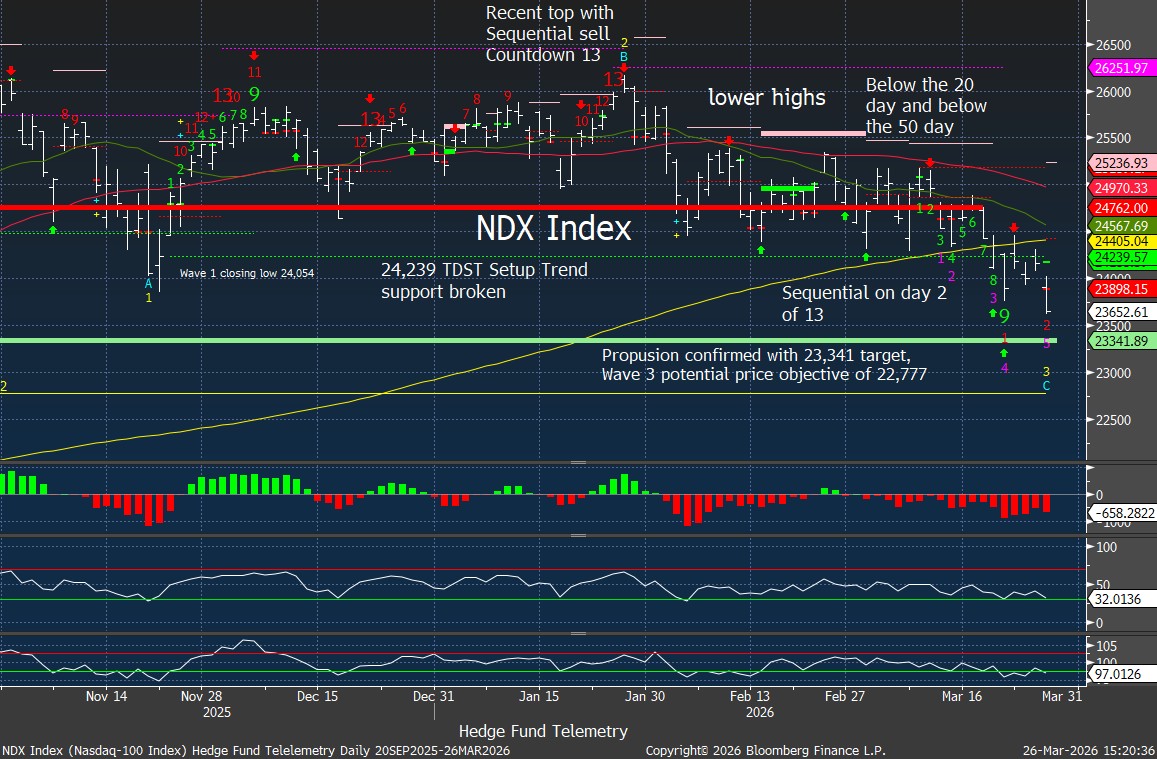
Nasdaq-100 Index breaking daily lows, with a potential start of a new Sequential on day 2 of 13. Downside wave 3 and Propulsion downside targets.
Current Portfolio
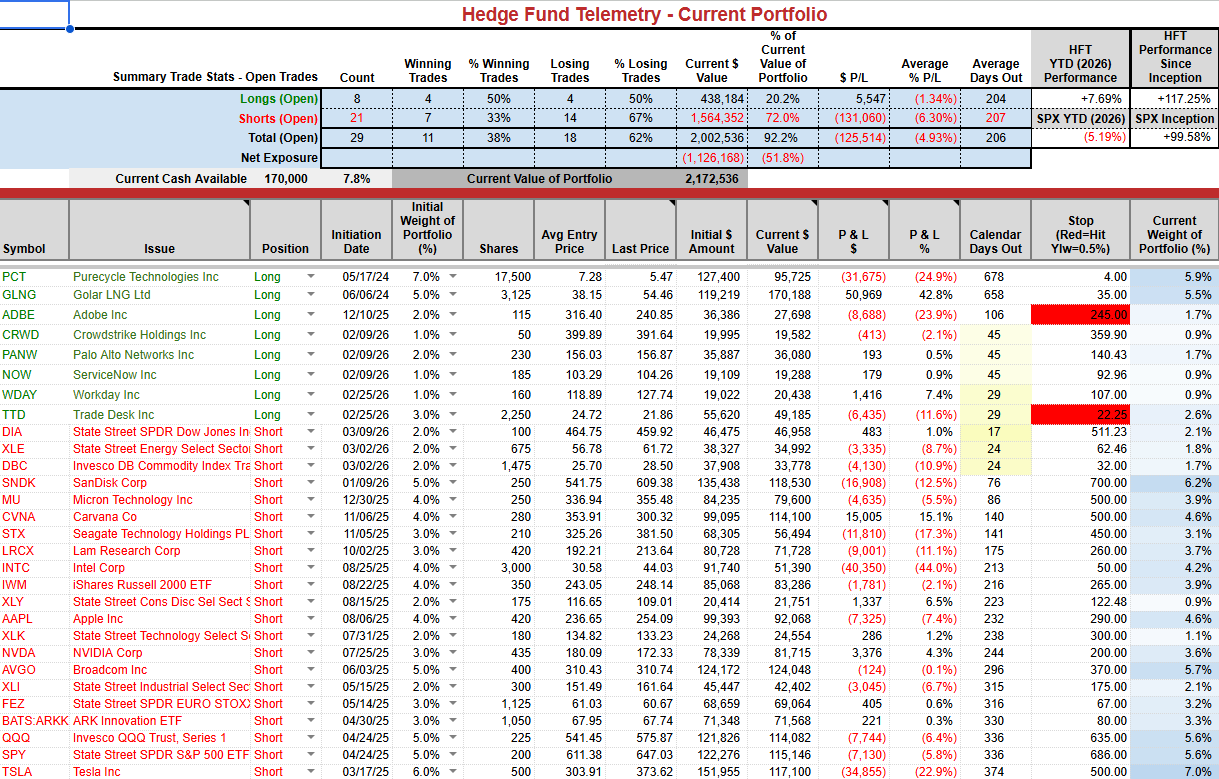
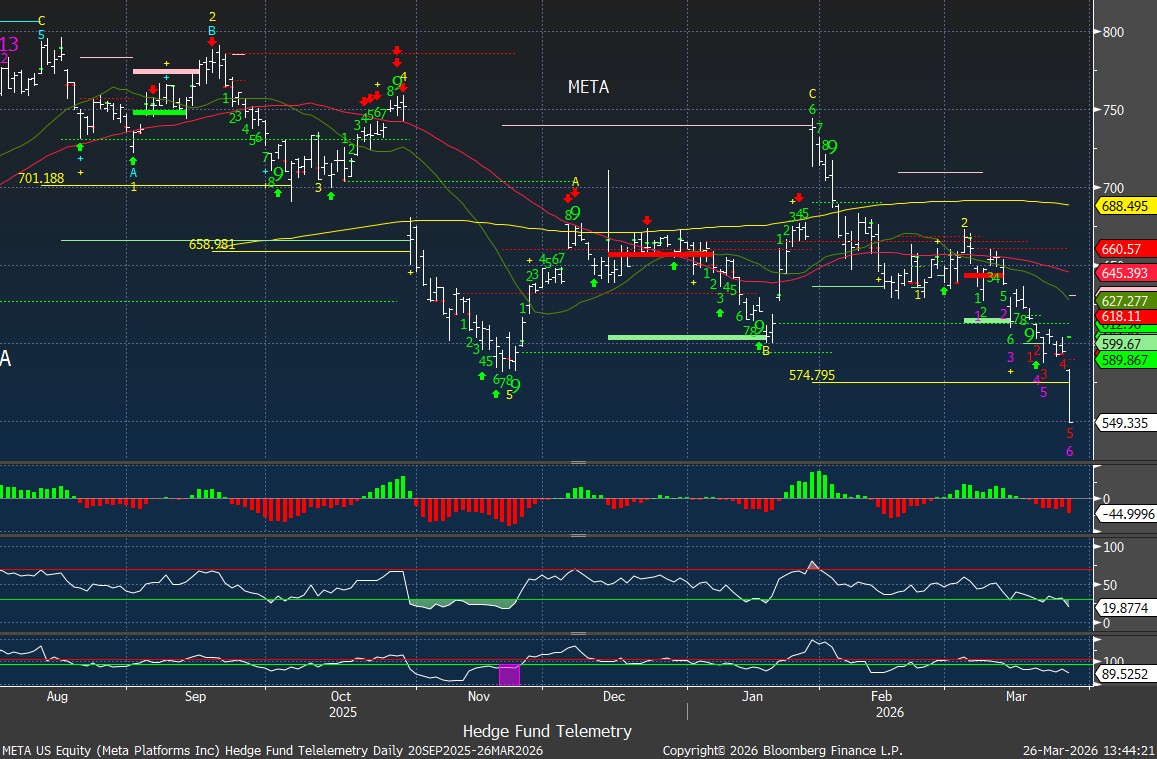
I’m not short META but it looks terrible with a downside Sequential in progress
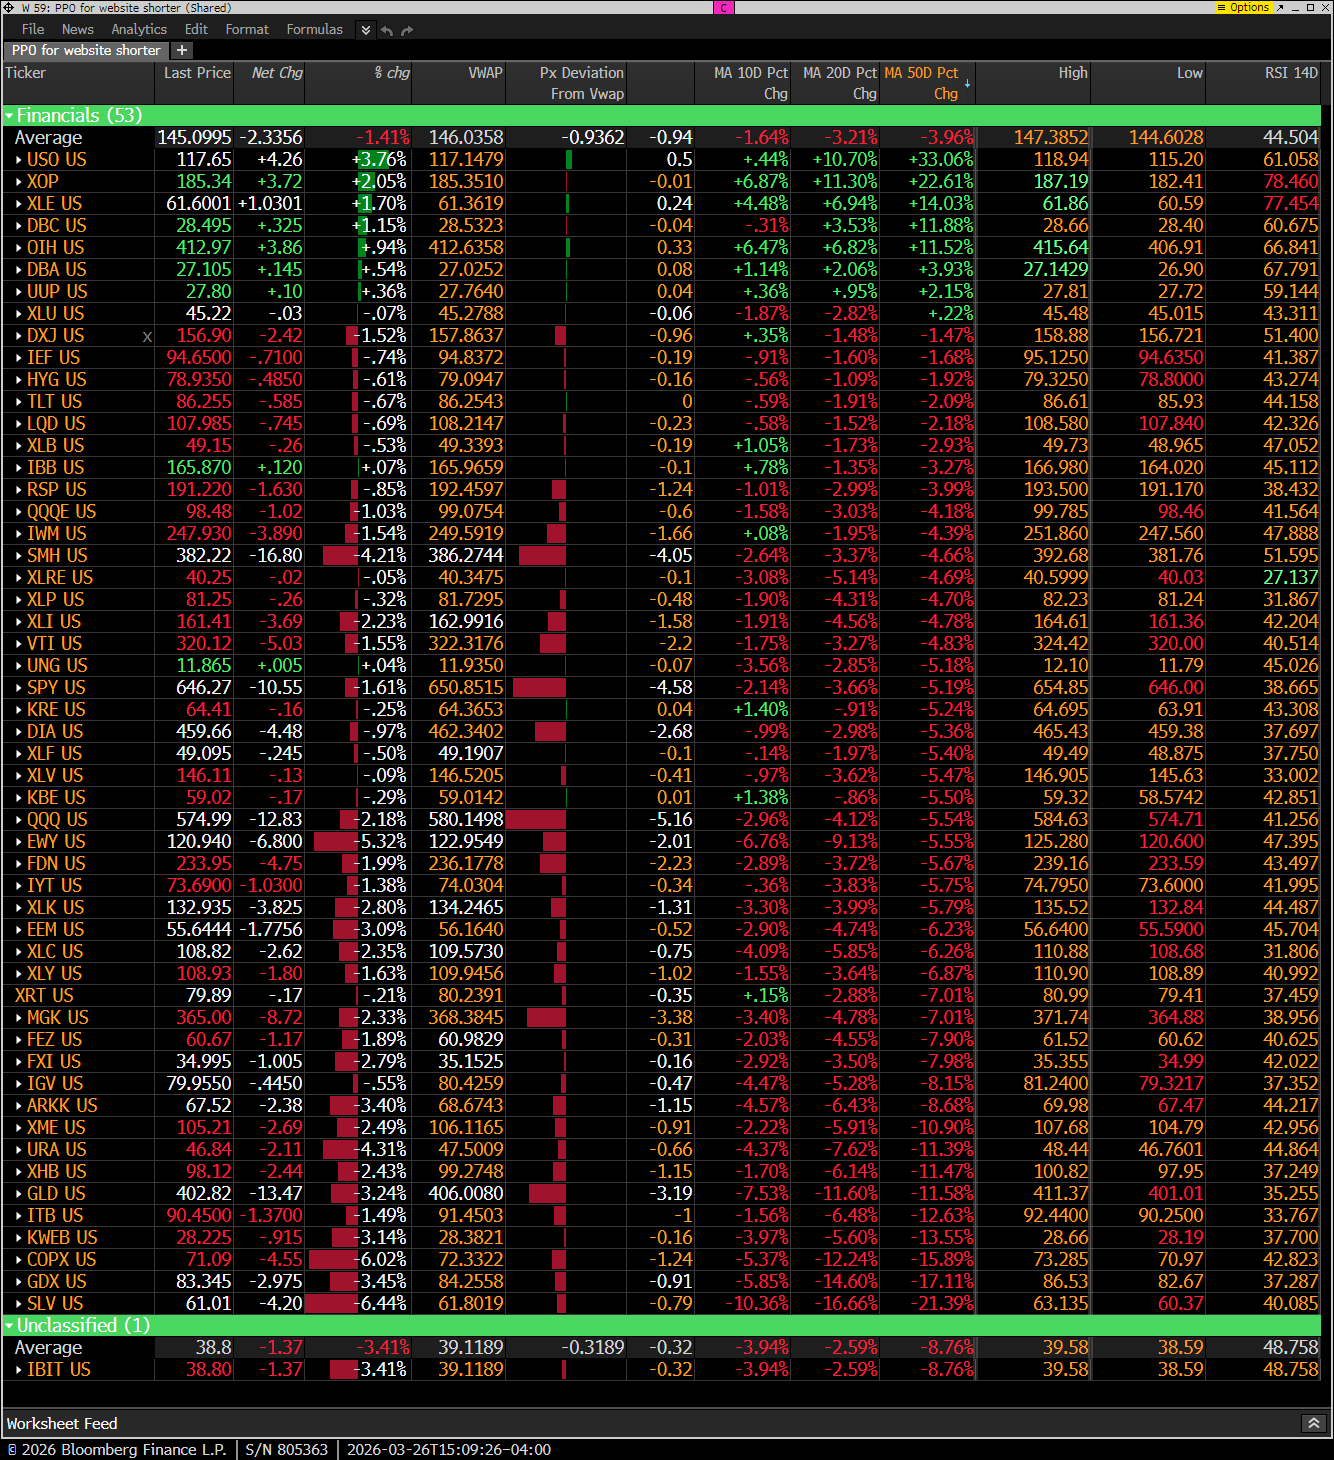
Hedge Fund Telemetry ETF Percentage Price Oscillator Monitor
The PPO monitor (percentage price oscillator) force ranks ETFs by percentage above/below the 50-day moving average. This monitor and others are offered to Hedge Fund Telemetry subscribers on Bloomberg. What is up today is what remains above the 10, 20, 50 day – exactly what you would expect with the rest getting crushed. SLV is now 21% below the 50 day and recall I highlighted it being overbought when it was 45% above the 50 day.
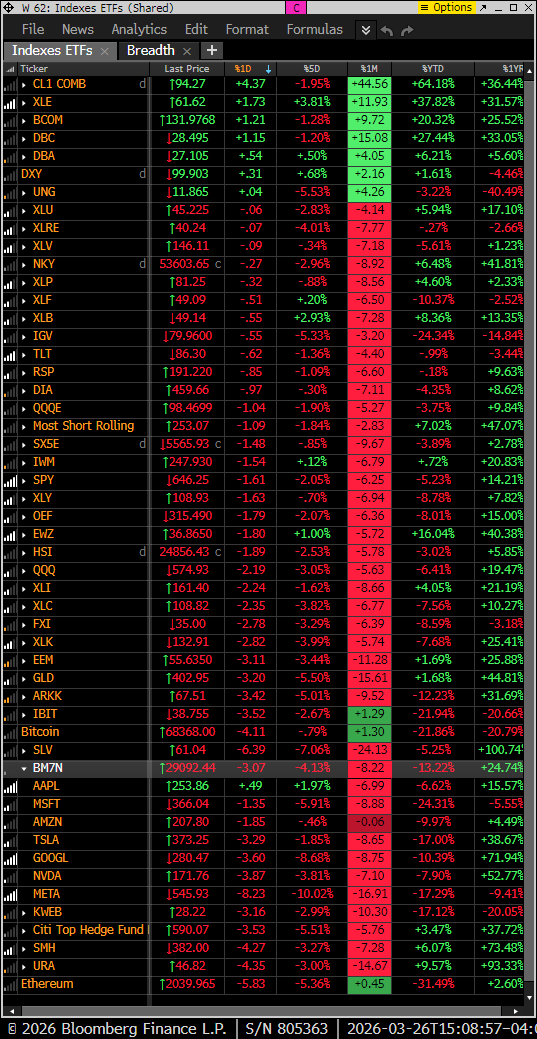
Index ETF and select factor performance
ETF with today’s performance with 5-day, 1-month, and 1-year rolling performance YTD. Fairly clear that what has been working in the last month is what’s up today.
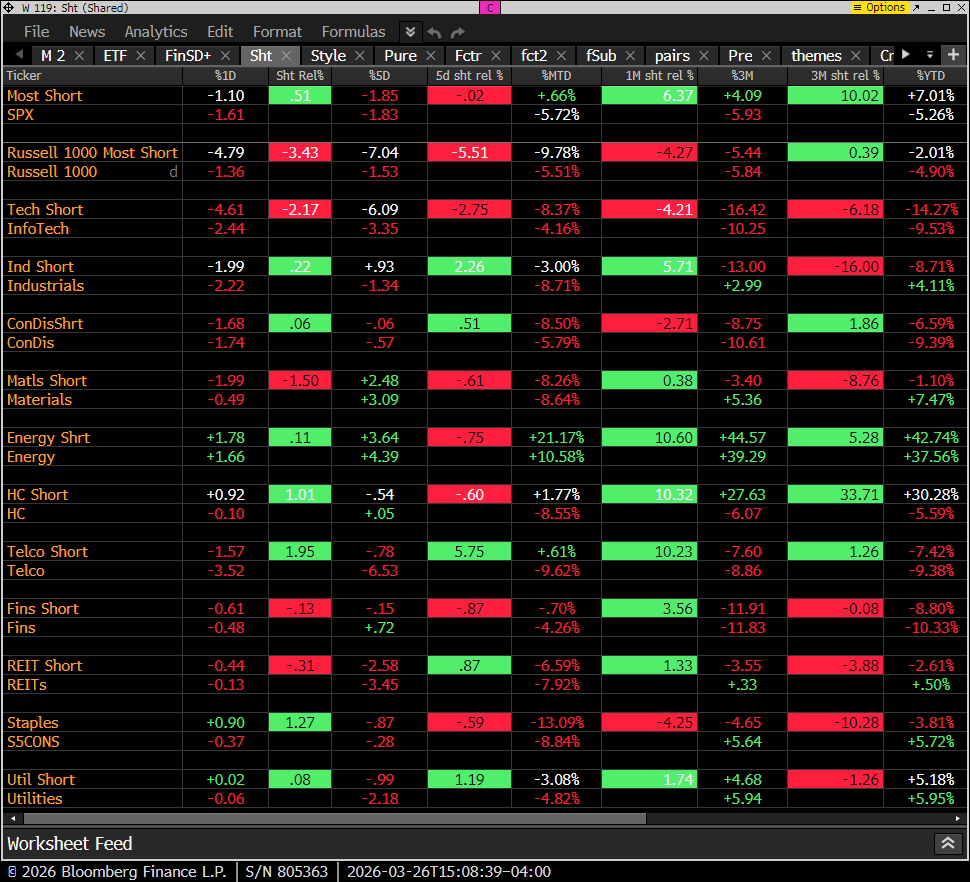
Goldman Sachs Most Shorted baskets vs. S&P Indexes
This monitor has the S&P indexes and the Goldman Sachs most shorted baskets. Most short baskets are down on the day ex energy, hc, staples
DeMark Observations
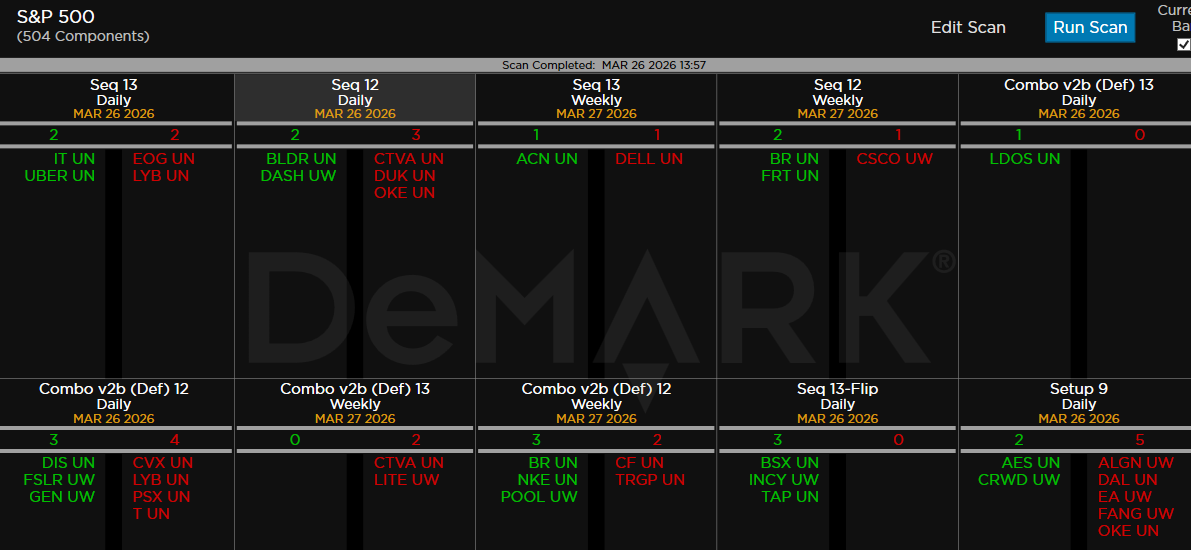
Within the S&P 500, the DeMark Sequential and Combo Countdown 13s and 12/13s on daily and weekly periods. Green = buy Setups/Countdowns, Red = sell Setups/Countdowns. Price flips are helpful to see reversals up (green) and down (red) for idea generation. The extra letters at the end of the symbols are just a Bloomberg thing. Worth noting: A few buy and sell signals yet no patterns yet.
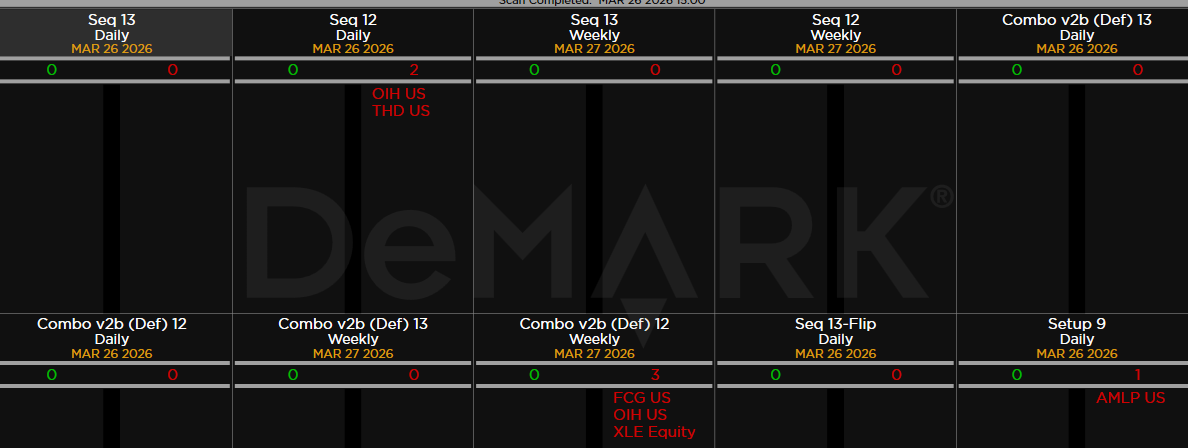
Major ETFs among a 160+ ETF universe. No buy signals yet
If you have any questions or comments, please email us. Data sources: Bloomberg, DeMark Analytics, Goldman Sachs, Street Account, Vital Knowledge, Daily Sentiment Index, and Erlanger Research