
I’ve only mentioned this new Big Picture note to current subscribers, so this is being sent to all subscribers, not just those who signed up for it. If you would like to sign up for the Big Picture note, which has seen a huge number of subs adding (thank you – super grateful), use this link If you have any questions, please reach out by email.
Late March 2026
The April edition will hit this week or next weekend – I’d rather not put a publish date on things, i.e., day one of each month, rather let the new quarter start and see if there are any changes. The next 13F hedge fund holdings release for Q1, due in mid-May, should be interesting.
Summary
The market is transitioning from late-cycle complacency to early-stage disorder.
- Equities are breaking down across timeframes (daily → weekly → monthly exhaustion now resolving lower)
- Sentiment has reached oversold, but internals and positioning have not fully capitulated
- Rates remain restrictive, preventing stabilization
- Geopolitical risk is no longer a tail — it is the macro driver
This is not yet a durable low. It is the process of finding one.
The critical shift:
Markets are no longer trading on liquidity + AI narrative — they are now trading on:
- rates
- energy shock risk
- policy/geopolitical uncertainty
- Social media from the President – It pains me to admit this
Portfolio bias:
- Tactical, not directional
- Fade strength, not weakness (until capitulation completes)
- Preserve liquidity optionality
Hedge Fund Telemetry Market Dashboard
As I have expressed in other notes, the risk is elevated, some but not enough is breaking to levels that could signal a buyable bounce. Risk with positioning and complacency is absent a capitulation, which has the scoreboard, fragility, and roadmap likely with lower equity levels. There will be bounces, yet the determination of a bear market head remains uncertain; the risk of that occurring is increasing regardless of the situation in Iran. The March jobs data on Friday will have everyone watching, yet with markets closed (except futures), it could set the tone for April and through the next intermediate time frame.
Macro Score: -3
Fragility Score: 8
Sentiment: Oversold (but incomplete). Sentiment is a condition and not by itself a trigger
Liquidity Trend: Deteriorating
Interpretation:
This is a fragile, late-cycle unwind, not a reset low.
Sentiment has moved quickly, but the structure beneath it (rates + internals) has not confirmed a washout.
The Charts That Matter Most
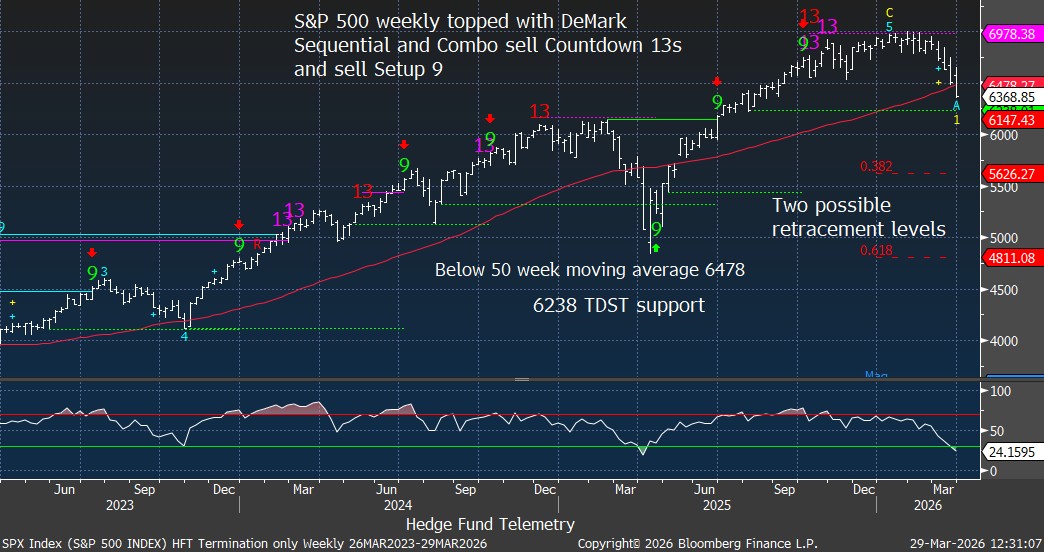
S&P 500 Weekly – DeMark 13 Cluster from October → Breakdown now reversing under the 50-week with two retracement levels that fall into the base case downside levels. One caveat is that a DeMark Setup 9 might occur this week, and the last one caught a bounce. I’d like to see an elevated number of S&P stocks with Sequential 13’s, so stay tuned to the DeMark Observations on the notes – something that is absent right now.
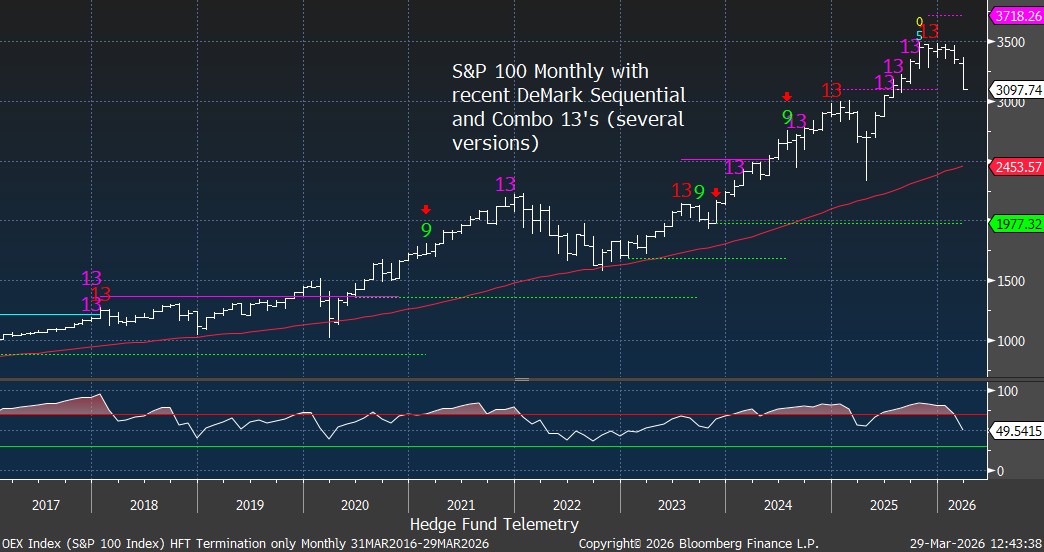
S&P 100 Monthly – Multiple 13s at highs
The “meat of the market” mega cap with a drop after recent exhaustion signals. At best, this stabilizes and moves sideways; at worst, a move to the 50-month at 2450 is possible.
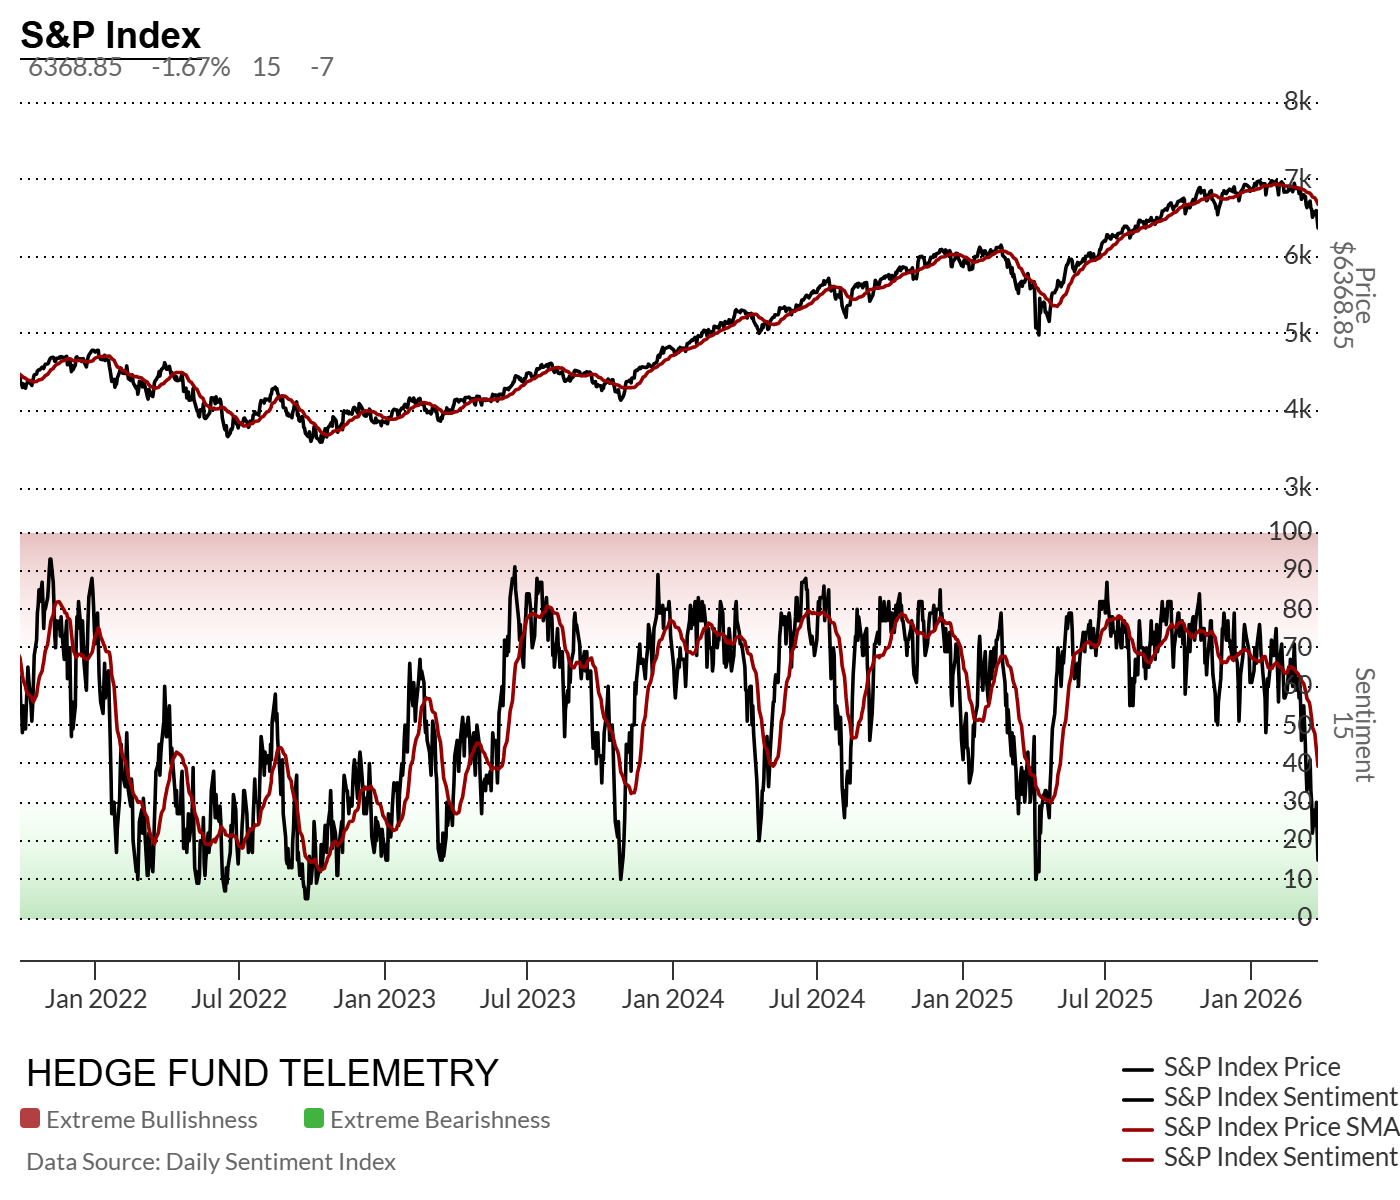
Equity Sentiment – Collapse to ~15%
This is a positive for a mean reversion bounce; however, not every collapse sees V bottoms, as the 2022 bear market chopped painfully, mostly under 50% for the whole year.
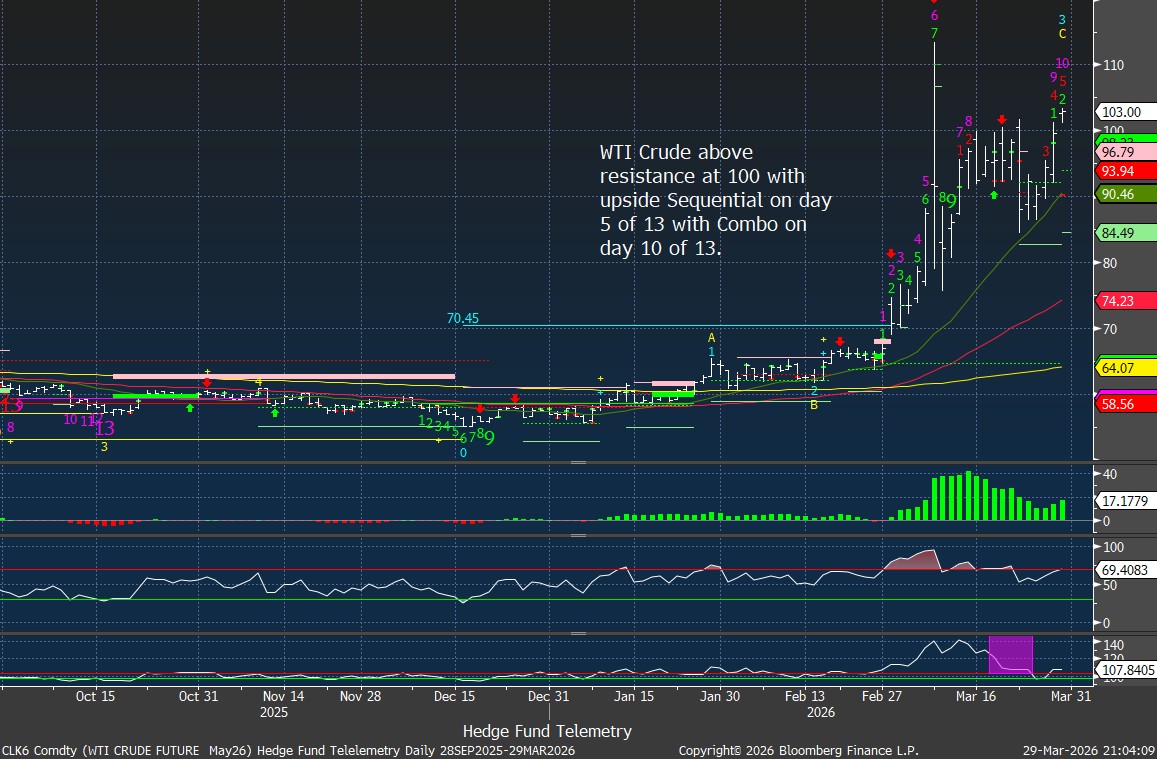
Crude Oil – Vertical move with extreme sentiment (85)
→ Crowded inflation shock trade with upside DeMark Countdowns in progress.
hedge fund telemetry Macro Scoreboard
Risk remains high.
| Category | Indicator | Score | Comment |
|---|---|---|---|
| Liquidity | Global liquidity trend | -1 | Tightening via rates + balance sheet |
| Monetary Policy | Central bank stance | -1 | Restrictive, optional tightening remains |
| Economic Growth | Global momentum | 0 | Slowing but not collapsing |
| Market Internals | Breadth | -2 | Clear deterioration |
| Sentiment | Positioning | +1 | Fast reset but not washed out |
| Valuation | Equity valuations | -1 | Still elevated vs rates |
| Credit | Credit spreads | 0 | Not yet stress signaling |
| Geopolitics | Global risk | -2 | Escalating and systemic |
Macro Score Total: -6 → High Risk
Interpretation:
The system is shifting from late-cycle expansion → instability phase.
Market Fragility Index
It’s not horrible yet.
| Fragility Factor | Signal | Score | Comment |
|---|---|---|---|
| Market Concentration | Extreme | 2 | Mega-cap dominance rolling |
| Leverage | Elevated | 1 | De-risking underway |
| Sentiment | Recently complacent | 1 | Reset in progress |
| Liquidity | Tightening | 2 | Core constraint |
| Valuation | Elevated | 1 | Still above neutral |
| Credit | Stable (for now) | 1 | Watch closely |
| Volatility | Rising | 0 → 1 | Transition phase |
Fragility Score: 8 → Elevated Fragility
Interpretation:
The market is vulnerable to air pockets, especially if forced selling accelerates.
12-Month Market Roadmap
Increase % to 50% in the base case downside risk zone.
| Scenario | Probability | Range | Drivers |
|---|---|---|---|
| Bull | 25% | 6500–7000 | De-escalation + rate decline |
| Base | 50% | 5200–6500 | Volatility + range + slow growth |
| Bear | 25% | 4800–5200 | Escalation + inflation shock + tightening |
Key insight:
Even in the bull case, upside is capped (prior ceiling ~6900–7000 already rejected).