
THE BIG PICTURE beta
I am excited to announce The Big Picture – our new note that we’ve had huge positive feedback from those fund managers/individual investors who previewed the early note examples. This is a beta version, so a few things might change, but I think you’ll really like it and find it very useful, especially some of the new risk tables/frameworks. If you have any thoughts or suggestions, please let me know.
What It Is
The Big Picture is a monthly strategic market report designed to identify major market inflection points before they become obvious. The report also includes 1–2 interim updates during the month if market conditions materially change.
It includes:
- Market Fragility Map
- Hedge Fund Telemetry Market Scoreboard
- 6-12 Month Probability Framework
- DeMark exhaustion signals
- Hedge Fund Telemetry sentiment monitors
- Cross-asset market structure
- Macro catalysts and positioning
The goal is simple:
Map where risk is building and where opportunity is emerging over the next 6–12 months.
Who It’s For
Designed for investors who think like portfolio managers, not day traders. Best suited for:
- Hedge funds
- Professional traders
- Asset allocators
- Family offices
- Serious individual investors
How to Use the Report
Market Fragility Map
Identifies where markets are most vulnerable to sharp repricing.
| Market | Fragility | Directional Risk | Key Driver |
|---|---|---|---|
| S&P 500 | Medium | Downside skew | Sentiment stretched |
| Nasdaq / AI | High | Downside risk | Crowded positioning |
| Treasuries | Medium | Upside risk | Growth slowdown |
| Dollar | Low | Neutral | Policy divergence |
| Commodities | Medium | Upside skew | Supply constraints |
Hedge Fund Telemetry Market Scoreboard
A quick snapshot of overall market health.
| Indicator | Reading | Interpretation |
|---|---|---|
| Sentiment | Elevated | Risk of reversal |
| DeMark Signals | Building | Late-cycle behavior |
| Market Breadth | Weakening | Narrow leadership |
| Liquidity | Neutral | Watch policy |
| Macro Risk | Rising | Event-driven volatility |
6–12 Month Market Probability Framework
| Scenario | Probability |
|---|---|
| Continued Bull Market | 35% |
| Range-Bound / Volatile Market | 40% |
| Major Correction | 25% |
Probabilities adjust as conditions evolve.
Why It Matters
Daily research explains what is happening today.
The Big Picture explains where markets are likely headed next. It filters out the day to day noise.
It provides the strategic framework behind Hedge Fund Telemetry’s daily research.
Pricing – signups will start soon
Hedge Fund Telemetry Current Subscribers
- $250 / year
- $400 for two years
For non-current Hedge Fund Telemetry subscribers who want a stand alone note:
- $500 / year
Introductory Offer: The first 1,000 subscribers receive: $250 per year — locked in for life
This is the beta launch of the Big Picture. The framework will continue to evolve with:
- expanded market probability models
- deeper cross-asset analysis
- enhanced fragility mapping
The focus will shift between equities, macro, rates, commodities, and currencies depending on where the most important opportunities and risks exist.
Markets change regimes. The Big Picture is designed to help investors see those regime shifts early.
Please let me know your thoughts and suggestions. So with that intro, let’s begin!
The Big Picture Summary
The market has shifted from a benign, liquidity-driven advance to a more fragile macro regime defined by geopolitical supply-shock risk, tighter financial conditions, narrow leadership, and growing skepticism that policy can quickly neutralize the latest exogenous stress. The Iran conflict and the Hormuz disruption have introduced a new inflationary impulse through energy and broader input costs, just as investors were already grappling with excess AI capex, private credit deterioration, and rich equity valuations.
The key takeaway is that risk assets are no longer trading within a clean disinflation/soft-landing framework. Instead, markets are facing a more complicated mix of slower growth, sticky inflationary pressures, and diminished confidence that rates will serve as the usual shock absorber during equity drawdowns. That matters because it increases the odds that volatility persists even if there is a tactical geopolitical-relief rally.
Our bias is cautious but not outright bearish in the very near term. A headline-driven squeeze remains possible if Washington signals an off-ramp with Iran, but the probability of a sustained breakout above recent highs appears lower than that of a further downside rotation beneath the surface. Internals have weakened materially. DeMark exhaustion signals remain relevant on longer time frames; sentiment is deteriorating rather than washed out; and cross-asset behavior suggests fragility is building faster than the index level alone indicates.
Portfolio Bias
- Maintain a more defensive posture within equities.
- Reduce exposure to crowded mega-cap / AI-linked leadership on strength.
- Favor real assets, energy, selective commodities, and cash optionality.
- Stay tactical around relief rallies, but do not confuse squeezes with durable regime repair.
Hedge fund telemetry Macro Scoreboard
| Category | Indicator | Score | Comment |
| Liquidity | Global liquidity trend | -1 | Oil shock and tighter financial conditions are offsetting any residual liquidity support |
| Monetary Policy | Central bank stance | -1 | Markets have repriced Fed cuts materially lower as energy pressure rises |
| Economic Growth | Global growth momentum | -1 | Growth faces simultaneous oil, tariff, and confidence shocks |
| Market Internals | Breadth and participation | -2 | Internals have weakened sharply beneath headline index levels |
| Sentiment | Investor positioning | 0 | Positioning is more defensive, but not fully capitulative |
| Valuation | Equity valuation vs history | -1 | Multiples remain rich relative to the macro backdrop |
| Credit | Credit spreads and risk | -1 | Private credit stress and collateral markdown concerns are building |
| Geopolitics | Global geopolitical risks | -2 | Hormuz disruption is a first-order global macro risk |
| Macro Score Total | -9 | High-risk macro backdrop |
Interpretation: On the formal score, the environment screens as high risk. The largest negatives are geopolitical risks, internal market deterioration, and the loss of policy flexibility due to higher energy prices. A sharp tactical rebound is always possible, but the macro framework no longer supports complacent equity positioning.
Score Range Guide
| Score Range | Environment |
| +6 to +10 | Strong risk-on |
| +2 to +5 | Moderately bullish |
| -1 to +1 | Neutral |
| -2 to -5 | Risk rising |
| -6 to -10 | High risk |
Market Fragility Index
| Fragility Factor | Signal | Score | Comment |
| Market Concentration | Large-cap dominance still elevated | 2 | Leadership remains too narrow |
| Leverage | Speculation / crowded exposure | 1 | AI and high-beta crowding remain important |
| Sentiment | Not fully fearful | 1 | Positioning has cooled but not capitulated |
| Liquidity | Tightening financial backdrop | 2 | Oil and hawkish repricing are draining flexibility |
| Valuation | ERP compressed | 1 | Expensive market given the regime shift |
| Credit | Private credit strain | 1 | Negative feedback loops are building |
| Volatility | VIX rising but not panic | 0 | Anxiety is higher, but not yet disorderly |
| Fragility Score Total | 8 | Elevated fragility |
Interpretation: The market is fragile, but not yet in full crash mode. The core issue is that concentration, valuation, and liquidity stress are interacting with a geopolitical shock. That leaves the market vulnerable to gap risk and failed rebounds even if volatility has not yet fully exploded.
Fragility Guide
| Score | Interpretation |
| 0–3 | Stable market |
| 4–6 | Fragility building |
| 7–10 | Elevated fragility |
| 11+ | Crash risk environment |
6 – 12 Month Market Roadmap
Most managers want the choices of a bull, base, and bear case probability. Here’s how I see it.
| Scenario | Probability | Index Range | Key Drivers |
| Bull Case | 20% | 6900–7200+ | Rapid Iran ceasefire, oil retraces, Fed regains easing flexibility, AI earnings hold up |
| Base Case | 50% | 6000–6900 | Choppy range, repeated relief rallies, weaker breadth, sticky inflation, limited policy relief |
| Bear Case | 30% | 5200–6000 | Prolonged energy shock, private credit stress, higher long-end yields, AI / capex de-rating |
Interpretation: The most likely path is not a straight-line collapse but a volatile, range-bound market with lower-quality rallies and repeated rotations. The bear case becomes materially more likely if oil remains elevated and credit stress migrates from private markets into broader risk assets.
Before examining the individual charts, the current market regime can be summarized through a simple fragility framework. Multiple cross‑asset indicators are simultaneously deteriorating, suggesting the market is transitioning from late‑cycle momentum to a more unstable macro phase.
| Macro Factor | Current Signal | Interpretation |
|---|---|---|
| Market Breadth | Deteriorating | Participation falling beneath the surface |
| DeMark Signals | Multi‑timeframe exhaustion | Major indices showing mature trend signals |
| Liquidity | Tightening | Global financial conditions are tightening |
| Dollar | Strengthening | Elevated but not panicked |
| Energy | Supply shock | Oil acts as an inflationary tax on global growth |
| Credit | Early stress | Private credit deterioration emerging |
| Sentiment | Elevated but not panic | No capitulation yet |
Interpretation: When these factors align, markets typically shift from trending environments toward volatile corrective phases. The index level alone often understates the underlying fragility building beneath the surface.
Hedge Fund Telemetry Market Dashboard
| Metric | Reading | Interpretation |
| Macro Score | -2 | Risk rising |
| Fragility Score | 8 | Elevated fragility |
| Sentiment | Mixed / not washed out | Not enough fear for a durable low |
| Liquidity Trend | Deteriorating | Oil shock and hawkish repricing are tightening conditions |
The dashboard points to an environment where headline index damage still understates underlying market stress. Liquidity is deteriorating, macro uncertainty is rising, leadership is narrow, and the market is losing the breadth cushion that typically absorbs shocks. This is not yet a full crash setup, but it is no longer a clean risk-on backdrop.
S&P 500 Market Structure
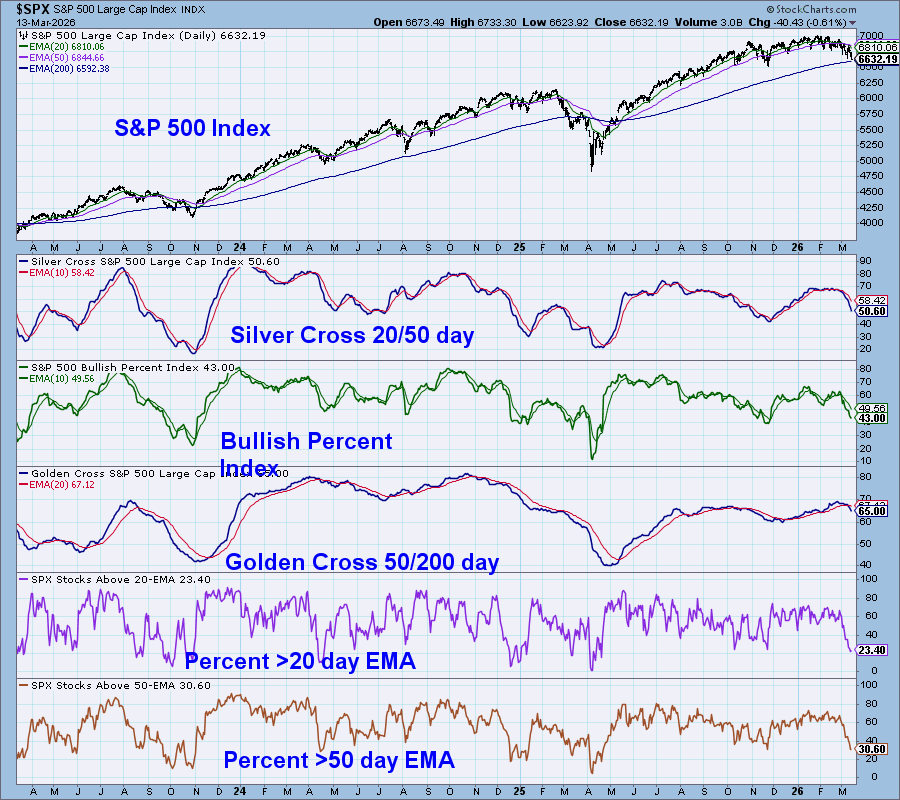
The market structure is deteriorating. The most important point is that the S&P 500 headline decline still masks much larger damage beneath the surface. Equal-weight performance has lagged, breadth measures have broken lower, and the percentage of stocks above key moving averages has slipped to levels consistent with internal distribution rather than healthy consolidation.
The silver cross indicator, with the 20-day moving average now below the 50-day moving average, has turned down, while the bullish percent index sits in the low 40s, confirming that participation is thinning but not yet oversold. The golden cross reading remains somewhat higher, indicating the longer-duration trend has not fully collapsed, while short- and intermediate-term internals are weakening much faster than the benchmark itself.
This remains a narrow and fragile market, not a broad and healthy one. Mega-cap resilience can keep the index afloat for a while, but it is a poor substitute for broad participation. Without breadth repair, rallies are more likely to be squeezes than durable trend resumptions.
The Charts That Matter Most
The market is currently being driven by a combination of geopolitical shocks, tightening liquidity, weakening internals, and exhaustion signals across several major risk assets. The following charts collectively outline why the market is becoming increasingly fragile beneath the surface.
Institutional ETF Shorting Activity
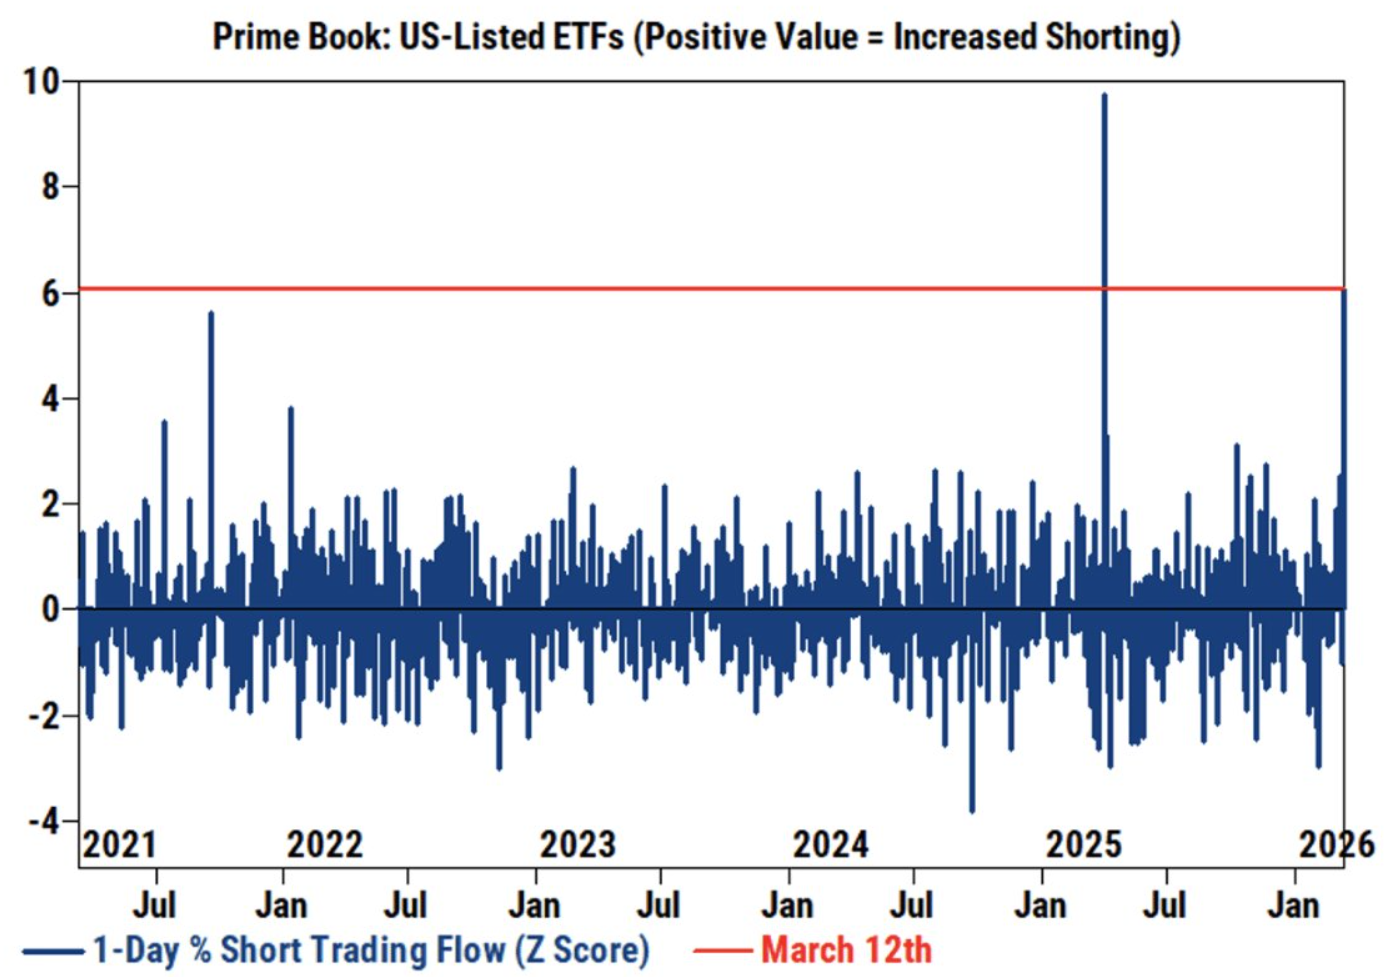
Takeaway: Institutional hedging activity has surged, reflecting rising macro uncertainty.
Large spikes in ETF short flow historically occur when institutional investors begin building downside protection. The current reading suggests positioning is turning defensive, which is not unexpected given US involvement, uncertainty around Iran, and the surge in crude prices/supply chain disruptions.
S&P 500 Weekly DeMark Exhaustion
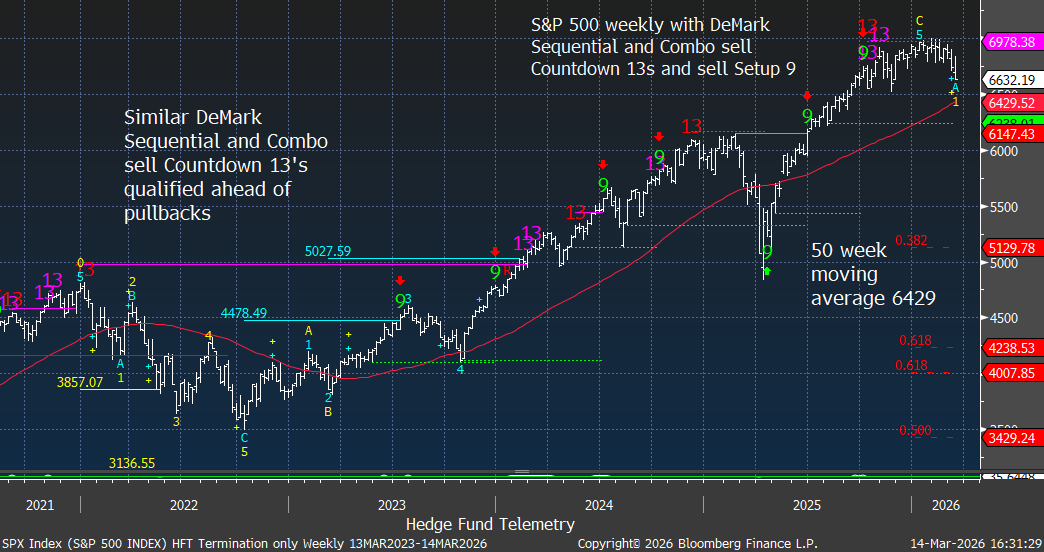
Takeaway: The S&P entered the current pullback after qualified Sequential and Combo sell signals.
The weekly chart shows exhaustion signals forming after an extended rally. Price is now approaching the 50‑week moving average near 6429. Historically, this level determines whether a pullback remains corrective or evolves into a deeper cyclical correction. I added a few retracement levels in case things really break down; however, the TDST Setup Trend at 6328 (green dotted line) is the support to watch, in addition to the 50-week moving average.
S&P 500 Monthly Combo 13
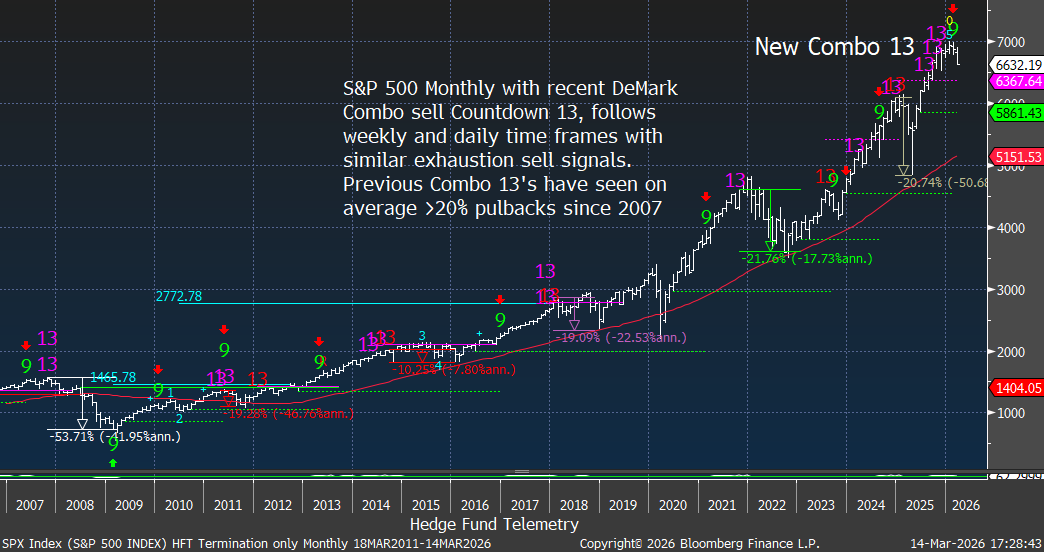
Takeaway: A new monthly DeMark Combo sell Countdown 13 warns the long‑term trend is mature.
Higher‑time‑frame DeMark signals tend to occur near major cyclical turning points. Prior signals have preceded pullbacks, averaging roughly 20% since the Global Financial Crisis. Other pullbacks have moved down to the 50-month moving average, which currently sits at 5151. Ouch.
Breadth Deterioration
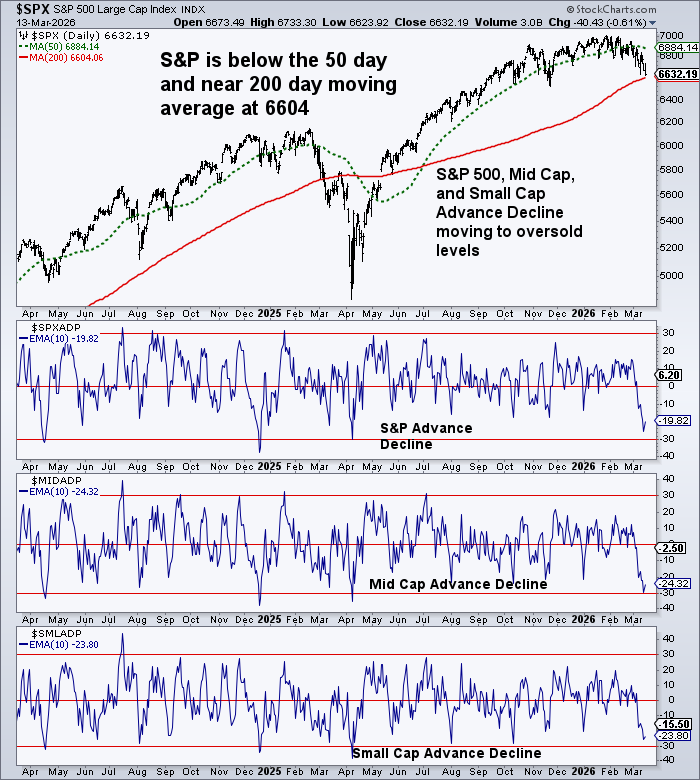
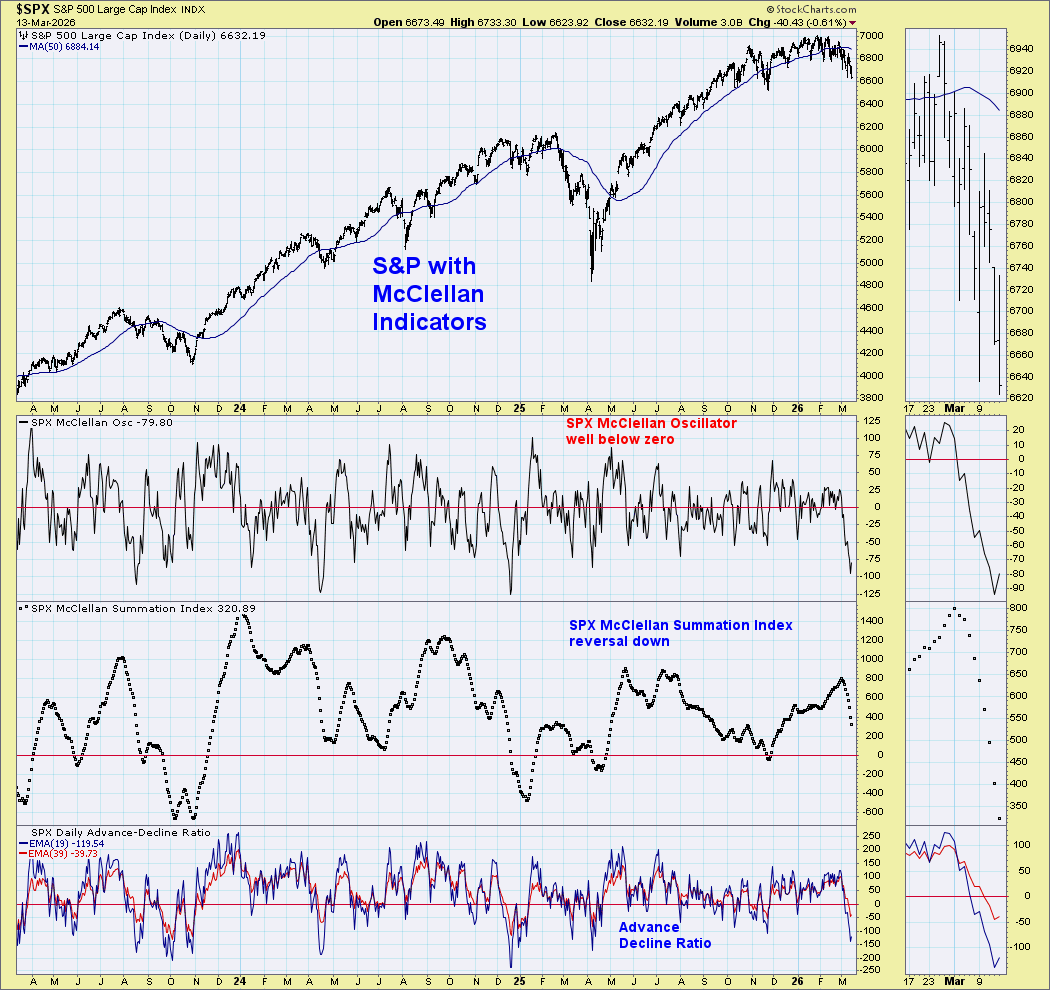
Takeaway: The S&P remains not that far off the highs, but breadth momentum has rolled over. With the advance decline data moving toward oversold in the near term.
The S&P with the McClellan Oscillator, Summation Index, and advance‑decline lines are all weakening. This divergence between index price and participation often occurs late in market cycles when leadership narrows to a small group of mega‑cap stocks.
Nasdaq Monthly DeMark Exhaustion
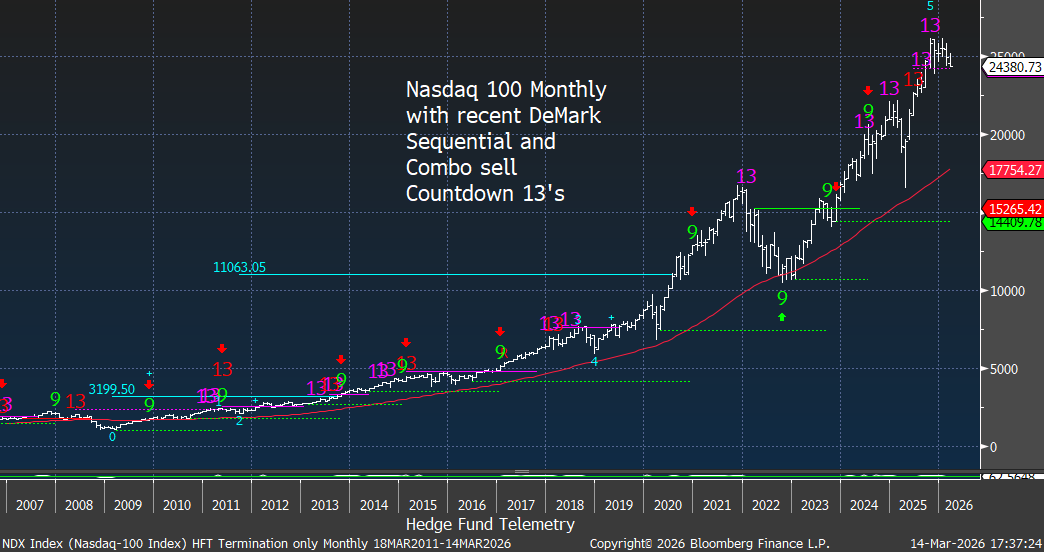
Takeaway: The Nasdaq 100 also registered major DeMark exhaustion signals.
This confirms that technology leadership itself is entering a more mature phase of the cycle rather than initiating a fresh structural rally. The nominal declines has everyone concerned however this could pull back to the 50 month moving average to 17,754 near the tariff liberation day last year as corrections have tended to move near this moving average
S&P Breadth: % Above Key Moving Averages
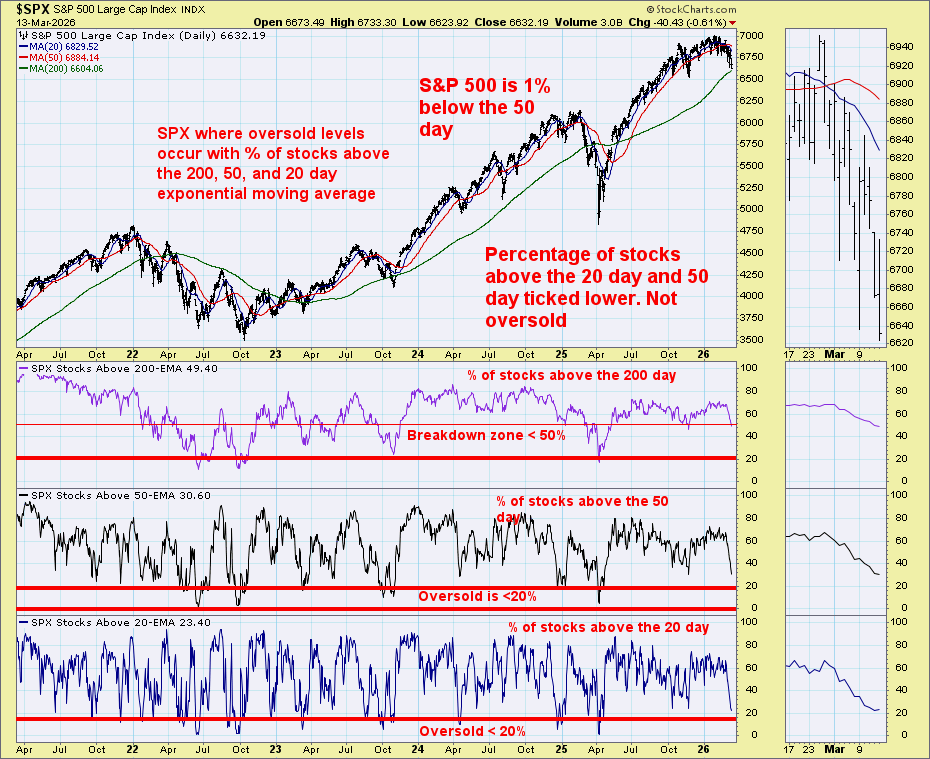
Takeaway: Internal participation is deteriorating even though the index is only modestly lower.
Only about half the S&P remains above the 200‑day moving average, roughly one‑third above the 50‑day, and only about one‑quarter above the 20‑day average. These readings suggest internal distribution rather than healthy consolidation. This has been steady up until the last two weeks and is moving toward oversold levels.
put buying has increased, but not enough
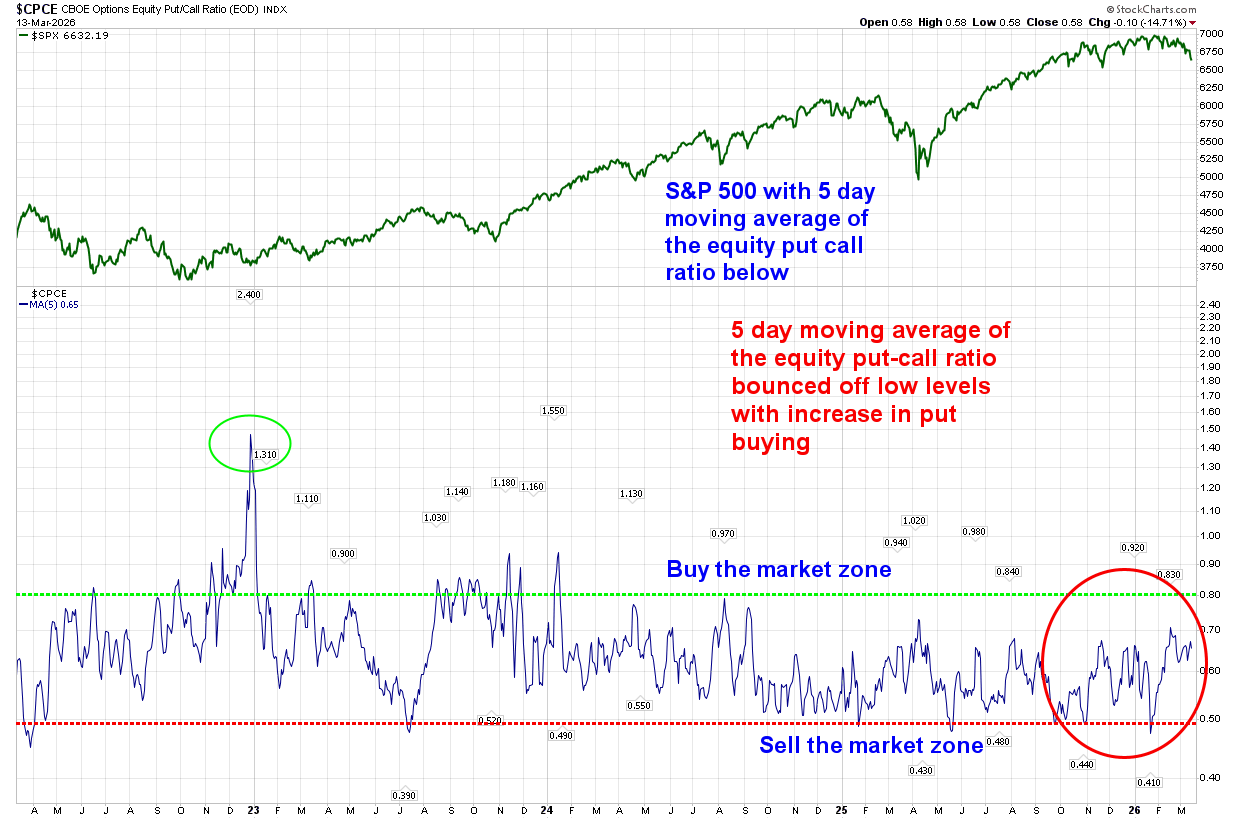
Takeaway: Fear is rising with increased put buying, but not yet at panic extremes.
The 5-day moving average of the equity put/call ratio has risen toward historically elevated levels but has not yet reached the capitulation zone typically associated with durable market bottoms.
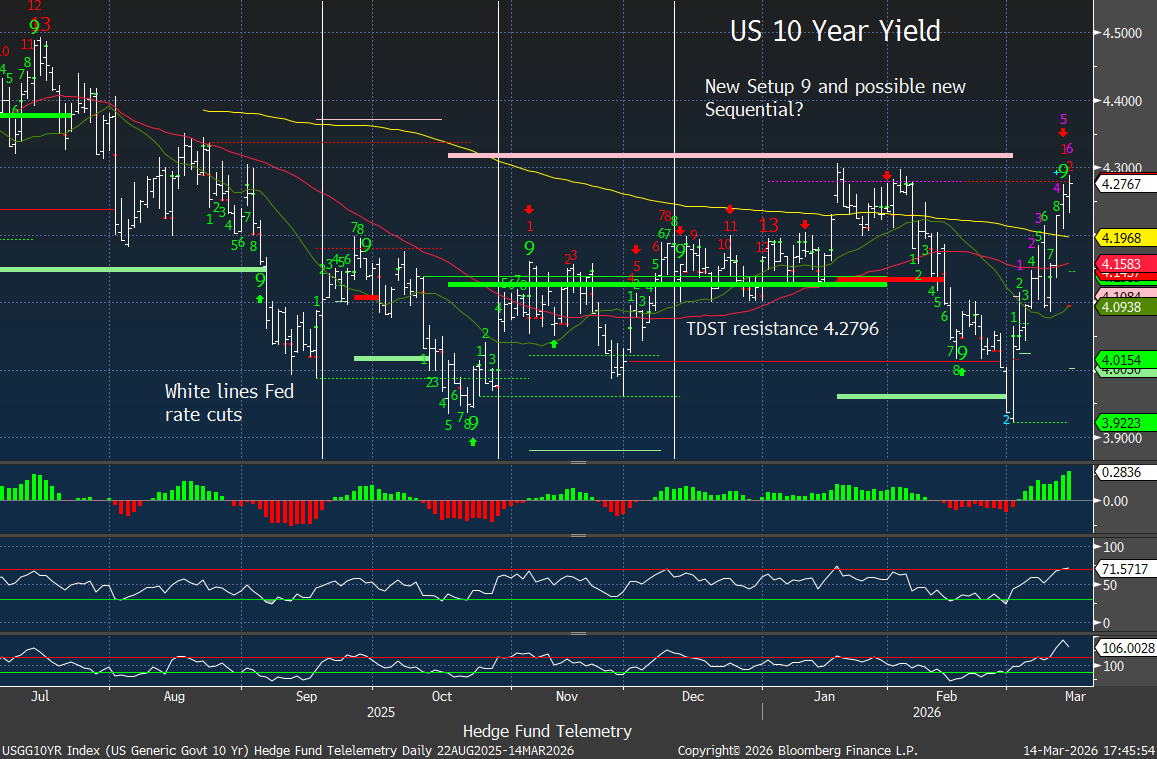
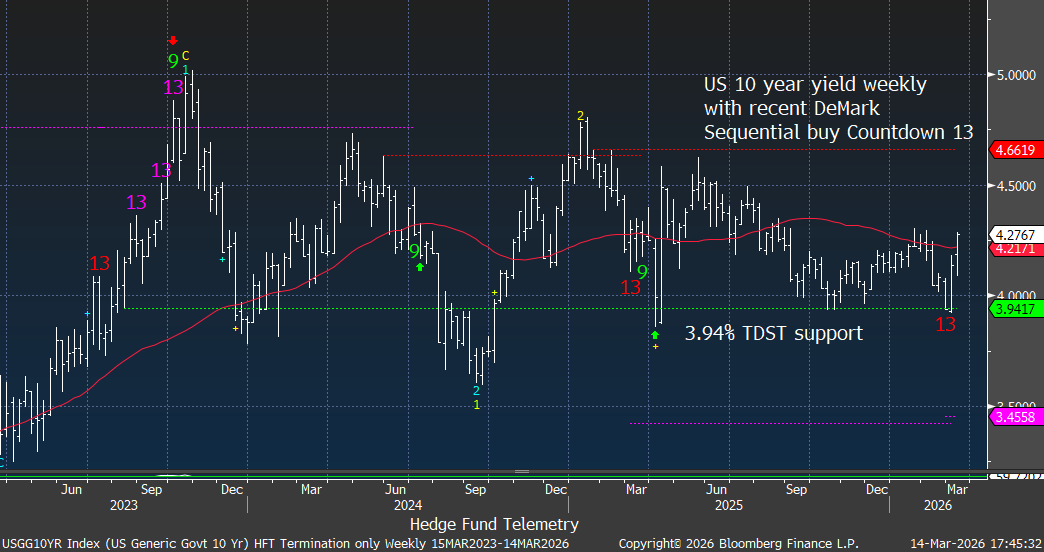
US 10‑Year Yield Structure
The US 10-year yield daily is inching up toward breakout levels
The weekly had a recent Sequential buy Countdown 13 holding the TDST Setup Trend line at 3.94
The monthly has had a bunch of upside sell Countdown 13’s in recent years which stalled out the advance with exhaustion. A risk is if this lifts above 5% above the wave 1 (blue 1) as it would qualify into upside wave 3 with an upside potential price objective of 7.65%. Keep in mind this is a longer-term chart, and if it gets to that upside level, it’s not actionable, but it’s worth noting with a “what if…”
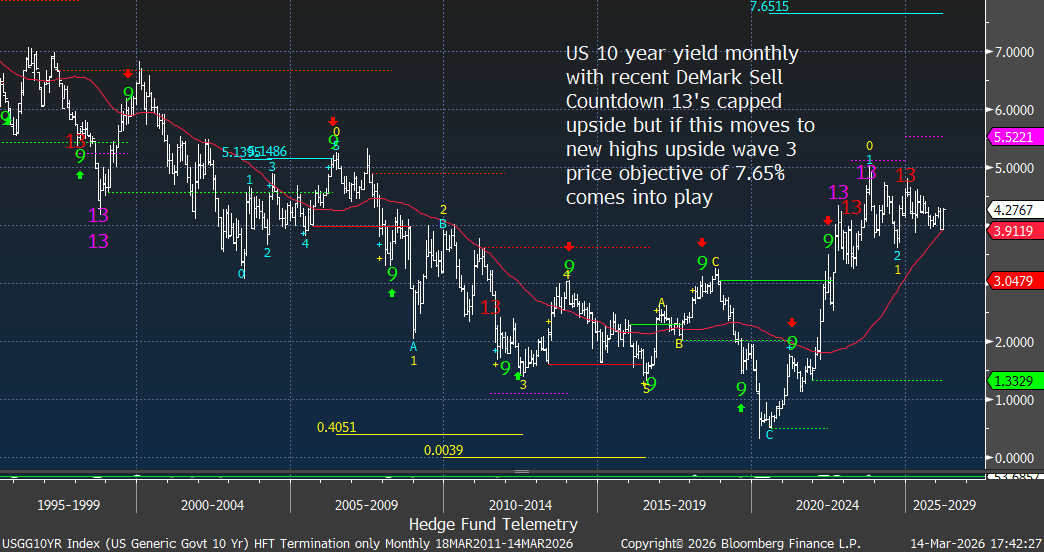
Takeaway: Rising 10 year yields remain a key headwind for equities. The Fed has no control over the 10-year unless there is some form of yield curve control with the Treasury involved.
Even though short‑term DeMark exhaustion signals suggest yields may pause temporarily, the broader trend remains structurally volatile with upside risks if inflation pressures persist.
US Dollar Breakout
US Dollar Index has cleared the TDST resistance I’ve been highlighting on the daily charts.
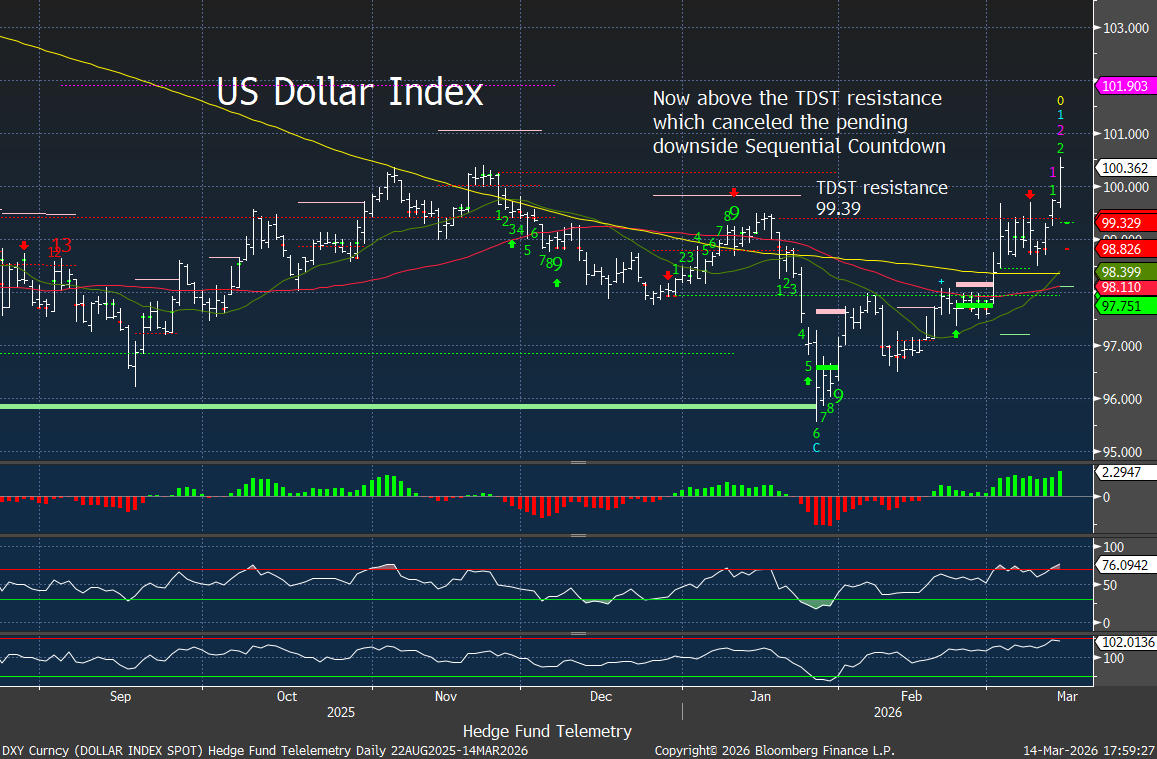
The weekly time frame for the US Dollar Index recently had DeMark Sequential and Combo buy Countdown 13s at the lows. TDST Setup Trend resistance is 101.09

Takeaway: Dollar strength is tightening global financial conditions.
The Dollar Index has broken above TDST resistance on the daily time frame, canceling a pending downside DeMark countdown and signaling a potential shift toward a stronger dollar regime.
A stronger dollar has historically put pressure on global liquidity, emerging markets, and risk assets.
WTI Crude Oil Surge
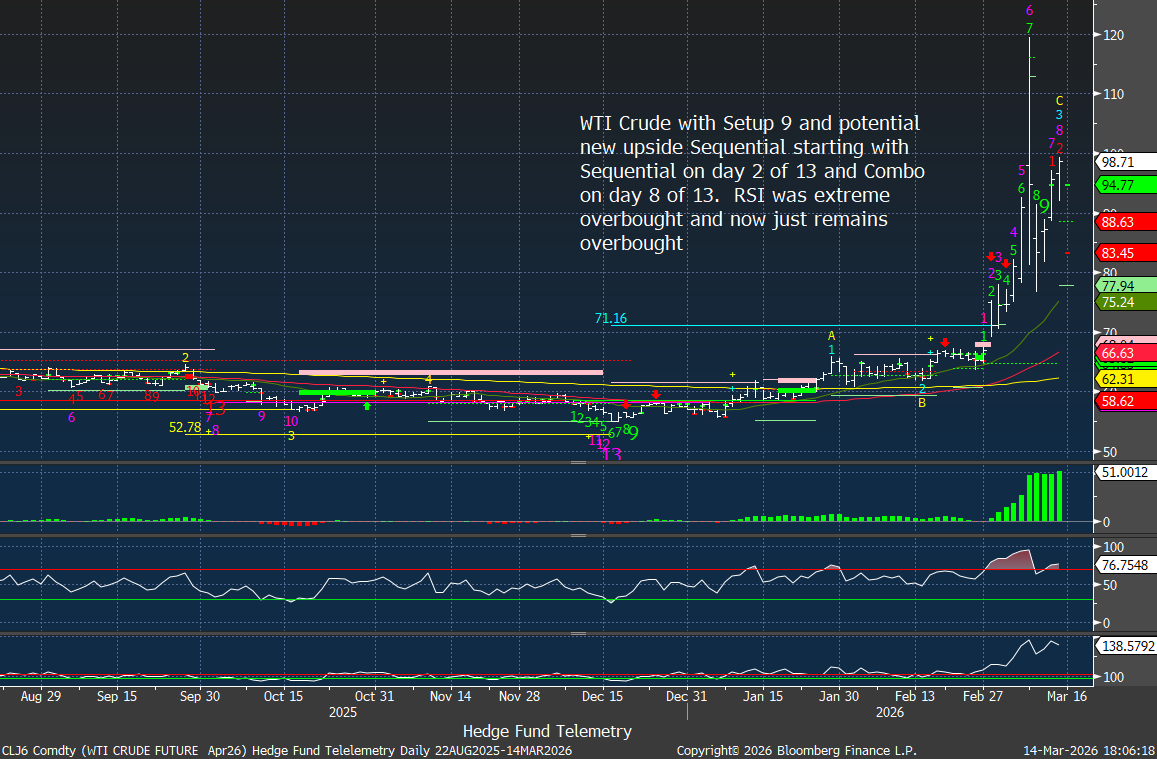
Takeaway: Oil has become the dominant macro shock.
The geopolitical premium created by the Iran conflict and the disruption of the Strait of Hormuz has driven oil prices sharply higher. This acts as a tax on the global economy while also forcing markets to reprice expectations for central bank easing. We need to watch if the Sequential starting up on day 2 of 13 continues as this could get worse.
Gold Late‑Cycle Momentum
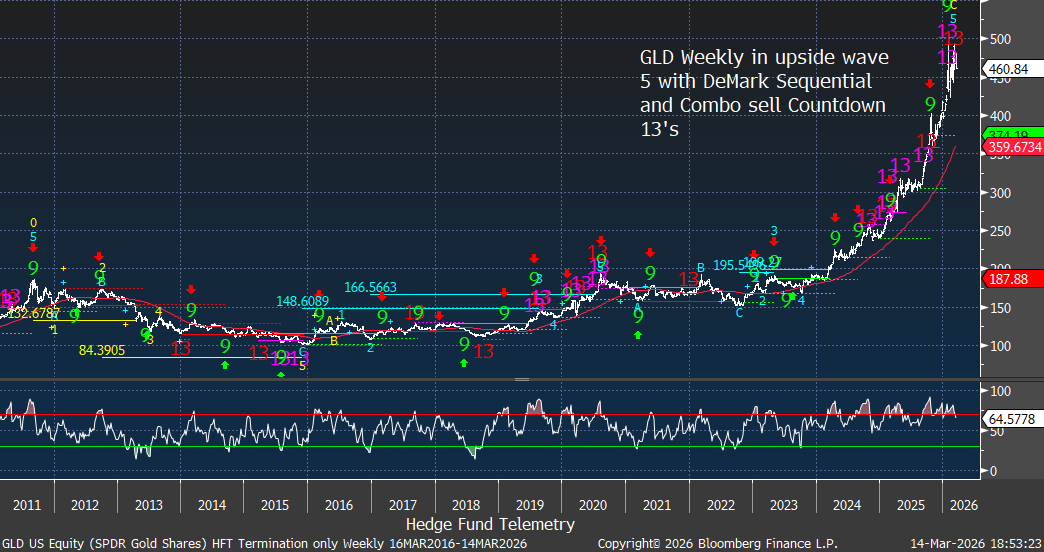
Takeaway: Gold remains structurally strong but is also has technical exhaustion with overbought conditions.
The metal is currently in a fifth-wave advance, accompanied by DeMark Sequential and Combo sell countdown signals. This often marks the later stages of strong commodity rallies. I want to buy gold on dips, real dips not 2% dips.
USDJPY and Yen Weakness
The USDJPY shows Yen weakness vs USD with both the daily and weekly time frame charts.

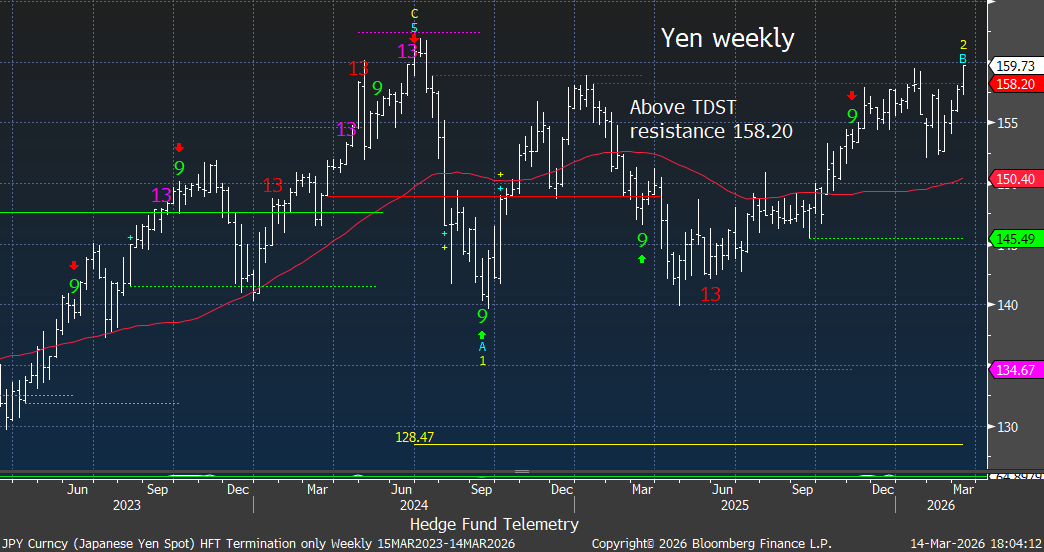
Takeaway: Yen weakness highlights global carry trade dynamics.
The USDJPY chart shows the pair pressing toward major resistance near 160. Sustained yen weakness historically reflects strong dollar liquidity conditions and global carry trade activity.
Global Equity Exhaustion (Nikkei, Hang Seng, Korea)
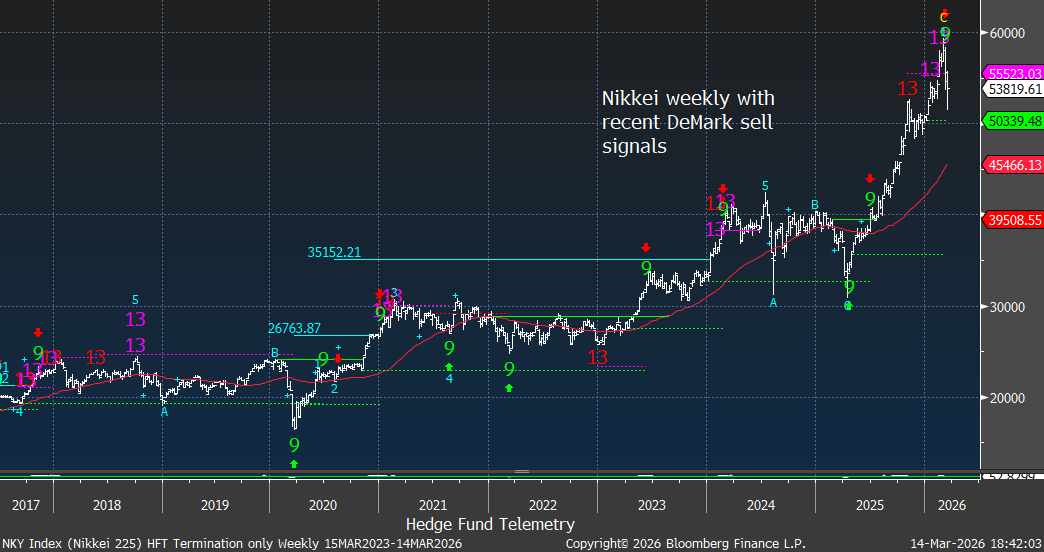
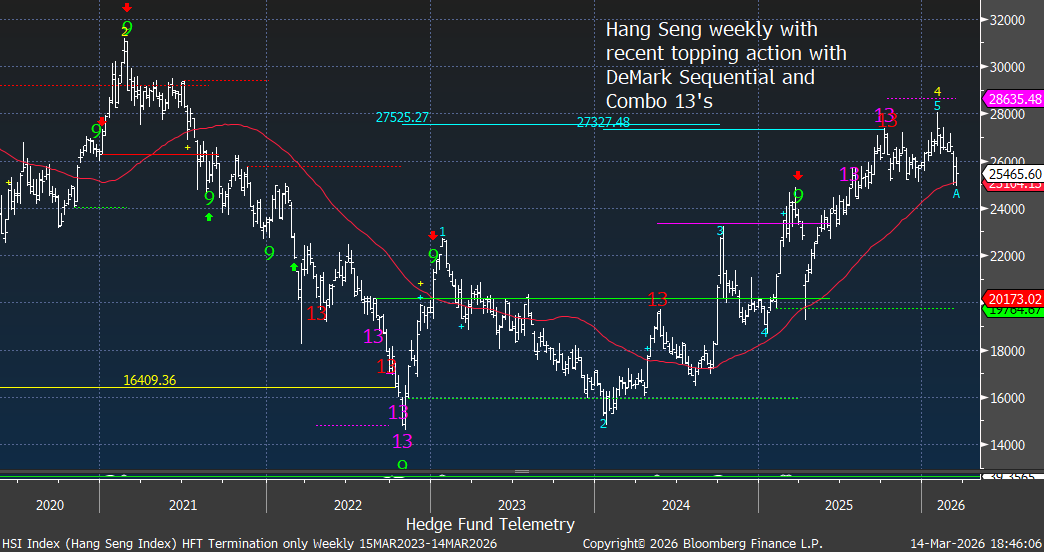
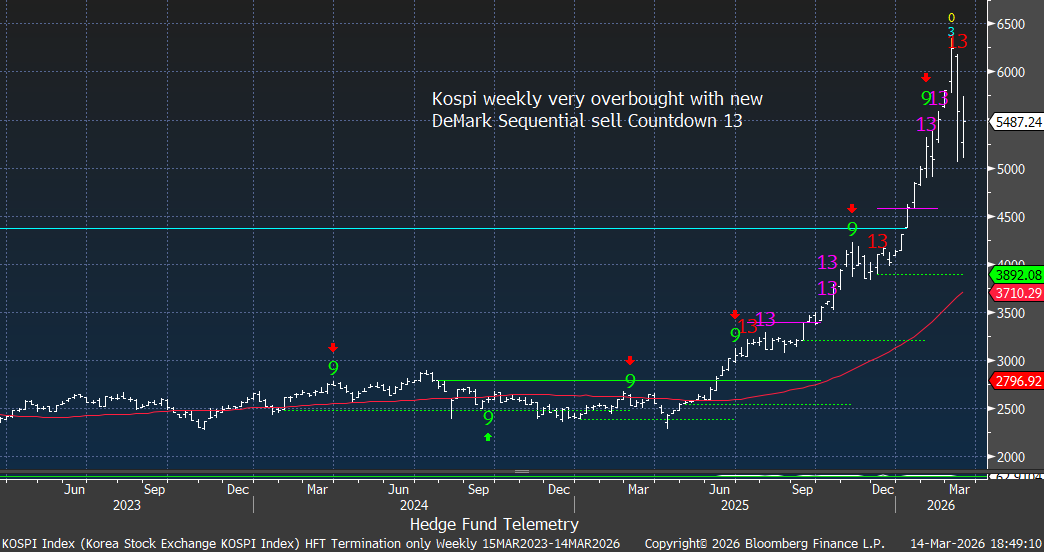
Takeaway: Several international equity markets are showing similar late‑cycle exhaustion patterns.
The Nikkei and Kospi charts both show DeMark sell signals after powerful advances, while the Hang Seng displays topping behavior following exhaustion signals in 2025. Global equity markets appear synchronized in maturity. These markets are very crowded for investors looking outside of the US markets.
Bitcoin Risk Appetite Indicator
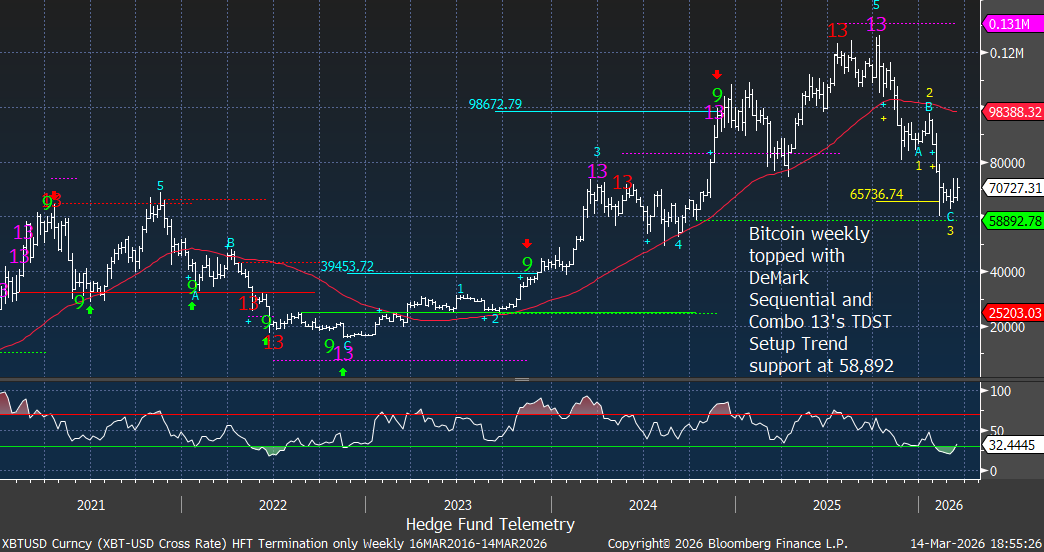
Takeaway: Crypto momentum has faded from its previous high.
Bitcoin rolled over after registering DeMark exhaustion signals. Crypto often functions as a barometer of speculative risk appetite, and weakening momentum reinforces the message from equity internals. Achieved downside wave 3 of 5 price objective of 65k. A corrective wave 4 bounce is possible and would qualify with a 13 week closing high. So it will take some time if the bounce qualifies wave 4 of 5. Breaking the TDST Setup Trend support at 58,892 could see a much further decline.
Sentiment Dashboard
The Hedge Fund Telemetry sentiment monitors show a mixed, non-capitulative (yet), cautious cross-asset picture.
Equities
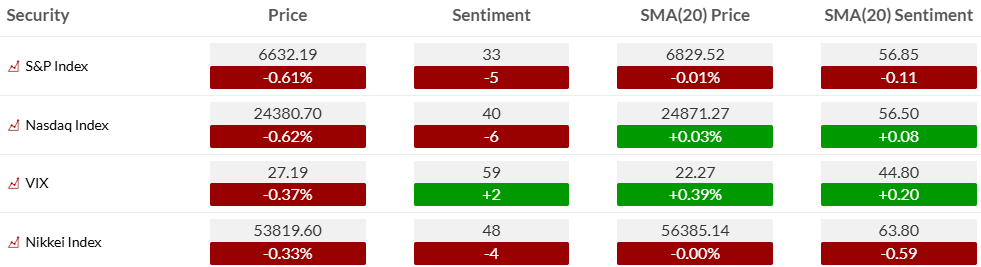
- S&P Index sentiment: 33, down vs 20-day sentiment average of 56.85.
- Nasdaq sentiment: 40, below its 20-day sentiment average of 56.50.
- VIX sentiment: 59, modestly elevated, reflecting anxiety but not panic.
Rates
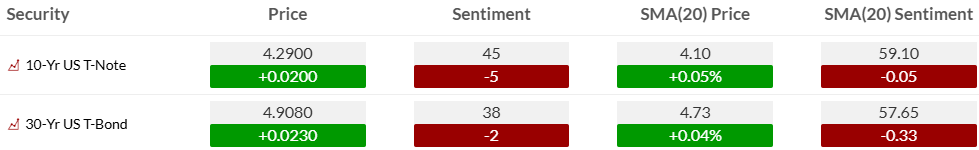
- US 10-year sentiment: 45, below its 20-day sentiment average of 59.10.
- 30-year bond sentiment: 38, below its 20-day average of 57.65.
currencies
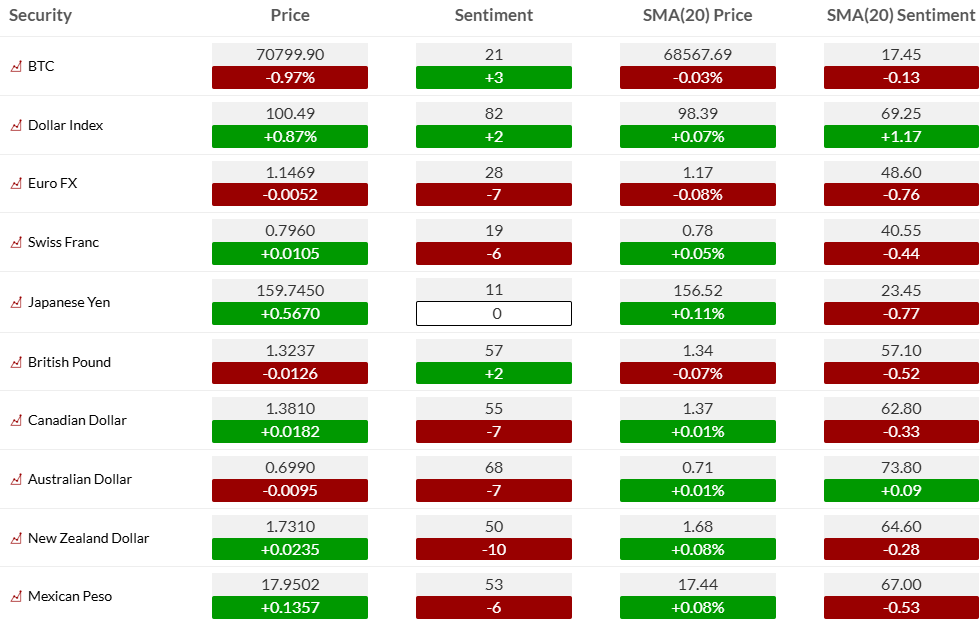
- Dollar Index sentiment: 82, one of the strongest readings across the monitor set.
- Euro / CAD / AUD / NZD / MXN sentiment: broadly weak, consistent with a stronger-dollar, tighter-liquidity backdrop.
- BTC sentiment: 21 with negative 20-day sentiment momentum, signaling speculative appetite is weak.
Commodities
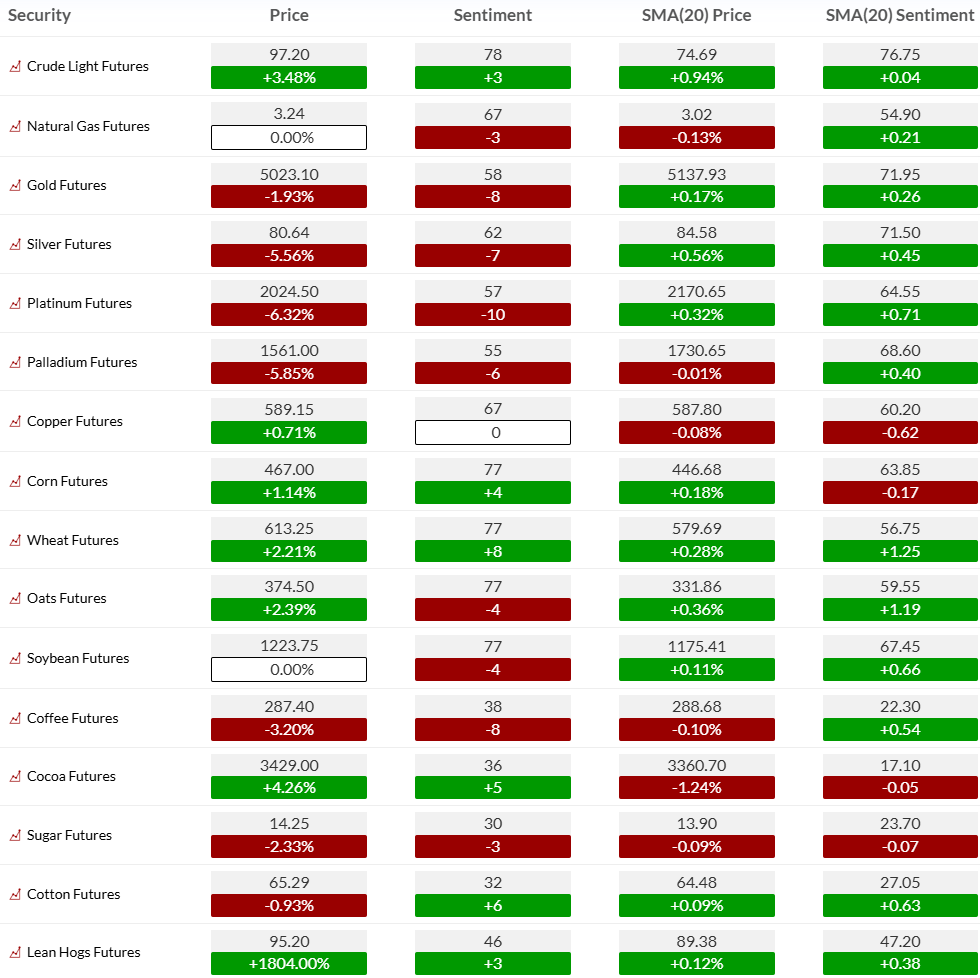
- Crude sentiment: 78 and rising, reflecting war premium and supply stress.
- Corn / wheat / oats: constructive sentiment momentum, consistent with broader commodity inflation risk.
- Gold sentiment: 58 but below its 20-day sentiment trend, suggesting safe-haven enthusiasm has cooled tactically after a strong prior run.
Interpretation: Positioning has become more cautious, but there is still not enough broad fear to argue for a major durable low in risk assets. The strongest sentiment resides in the dollar and crude, which is not the mix equity bulls want to see. It points to tightening global financial conditions, defensive rotation, and inflation pressure rather than clean reflation.
More thoughts:
Oil is the dominant macro commodity at the moment. The issue is not simply price level but the broader economic transmission mechanism: higher fuel costs, tighter financial conditions, more hawkish rate expectations, and supply-chain disruption. Oil strength is effectively acting as a tax on growth.
Copper sentiment is neutral to slightly constructive on price, but the broader signal is mixed. This is not a clean global growth confirmation chart yet. A bit toppy but long term constructive and one of my fav commodities.
Gold remains strategically attractive as a hedge against policy uncertainty, fiscal deterioration, and geopolitical stress, although near-term momentum has cooled versus its 20-day sentiment trend. I want to buy dips lower.
Corn, wheat, and oats have all shown improving sentiment and positive price momentum. Agriculture is quietly reinforcing the message that the inflation impulse extends beyond crude alone.
Implication: Real assets deserve more respect in portfolios than they did during the pure AI / duration-driven equity melt-up. Commodities are increasingly a macro allocation question, not just a tactical trade.
Global Markets – brief thoughts
China
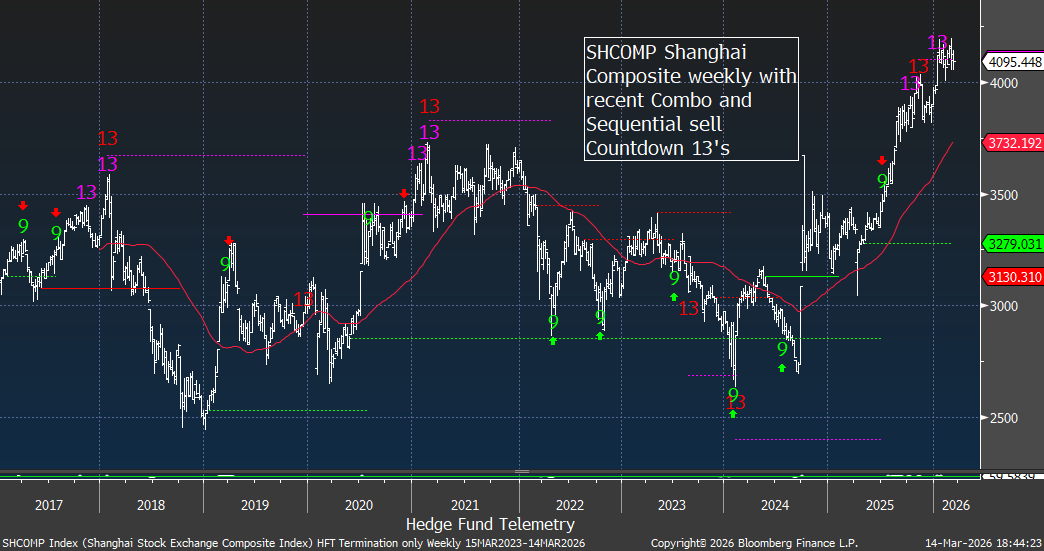
China remains important for demand stability, policy signaling, and geopolitical theater. Any Trump effort to de-escalate the Iran conflict ahead of a China trip would matter at the tactical level, but China still faces structural growth headwinds. The bigger issue for markets is whether Beijing becomes a stabilizer through demand and diplomacy or another source of friction.
Europe
Europe is more vulnerable to an energy shock through growth, inflation, and industrial exposure. A prolonged Hormuz disruption would disproportionately hurt Europe and reinforce global stagflation concerns. I will post charts on Euro Stoxx that are breaking down a few times this coming week.
Japan
Japan remains sensitive to energy import costs and FX moves. A stronger dollar / weaker yen mix can temporarily support exporters, but sustained energy pressure would complicate the domestic policy mix. See charts above for Nikkei and Yen.
Emerging Markets
Emerging markets face the classic negative combination of stronger dollar, higher energy costs, and uncertain global demand. Capital flows are likely to remain selective rather than broad-based.
Implication for US markets: Global macro conditions are no longer providing a benign international backdrop for US risk assets. Instead, the external environment is becoming another amplifier of inflation, supply shock, and dollar strength.
five Major Investment Themes to watch
Theme 1 — Geopolitical Supply Shock
Thesis: The Iran / Hormuz situation has introduced a durable geopolitical risk premium into energy, shipping, and global supply chains.
Catalysts: Escalation in tanker attacks, failed diplomacy, prolonged export disruption.
Risks/Reward: Sudden ceasefire, coordinated reserve releases, and faster-than-expected normalization are risks to energy longs.
Theme 2 — AI Capex Excess Meets Macro Reality
Thesis: The AI build-out remains strategically important, but capital intensity, balance-sheet strain, and high expectations leave parts of the ecosystem vulnerable in a less forgiving macro environment.
Catalysts: Nvidia GTC this week and Micron earnings will be the tell for the short term. Hyperscaler capex commentary, Oracle follow-through is needed.
Risks/Reward: Better-than-feared demand, sovereign or enterprise AI acceleration, renewed mega-cap leadership.
Theme 3 — Private Credit Stress
Thesis: What begins as idiosyncratic stress in private credit can evolve into a broader risk-premium event if redemptions, collateral markdowns, and tighter lending standards reinforce one another.
Catalysts: More redemption limits, markdown headlines, bank pullback, impaired financing conditions.
Risks/Reward: Policy support, successful refinancing windows, and contained losses. That’s the hope in that space.
Theme 4 — Dollar Strength as a Tightening Mechanism
Thesis: A stronger dollar is reinforcing tighter financial conditions globally at the same time energy prices are rising.
Catalysts: More hawkish Fed repricing, safe-haven demand, global growth disappointments.
Risks/Reward: Policy pivot, dollar reversal, coordinated diplomatic de-escalation.
Theme 5 — Real Assets Repricing Higher
Thesis: Commodities, energy infrastructure, and selective hard-asset exposures are regaining strategic relevance in a world of supply insecurity and inflation volatility.
Catalysts: Persistent oil premium, broader commodity participation, infrastructure bottlenecks.
Risks/Reward: Sharp growth slowdown, rapid de-escalation, demand destruction.
Bottom Line and wrap up
- Do not treat this as a clean dip-buying environment. The surface-level S&P pullback understates the degree of internal deterioration and macro stress.
- Use relief rallies to upgrade portfolio quality. Higher-time-frame DeMark exhaustion, weakening breadth, and tighter conditions argue for more discipline around crowded risk.
- Keep exposure to real assets and cash optionality. Energy, selective commodities, and liquidity reserves are increasingly valuable in a market where inflation shocks and geopolitical risk can overwhelm valuation support.