
I have some thoughts below on semis and the parabolic move in the last 3 weeks. The interim Big Picture note will be out tomorrow or Wednesday – I’m expecting a few signals that I want to highlight. The S&P has new Combo sell Countdown 13’s and other indexes are near this upside exhaustion signal. On the DeMark Screens below it’s quite unusual with the recent move not to have more sell signals
Quick Market Views
Stocks: Indexes are losing some momentum up small today while breadth is flattish. NYSE has 150 up net issues, Nasdaq has 200 net down issues. S&P has 235 up and 264 down on the day. NVDA and GOOGL are up leading the Mag 7 higher. Short baskets are seeing some squeezing yet it is moderate.
Bonds: Rates are higher across the curve up 2-3bps after a weak 5 year auction. I continue to watch the 30 year yield as 5% is closer with it at 4.94% today. That 5% could set off some alarm bells.
Commodities: Energy remains strong with Crude up 2.5%, Brent up 3.3%, Natural Gas up 2%. Grains are strong. Copper is flat, Gold and Silver are both down about 1%
Currencies: US Dollar index is down 0.1% off earlier lows. Bitcoin is down 2%. Ethereum is down 3.3% with a new DeMark Sequential 13 as shown on First Call earlier today.
Current Portfolio Ideas:
Changes: I will hold the current GLW short as they report tomorrow. Nothing else, expecting some upside exhaustion signals that should bring some of the crazy moves lower.
Thoughts: I’ve had a few formatting issues with the portfolio sheet, which are being addressed now. (It’s not just my shit PNL of late).
US INDEXES – watching the developing Combos
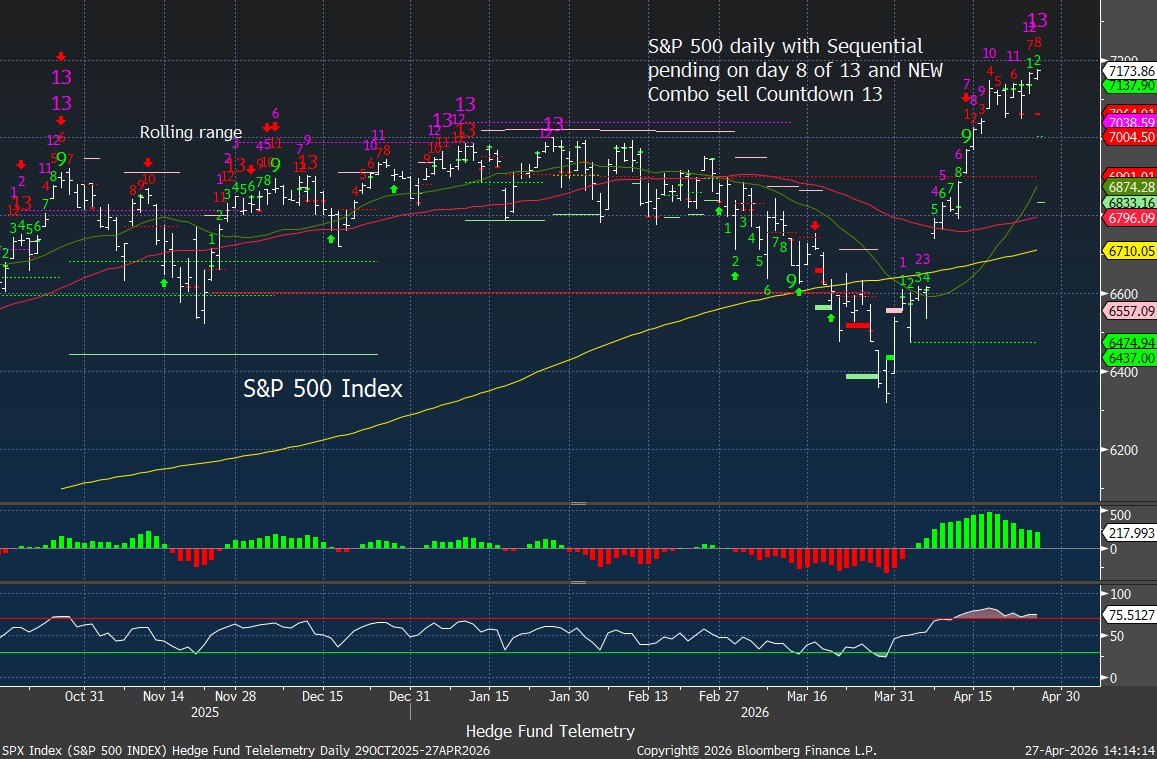
S&P 500 Index daily with new Combo sell Countdown 13 today. The last few Combo 13’s worked well near tops
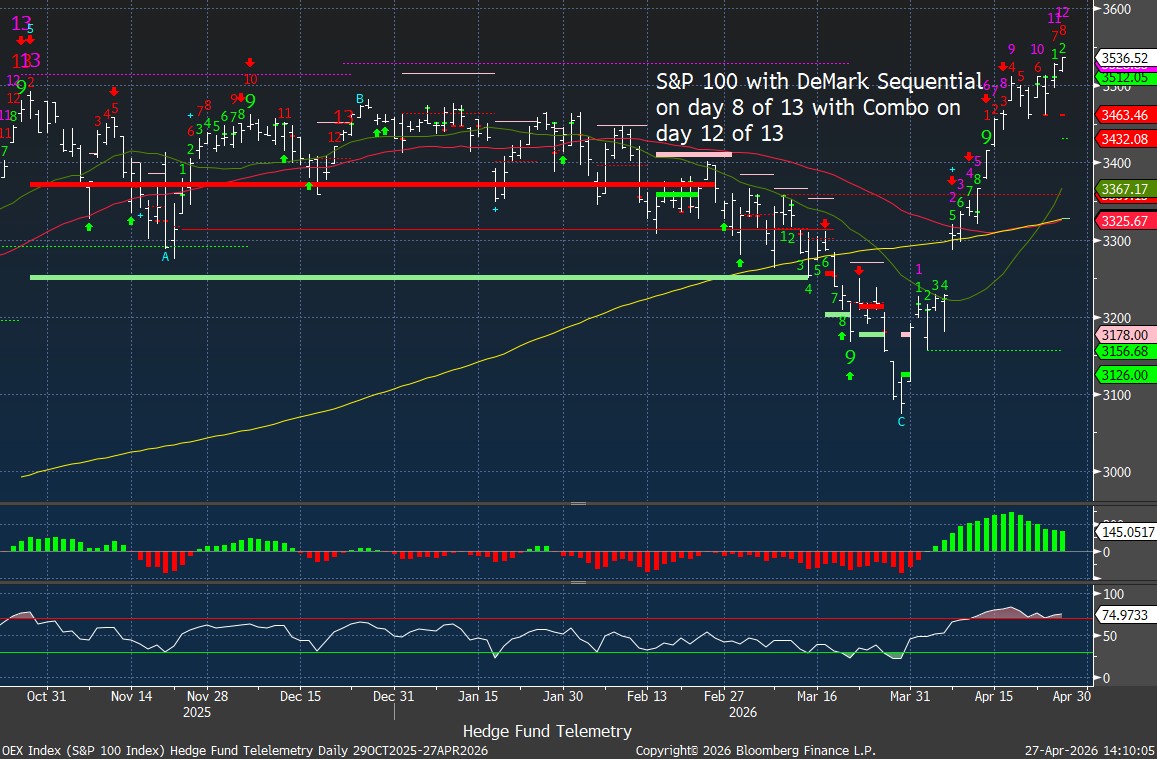
S&P 100 is the meat of the market cap in the S&P 500 with Sequential on day 8 of 13 and Combo on day 12 of 13.
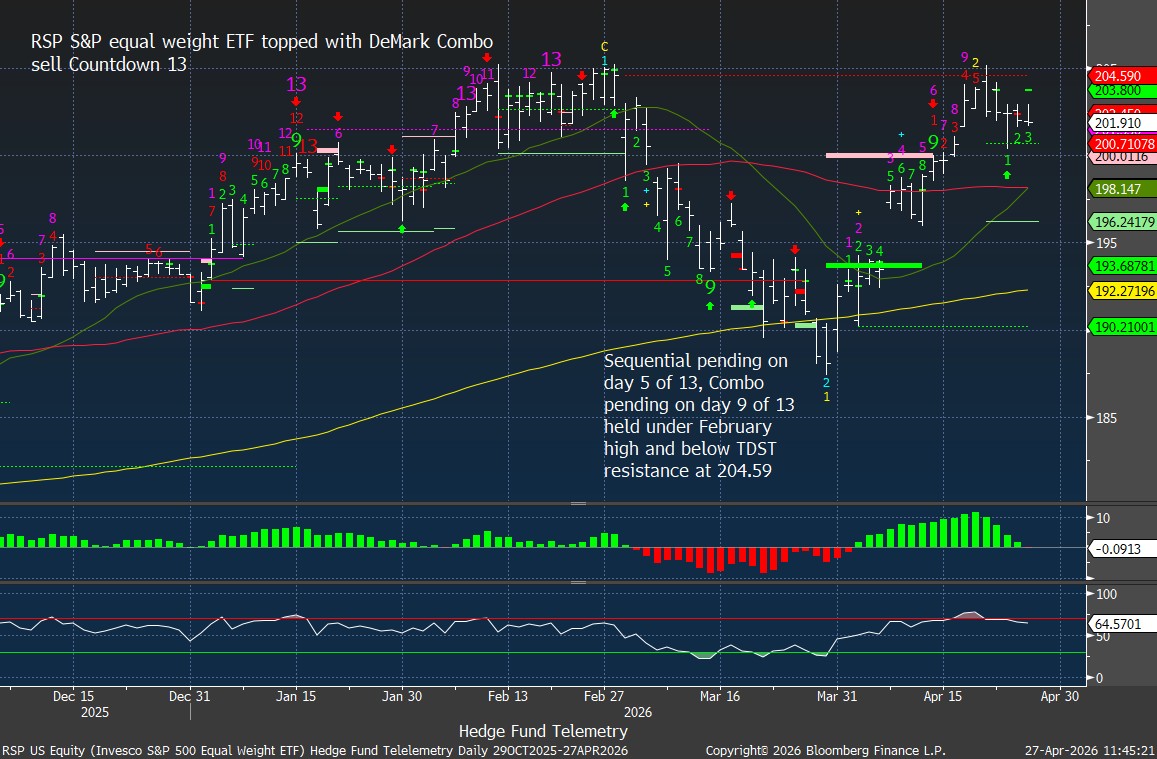
RSP S&P equal weight has been divergent from the S&P weighted index dropping in the last week.
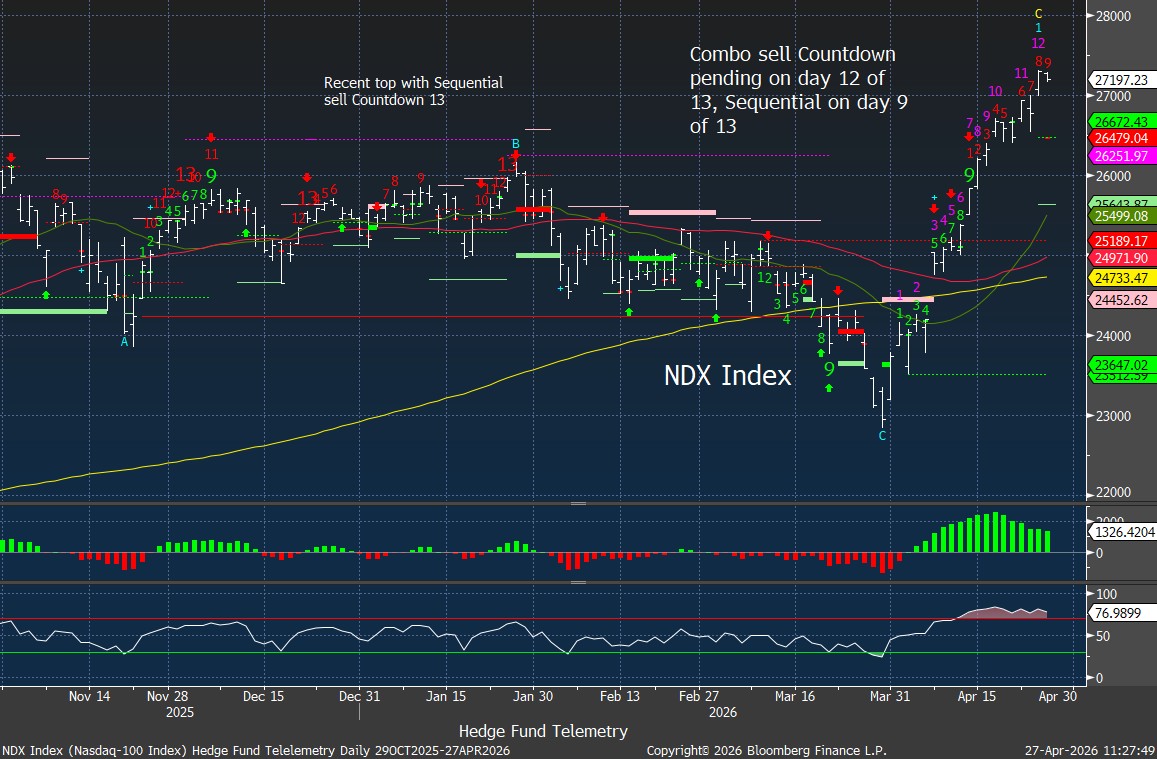
Nasdaq 100 Index daily is pending on day 12 of 13 and with a new high today or tomorrow the 13 will qualify.
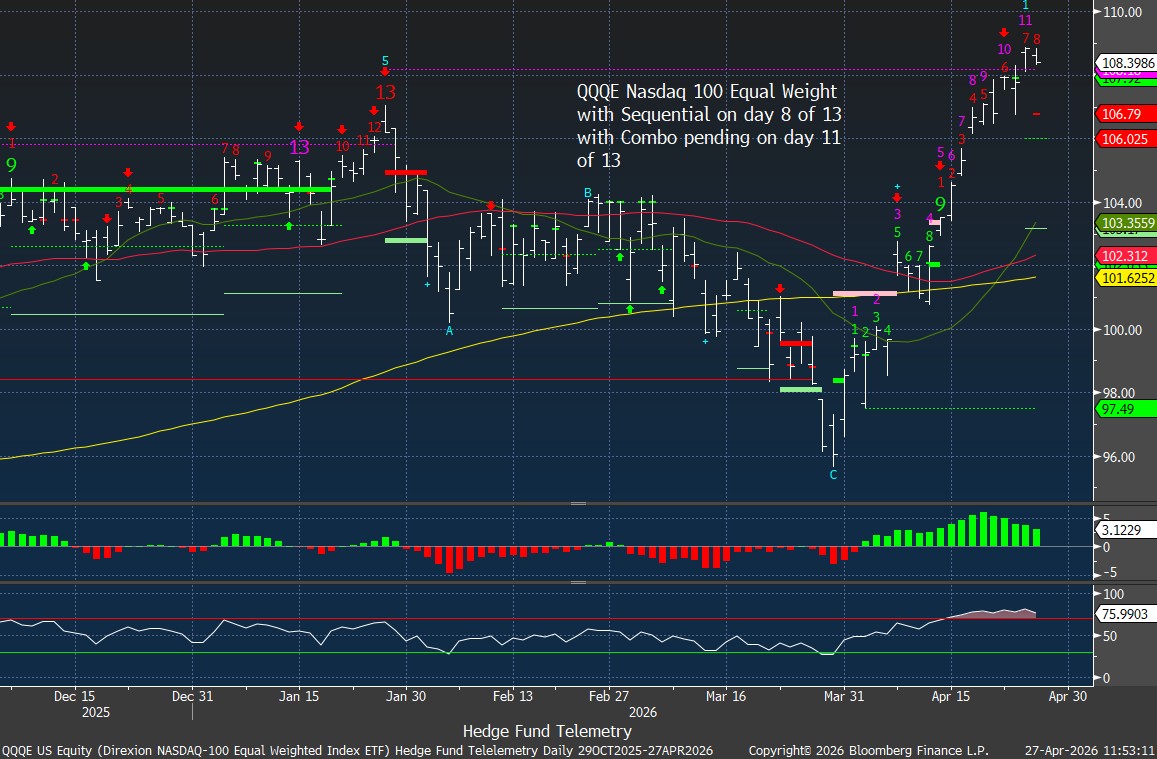
QQQE Nasdaq 100 equal weight also nearing upside with Combo on day 11 of 13
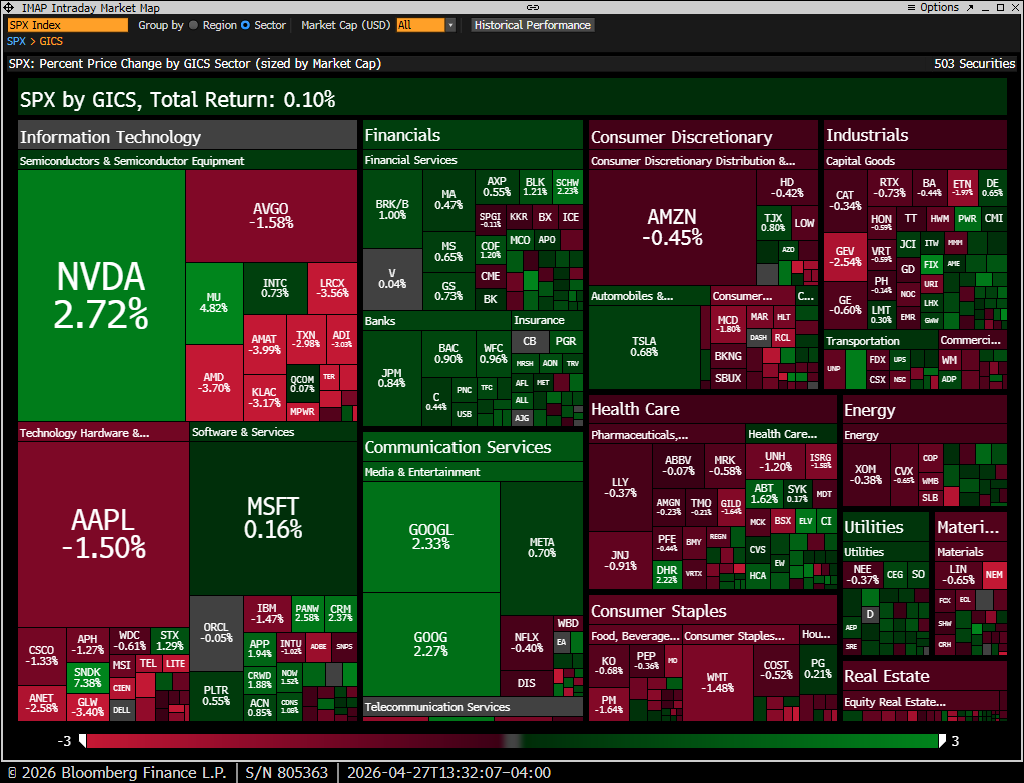
s&P heat Map
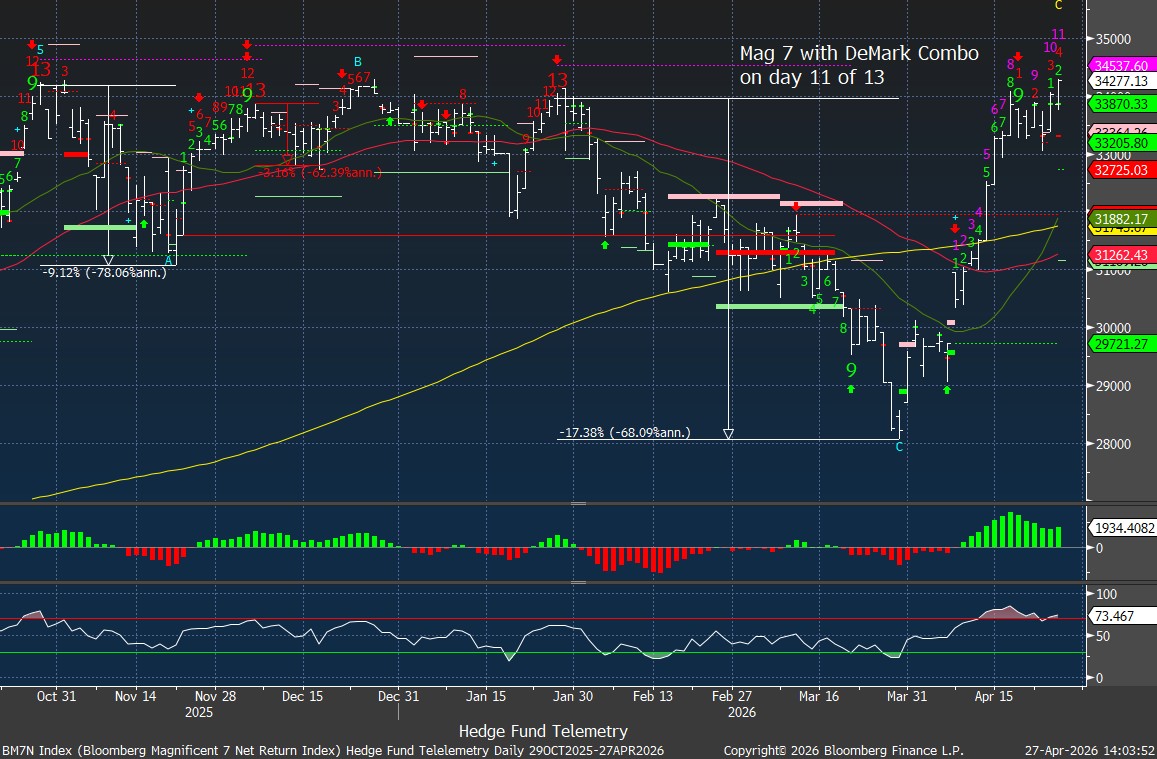
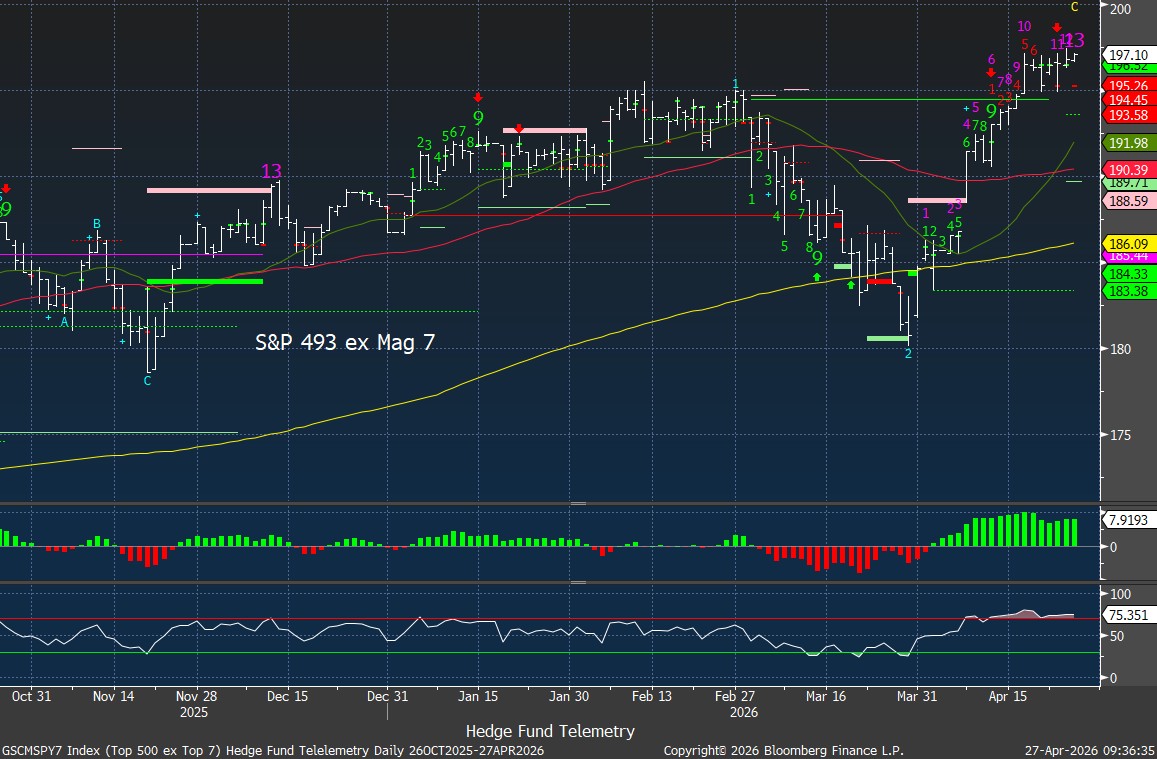
Mag 7 and 493 S&P ex mag 7 update
Mag 7 has upside Combo sell Countdown on day 11 of 13. The Mag 7 have mixed action with NVDA +15.5%, AMZN +13.5%, GOOGL +12.75%, META+2.85%, AAPL -2%, MSFT -12%, TSLA -15.5%
The 493 ex Mag 7 with new Combo sell Countdown 13 today and just a touch above the January highs.
Corning earnings preview
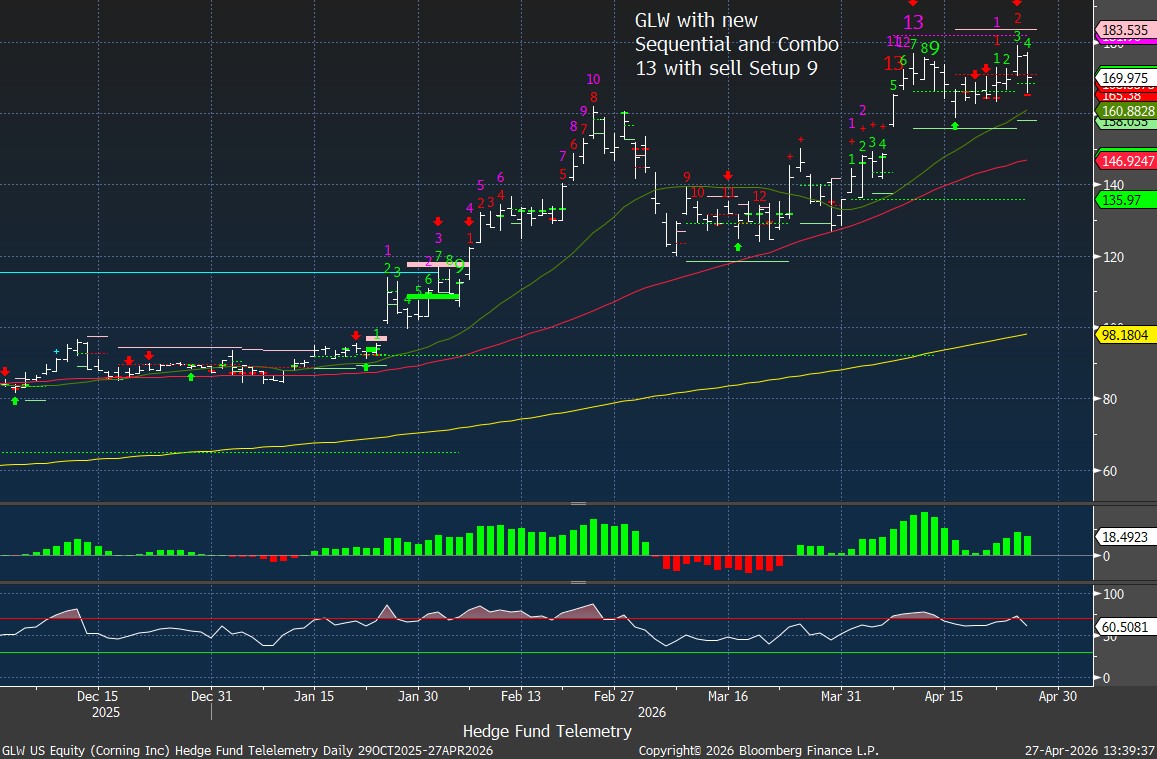
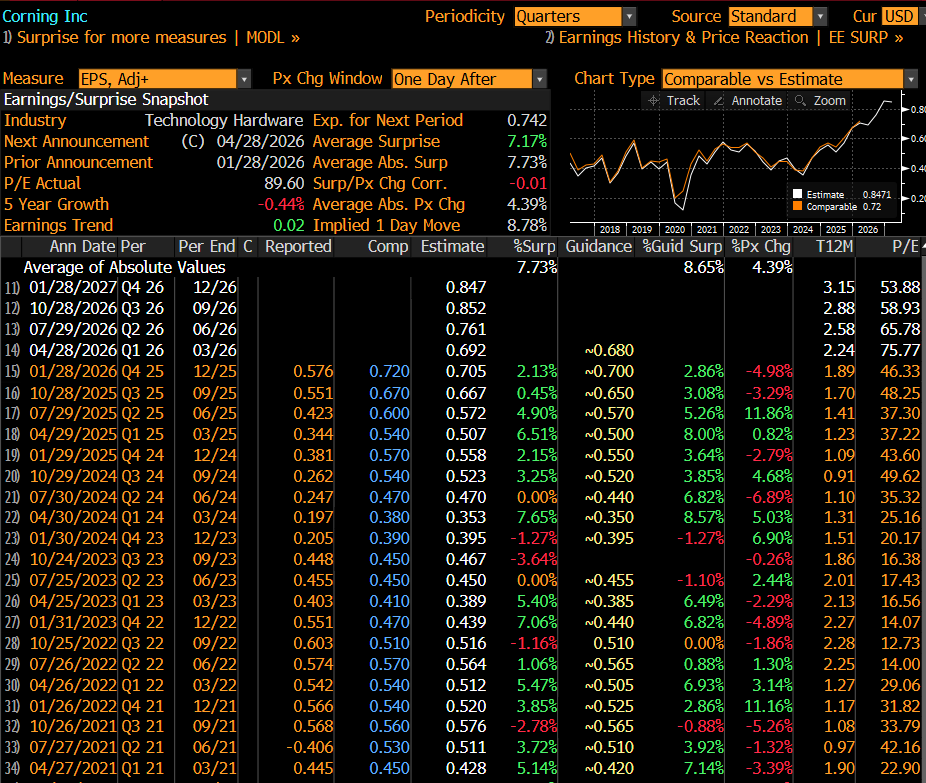
GLW (Corning) FQ1 earnings preview (reports Tues 4/28 before the US open) – sentiment is extremely bullish as investors anticipate AI-related demand tailwinds continuing to power the optical business. For Q1, the Street is looking for EPS of 69c with op. margins of 20.5%, and sales +16.7% to $4.29B (including Optical +28% to $1.73B, Display about flat at $907MM, Specialty Materials +5.1% to ~$525MM, Auto flat at $440MM, Life Sciences +2% to $239MM, and Hemlock +77% to $431MM).
GLW now trades at 89x earnings and is up 55% from the last earnings report and has upside exhaustion signals recently that stalled the upside action. I will continue to hold my 2% weight short as a break of the 160 level could gap fill down to 150 or lower.
The implied move is double the average move, with higher vols. The implied move is 8.78%
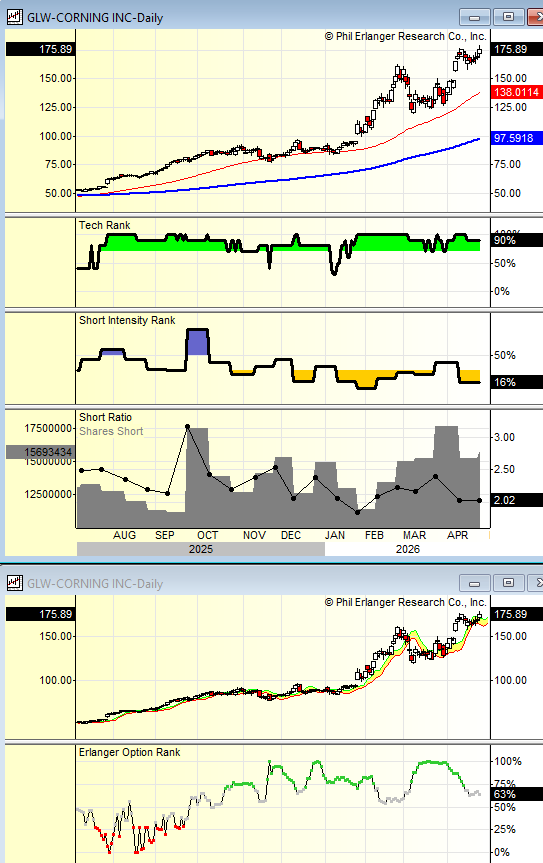
Short interest is mildly elevated with just 2 days to cover. On the Options Rank there was recent heavy put buying with the green dots which has moderated with more call buying. I would suspect the last gap up cleared out some shorts.
sEMIconductors parabolic action
The move with semiconductors in the last 3 weeks has been unprecedented. Today might be the first day in 19 days that the SMH semiconductor ETF is down on the day. I’ve gone through several semiconductor cycles/spikes and the eventual reversals down. Semiconductors are a cyclical industry with many commodity chips that go into many consumer and enterprise applications. It comes down to supply and demand. The capacity of other periods has always increased, yet this time is different and is stretching the cycle due to the high demand for AI datacenters. The latest upside move could be attributed to fears that supply is becoming even more constrained with the Strait of Hormuz closed, raising the risk that helium (a critical element) will not be available to semiconductor manufacturers. One thing that happened during the Y2K period was double and triple ordering, which helped move buyers up the list but ultimately canceled the extra orders.
Back in 2000, there was similar volatility, up, down, and up strong, with the double ordering ending quickly when some large telecom companies, much like some of the big buyers of networking, optical, and memory, started to cut the capex spending growth. This week, we’ll get capex details that might show slowing in capex growth rates. There is a problem that the market may not yet fully appreciate: powering all the data centers in use, in production, or planned for the future. There is a risk of overshoot in AI expectations if compute can’t be provisioned quickly enough, leading to delayed deployments. Paying for all the massive AI plans is also questionable, as several hyperscalers’ capex budgets exceed their annual cash flows, leading to debt in some cases and risky and uncertain partnerships with other businesses to share costs.
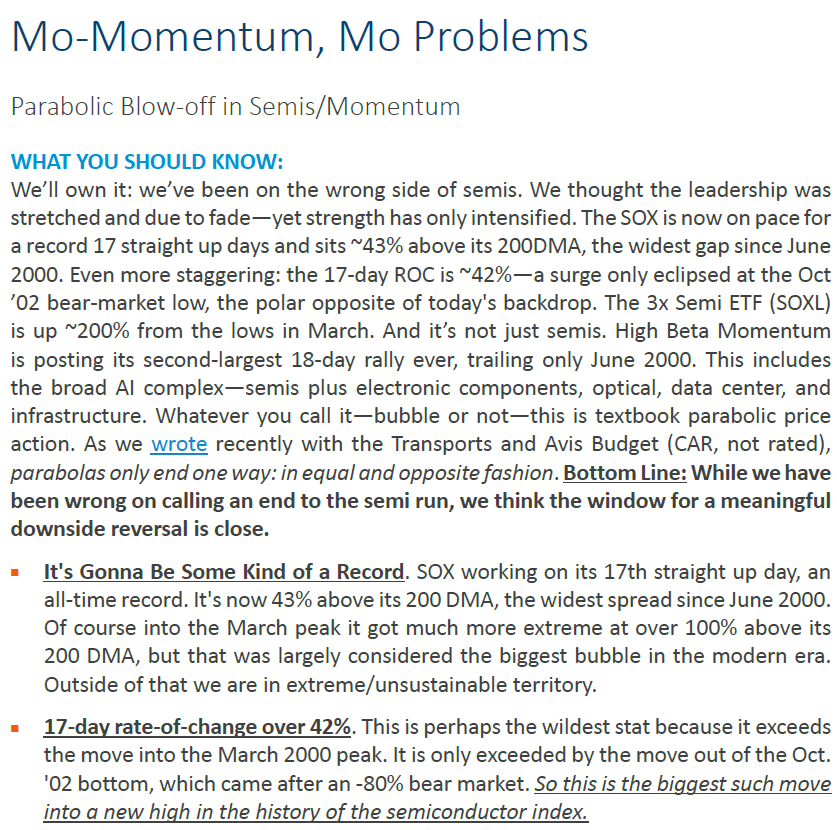
In regard to the semi stocks, much like the equity markets moved up recently on every Trump social media message saying “the US won the war, it’s over, talks are going well, Iran wants to make a deal badly”… semi stocks have gone up in sync with each company with any comments, even if the comments are just reiterating what we already know and heard. This isn’t uncommon, but the moves have been uncommon, and BTIG’s Jonathan Krinsky and I were chatting today about the parabolic moves that he wrote about recently with the group. As he pointed out, and I agree 100%, “parabolas only end one way: in equal and opposite fashion.” Thanks, Jonathan!
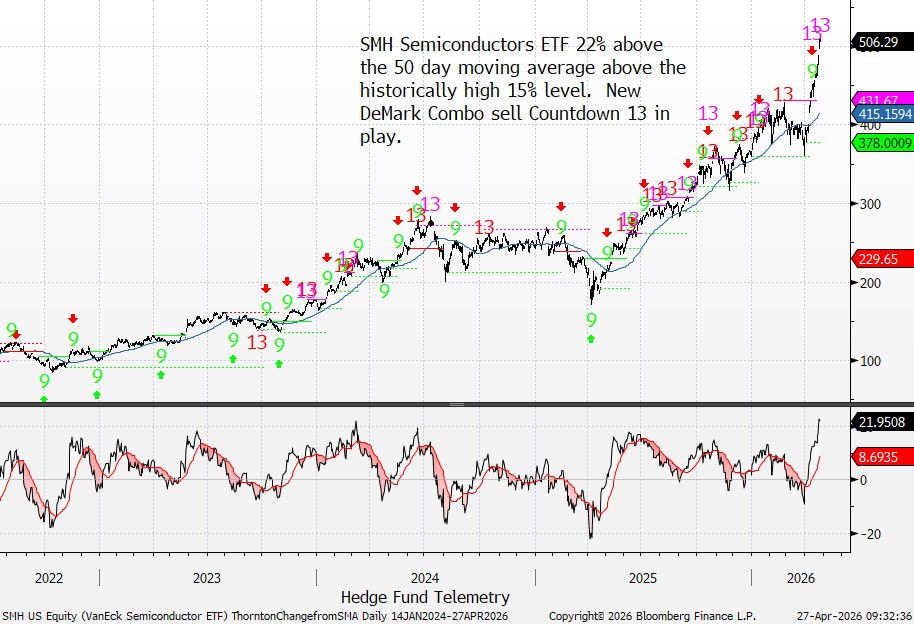
One chart I highlight at times of parabolic moves also shows SMH in parabolic mode as this is now at 22% above the 50-day moving average – the highest ever. I showed this one with GLD and SLV recently, when they went parabolic and were at historically elevated levels above their 50-day moving averages. There are also DeMark Combo sell Countdown 13’s suggesting upside exhaustion.
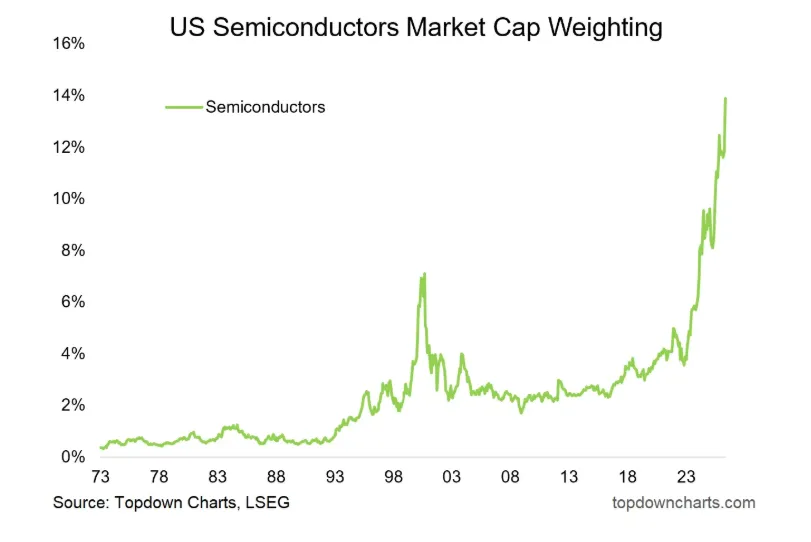
A similar large market cap spike occurred in 2000. Many semiconductor stocks then fell by 75% or more from their peaks.
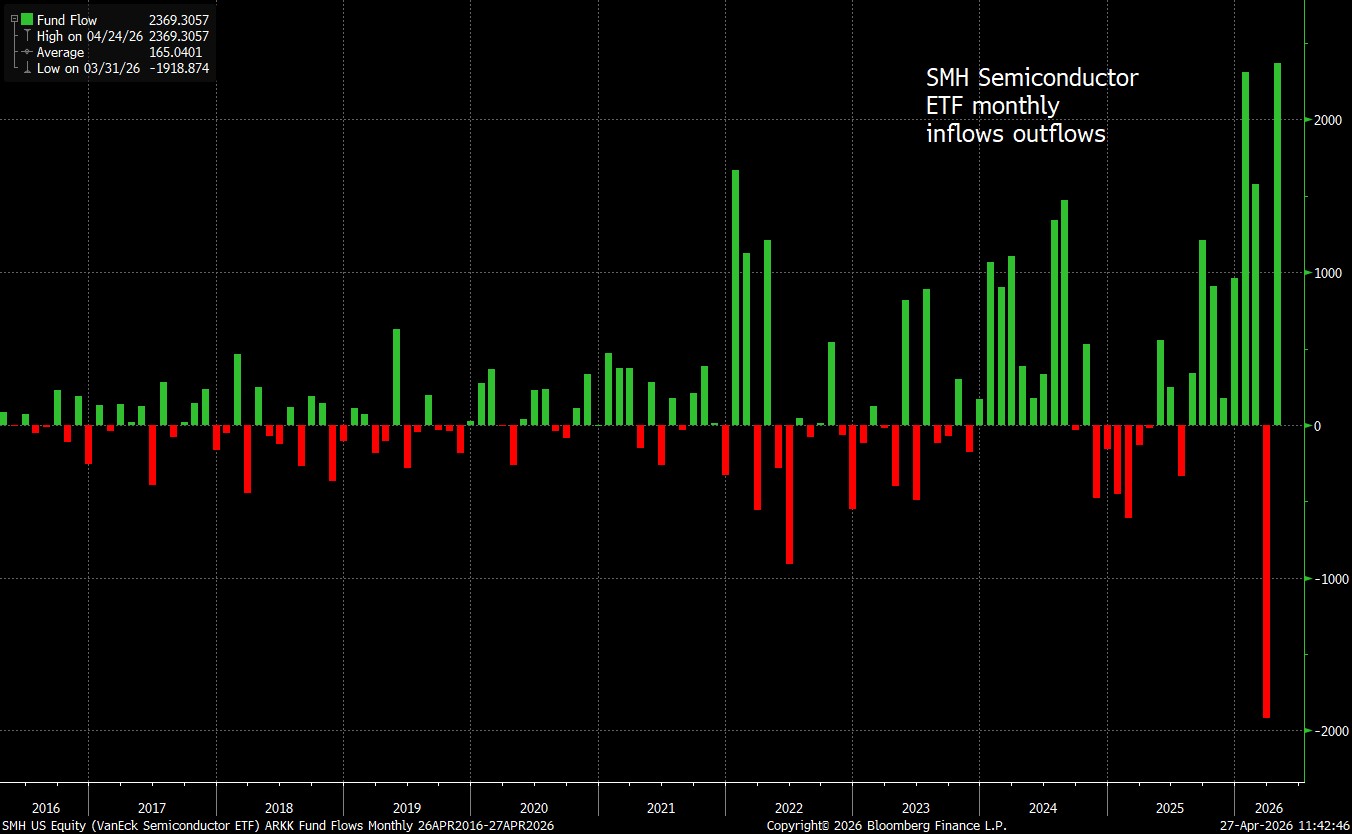
The volatility in SMH inflows/outflows shows recent record-high levels into SMH, with last month’s largest outflow followed by record inflows. GLD and SLV also saw record inflows and outflows during their parabolic moves. When inflows become so stretched, it’s clear that the recent upside performance has attracted retail and chasers who want to be in this. It creates a risk of quick trigger fingers, as we already witnessed last month. There is a risk of positioning crowding now.
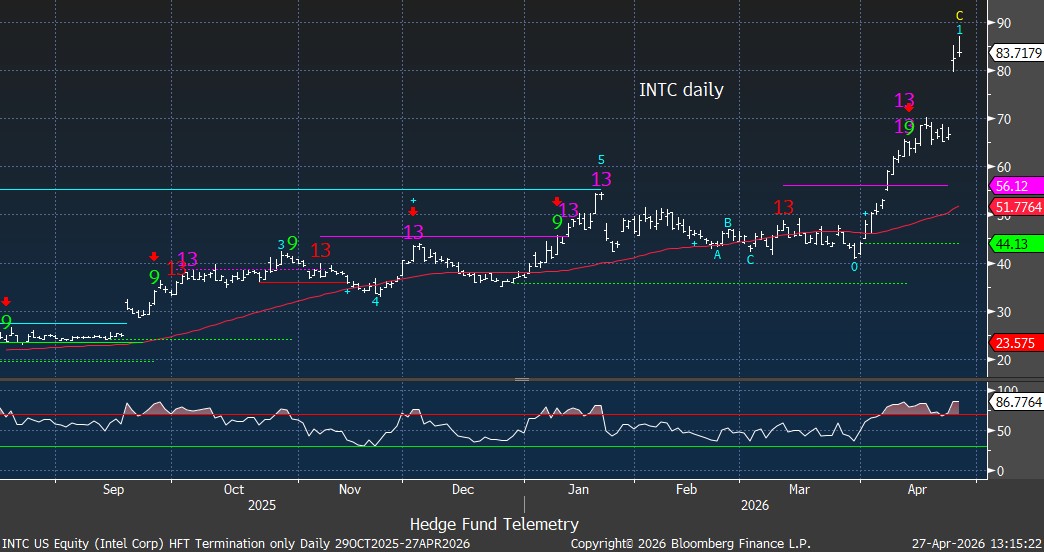
I have been wrong on INTC. I’ve discussed the valuation, the problems, and longer-term fixes that are not coming in the near term and are not even guaranteed to work. I thought the recent move from 40-nearly 70 was going to see a pullback. Wrong. The move is extreme after the earnings considering the upside into the print. The VWAP after the gap up is 83.30 with gap risk at 80. Breaking below these levels could see the crowding into this unwind fairly quickly. My cost on my outsized short cost basis is now ~60, and I see that level as very realistic.
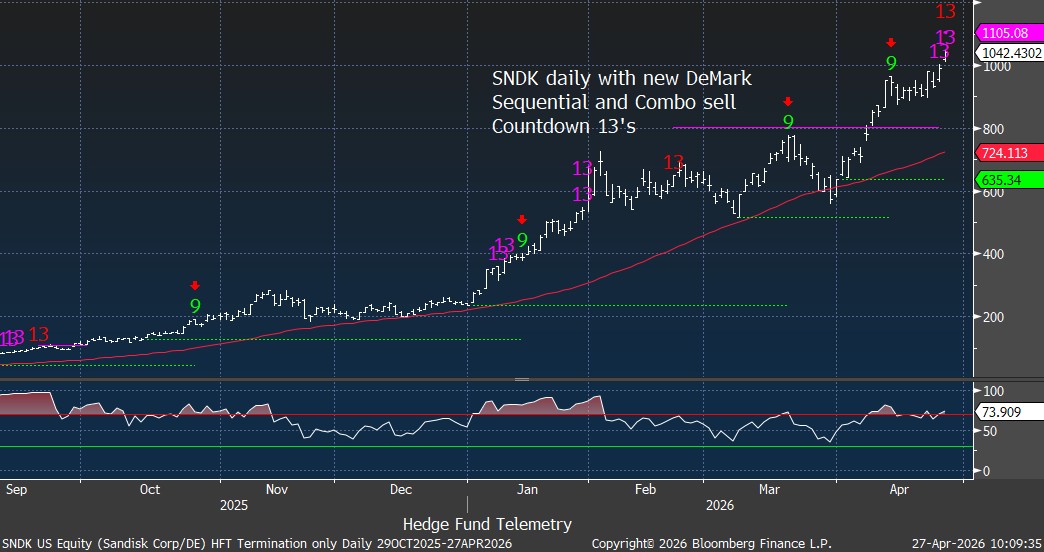
SNDK has new Sequential and Combo sell Countdown 13’s now in play.
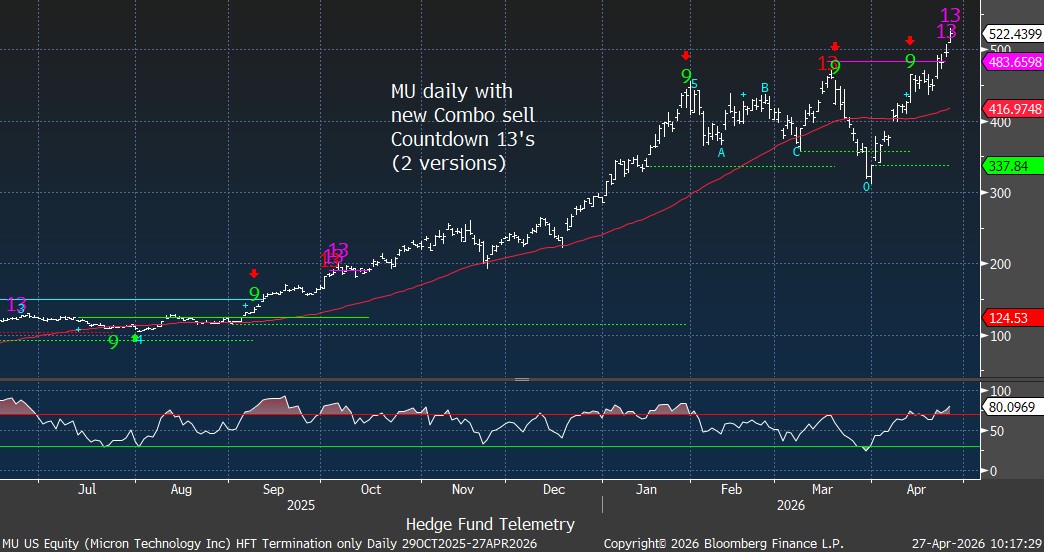
MU with new Combo sell Countdown 13’s (two versions) with RSI elevated at 80
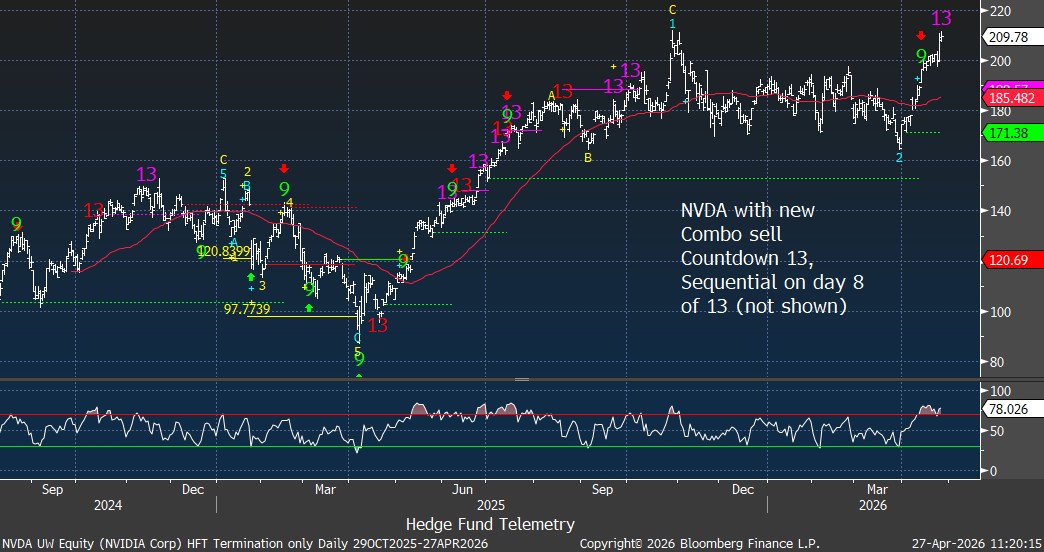
NVDA has a new Combo sell Countdown 13 today with an elevated RSI
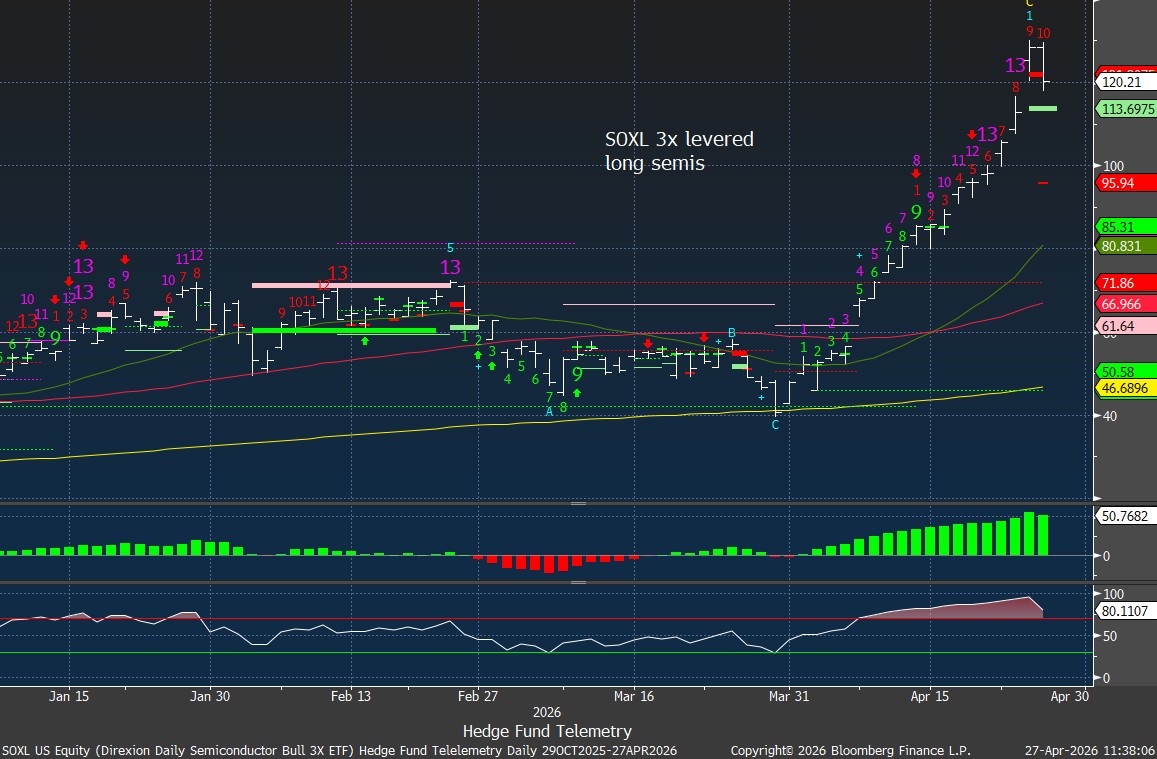
The 3x levered SOXL long semis is up 200%
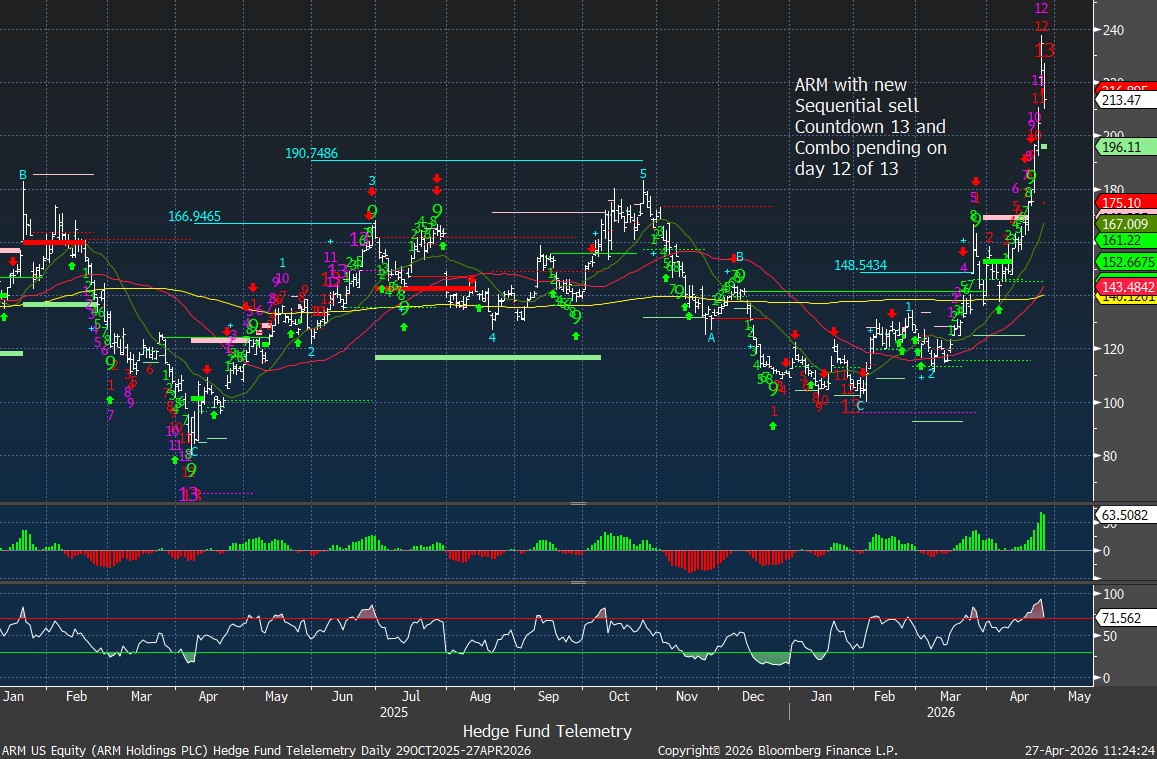
ARM is the most overbought semi on my monitor, with it 65% above the 50-day, and it’s down 8.5% today.
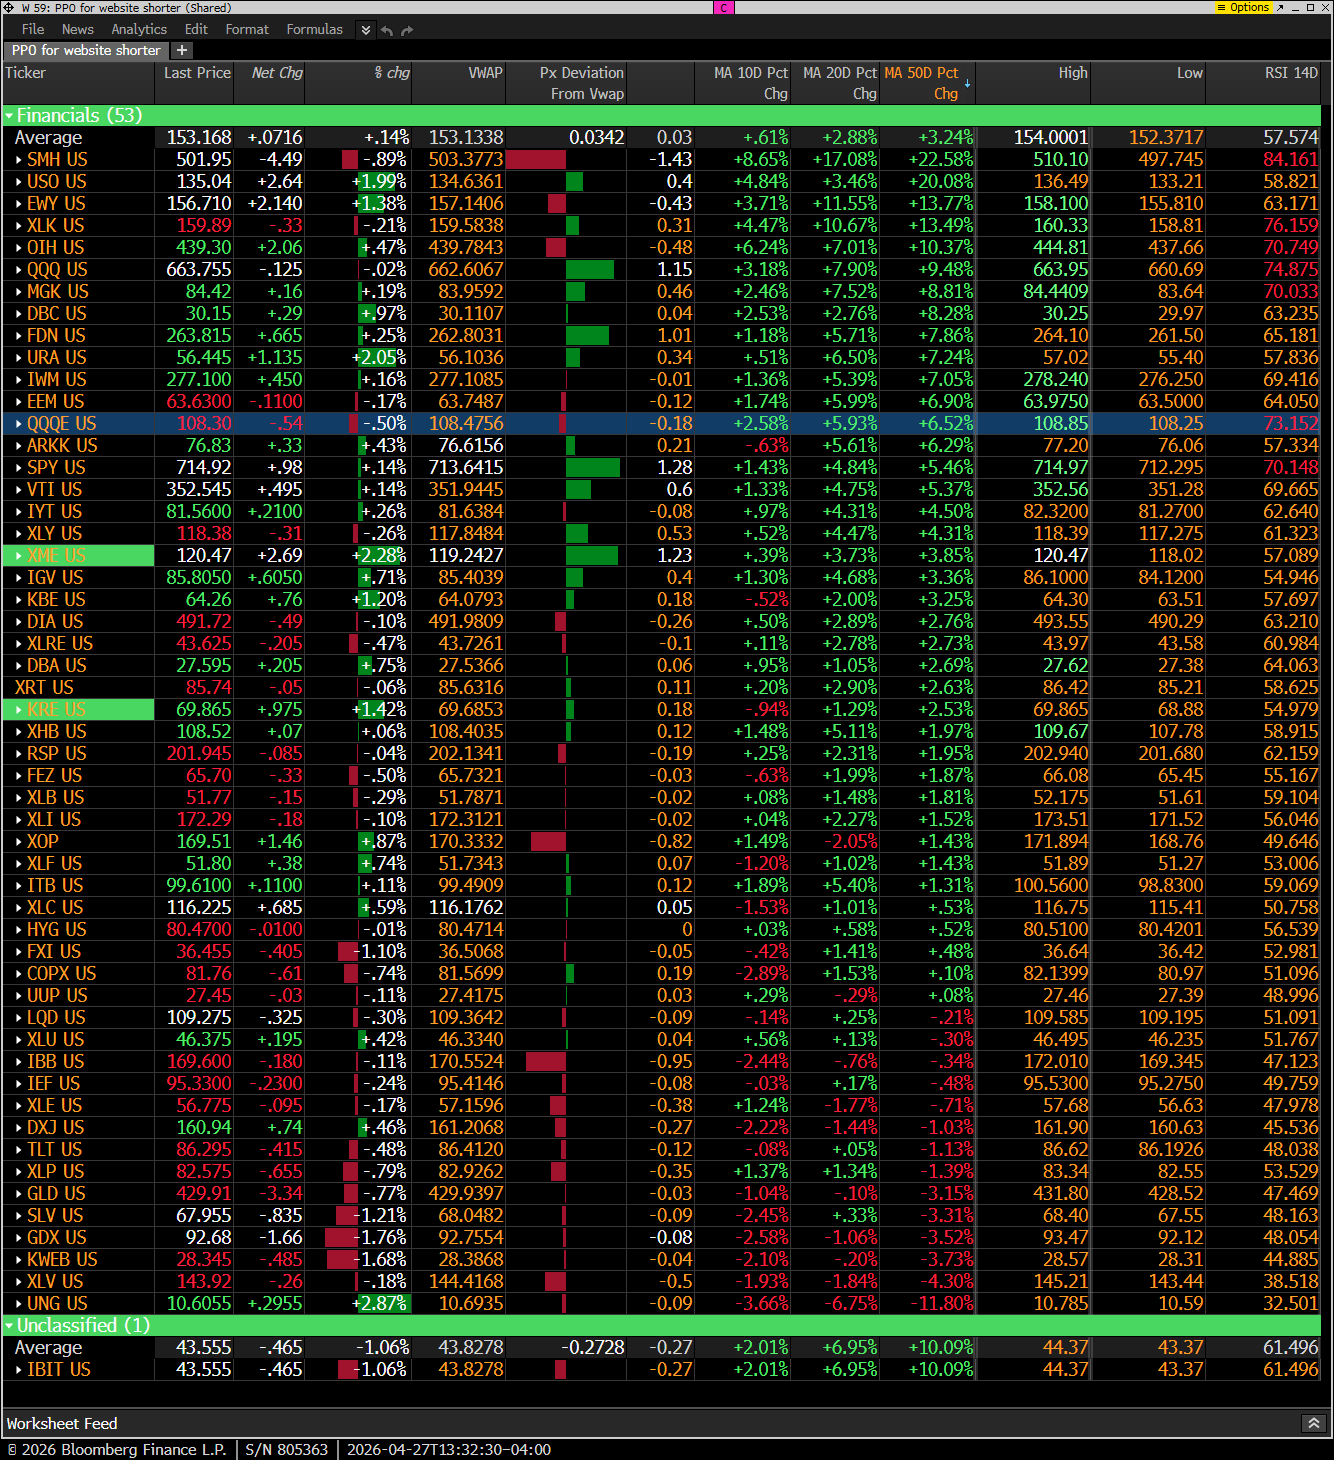
Hedge Fund Telemetry ETF Percentage Price Oscillator Monitor
The PPO monitor (percentage price oscillator) force ranks ETFs by percentage above/below the 50-day moving average. This monitor and others are offered to Hedge Fund Telemetry subscribers on Bloomberg.
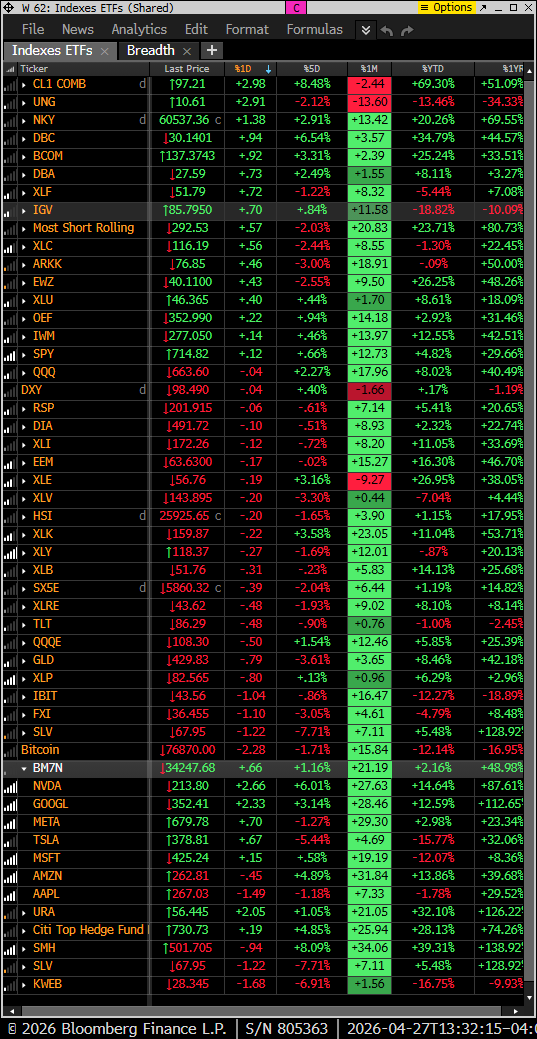
Index ETF and select factor performance
ETF with today’s performance with 5-day, 1-month, and 1-year rolling performance YTD. Crude has seen the largest move in the last 5 day period.
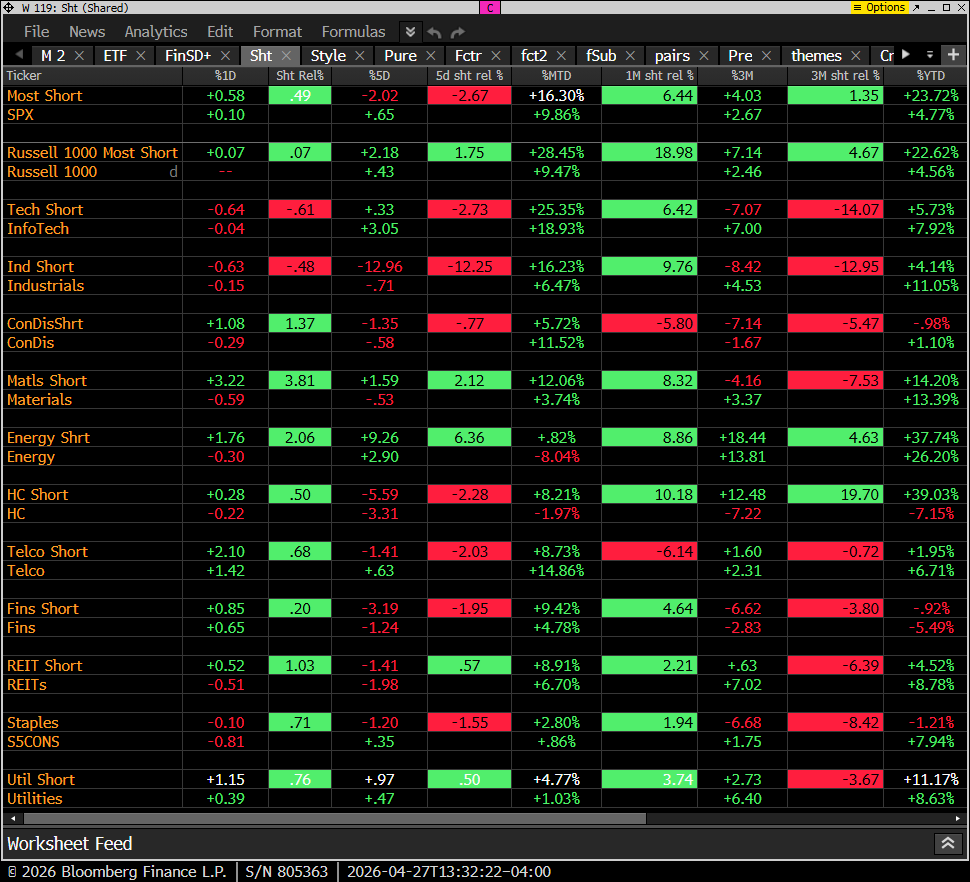
Goldman Sachs Most Shorted baskets vs. S&P Indexes
This monitor has the S&P indexes and the Goldman Sachs most shorted baskets. Muted Index action with short squeezing seen with consumer discretionary, materials, energy, telco, financials, real estate, and utilities.
DeMark Observations
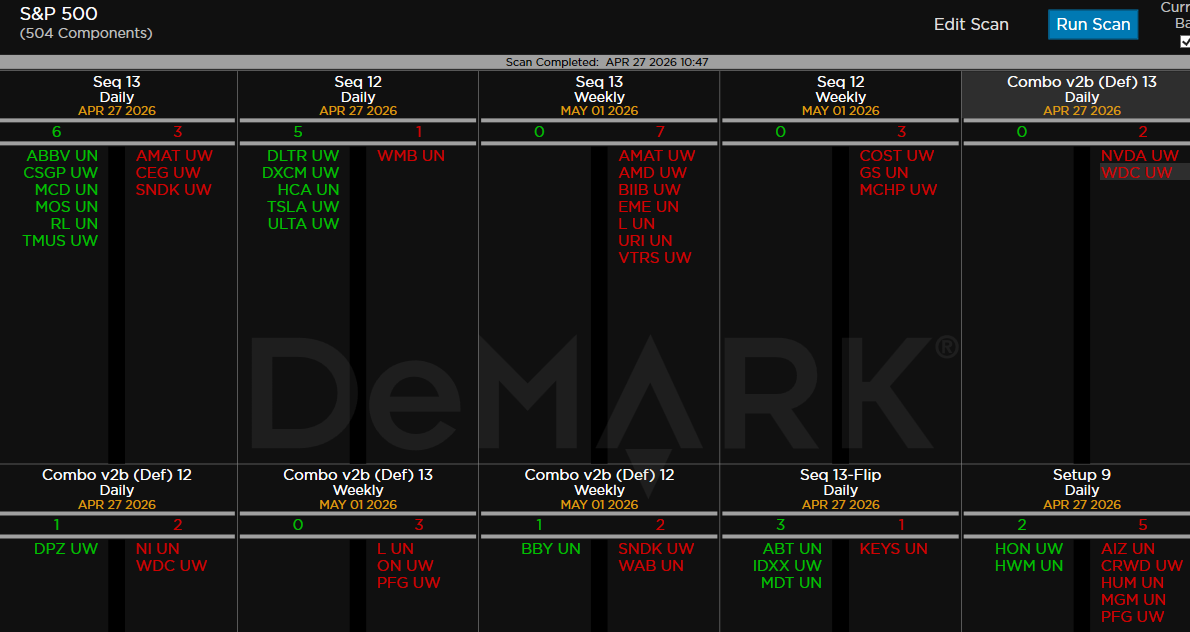
Within the S&P 500, the DeMark Sequential and Combo Countdown 13s and 12/13s on daily and weekly periods. Green = buy Setups/Countdowns, Red = sell Setups/Countdowns. Price flips are helpful to see reversals up (green) and down (red) for idea generation. The extra letters at the end of the symbols are just a Bloomberg thing. Worth noting: With the indexes at new highs we typically see more sell Countdown 13’s vs buy Countdown 13’s. It’s been very unique led by semi’s which have both daily and weekly sell signals developing with AMAT, SNDK, AMD, MCHP, NVDA, WDC
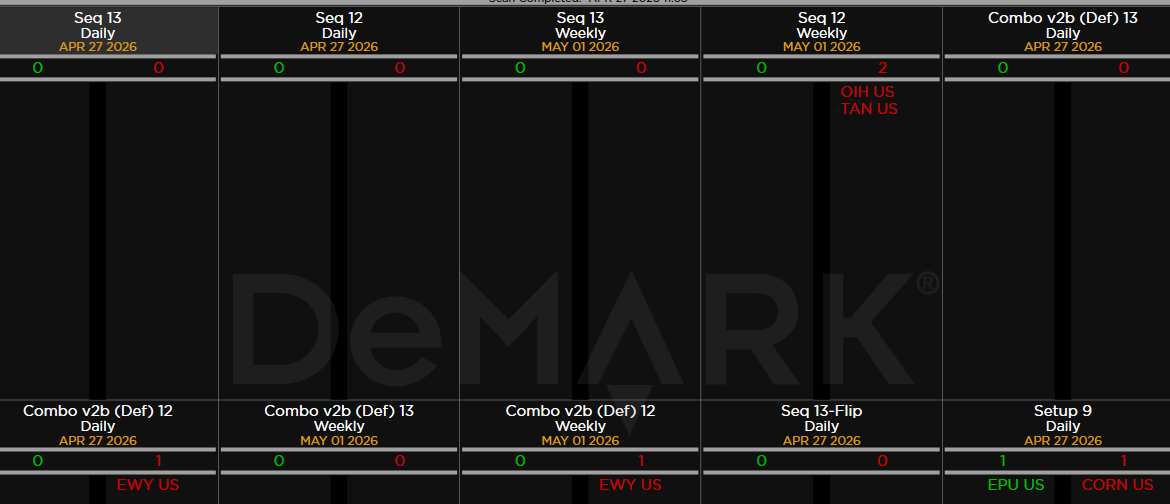
Major ETFs among a 160+ ETF universe. Quiet – watching EWY Korean ETF with Combo daily and weekly both on 12/13.
If you have any questions or comments, please email us. Data sources: Bloomberg, DeMark Analytics, Goldman Sachs, Street Account, Vital Knowledge, Daily Sentiment Index, and Erlanger Research