
- Use this link to sign up now. Thank you to many of you who have already signed up early! The response has been overwhelming and gratifying.
- $250 / year
- $400 discounted for two years
Introductory Offer: The first 1,000 subscribers receive: $250 per year or $400 every 2 years — locked in for life
The Big Picture framework will continue to evolve with:
- expanded market probability models
- deeper cross-asset analysis
- enhanced fragility mapping
The focus will shift between equities, macro, rates, commodities, and currencies depending on where the most important opportunities and risks exist. Let us know if you have any questions or issues signing up. There’s a lot happening, so let’s begin.
One quick comment with the portfolio – if you followed and bought the recently recommended TSLA April 11th put spread 365-350 bought for $3.25 it’s now trading below the lower strike. You can either hold it through the week and hope the lower strike decays with the price under or take the gain with it trading at $10.50. (I say take the gain) The SPY and QQQ put spreads expiring this Friday still have some work to do for us.
Big Picture Summary
The markets are transitioning from late-cycle complacency into early-stage instability, not yet a completed reset.
- Equities: Exhaustion → breakdown → with attempt at stabilization
- Rates: Restrictive and rising → no policy cushion with Fed likely on hold in 2026.
- Inflation: Re-accelerating (energy-led) CPI this week should be quite hot
- Liquidity: Deteriorating beneath the surface, Private Credit/Equity redemption concerns.
- Positioning: Reset, but not washed out. Buy the dip crowd and passive ETF buyers are less enthusiastic but still there.
This aligns with the March Big Picture prior framework:
Markets are no longer just trading liquidity + AI — they are trading with the backdrop of headline risk driven by volatile social media posts, Iran war, energy, rates, and policy risk.
Bottom line:
This is a process phase, not a durable low.
Hedge Fund Telemetry – Market Dashboard
- Macro Score: Negative
- Fragility: Elevated / Rising
- Sentiment: Oversold condition, and not trigger by itself
- Liquidity Trend: Deteriorating
Interpretation:
A fragile late-cycle unwind, no capitulation signs yet.
Hedge Fund Telemetry – Macro Scoreboard
| Category | Score | Direction | Commentary |
|---|---|---|---|
| Liquidity | -2 | ↓ | Private credit stress + higher real yields |
| Monetary Policy | -1 | → | Restrictive, optional tightening bias |
| Growth | 0 | ↓ | Slowing but not breaking |
| Inflation | +2 | ↑ | Energy + ISM prices re-accelerating |
| Market Internals | -2 | ↓ | Breadth deterioration persistent |
| Sentiment | +1 | ↑ | Reset but not washed |
| Valuation | -1 | ↓ | Still elevated vs rates |
| Credit | -1 | ↓ | Early stress signals emerging |
| Geopolitics | -2 | ↑ | Now a primary macro driver |
Macro Score Total: -6 → HIGH RISK
Interpretation:
System is transitioning from late-cycle expansion → instability phase, consistent with the March note
Market Fragility Index Level: 8 / 10 → ELEVATED
| Asset Class | Fragility | Directional Bias | Key Driver |
|---|---|---|---|
| S&P 500 | Medium | Downside skew | Weak breadth + rising rates |
| Nasdaq / AI | High | Downside risk | Crowded positioning + DeMark 13s |
| Rates (USTs) | High | Yields higher | Inflation + supply |
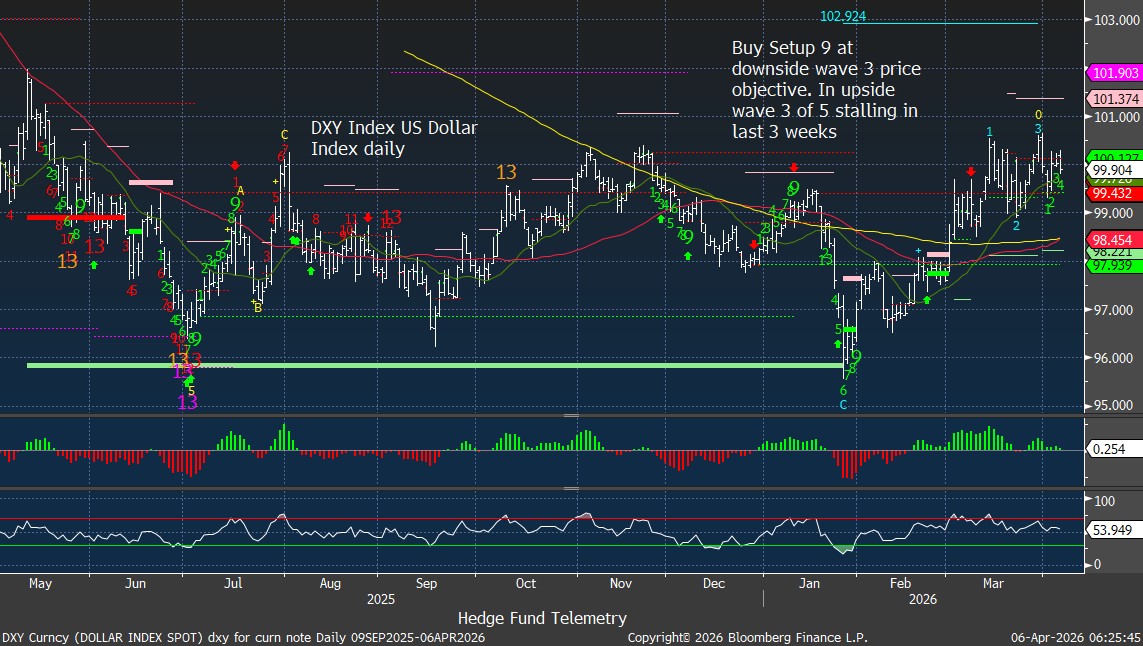
| Dollar (DXY) | Medium | Upside bias | Policy divergence |
| Commodities | High | Two-way risk | Crowded inflation trades |
| Credit | High | Downside | Liquidity cracks |
| Global Equities | High | Downside skew | Synchronized exhaustion |
Key Observations
- DeMark clusters across global indices → late-cycle exhaustion
- Commodities + crude sentiment extreme → crowded inflation trade
- Equities not fully washed → no capitulation signs yet
- Rates rising into slowing growth → unstable, dangerous mix
Conclusion:
Fragility is being driven by cross-asset divergence + tightening conditions, not equity sentiment alone.
The Charts That Matter
Equities – Exhaustion → Stabilization Attempt
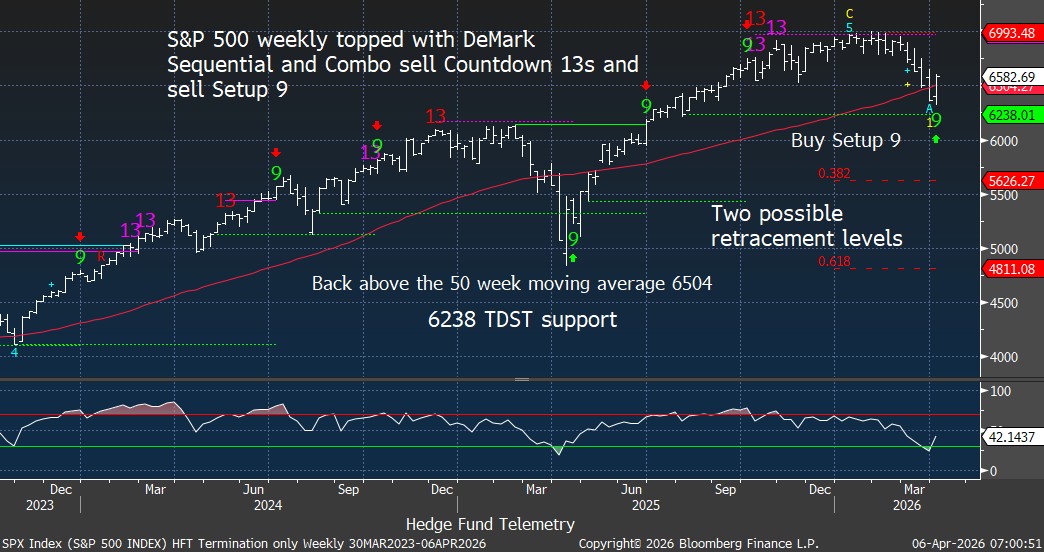
- S&P 500:
- Weekly Sequential + Combo 13s at highs with rolling top
- Holding above ~6238 TDST support
- Below short-term trend, above key structural support
- New buy Setup 9 → tactical bounce regime while continuation lower will see a new Sequential Countdown begin
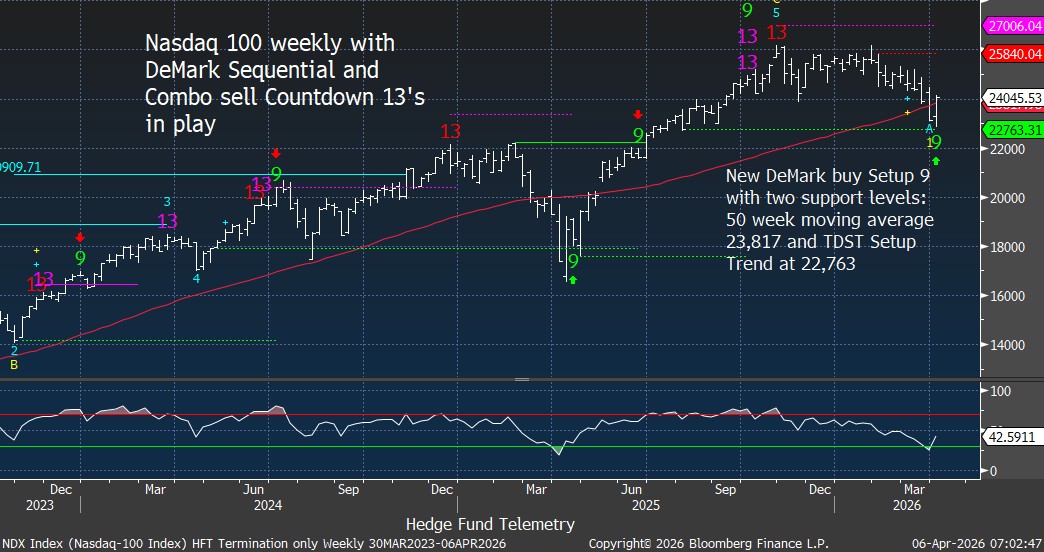
- Nasdaq 100:
- Multiple exhaustion signals with rolling top.
- New buy Setup 9 → tactical bounce regime while continuation lower will see a new Sequential Countdown begin
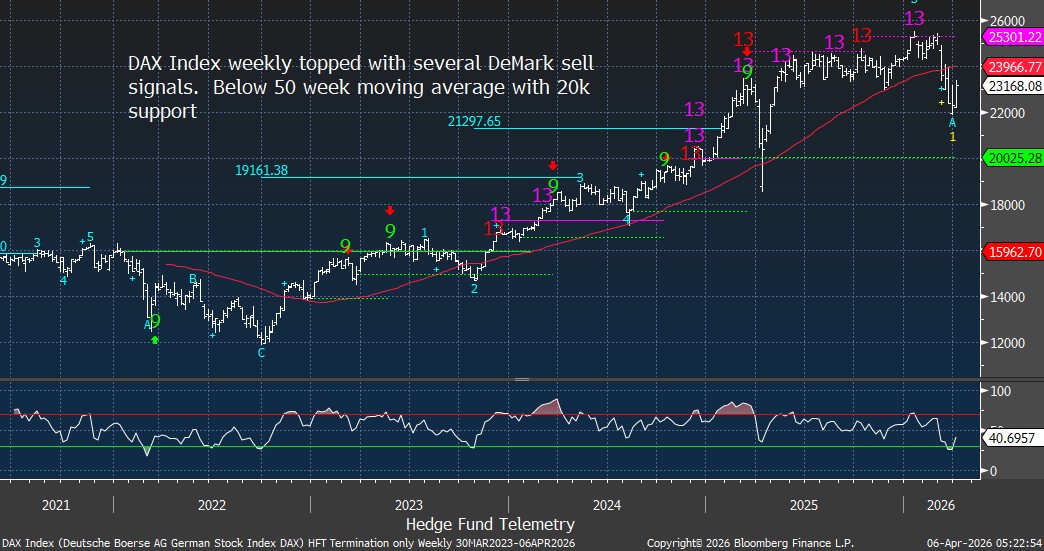
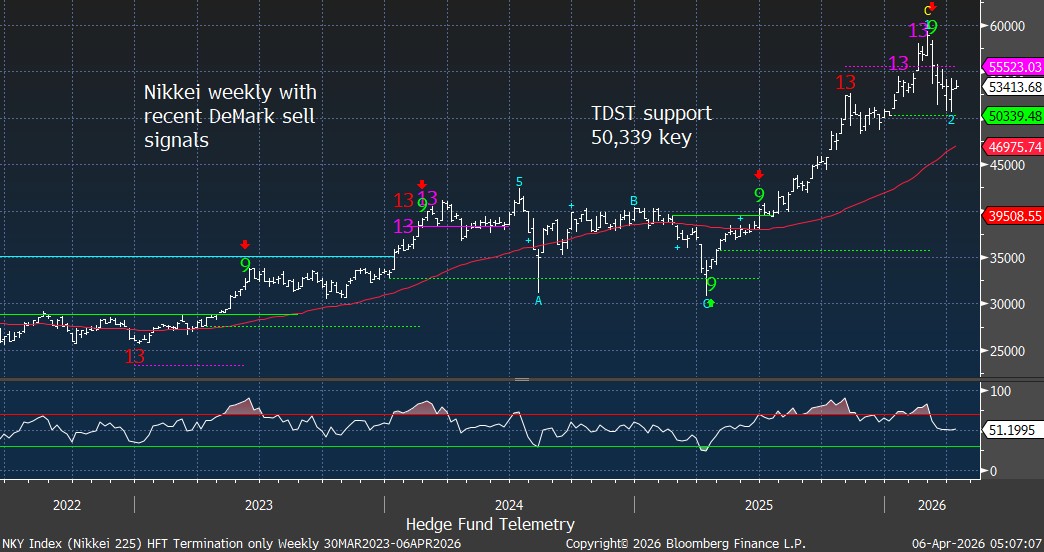
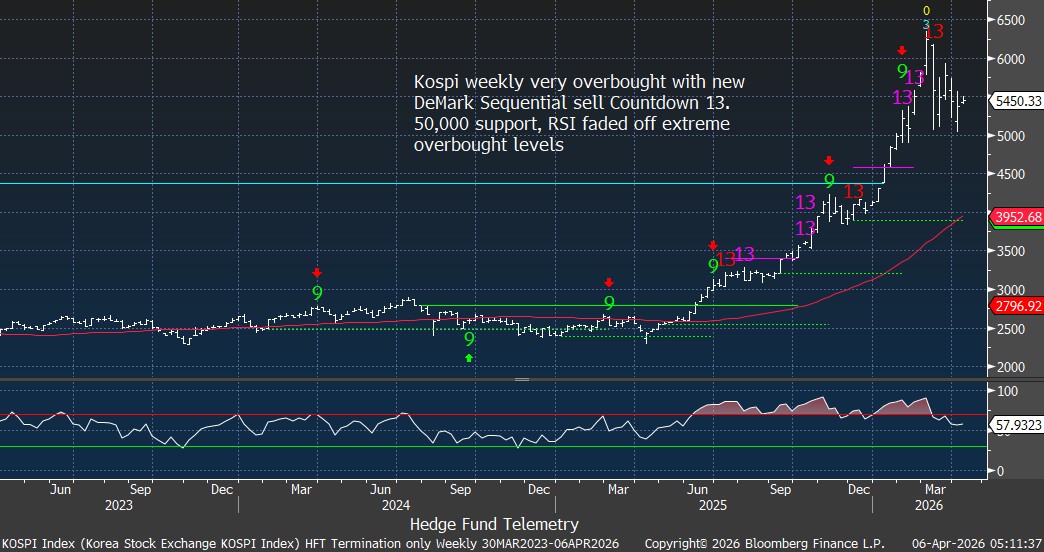
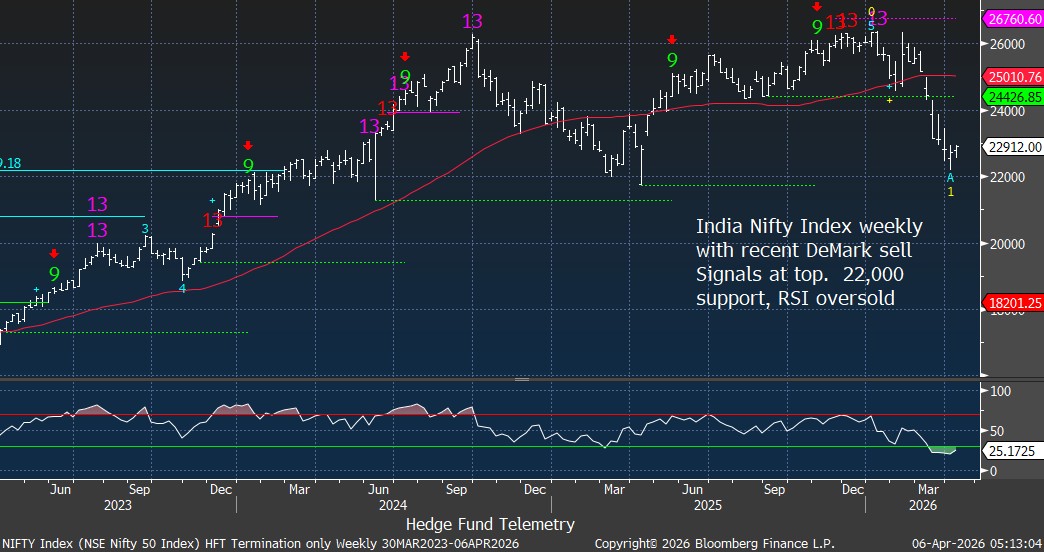
- Global Equity Markets:
- DAX, Nikkei, KOSPI, Nifty → similar exhaustion clusters
- Europe weaker structurally
Takeaway:
Equities are late-cycle, not broken — but no longer trending cleanly.
Rates – The Liquidity Problem
- Rates are no longer a shock absorber — they are the constraint.
- Bond selloff creates liquidity problem.
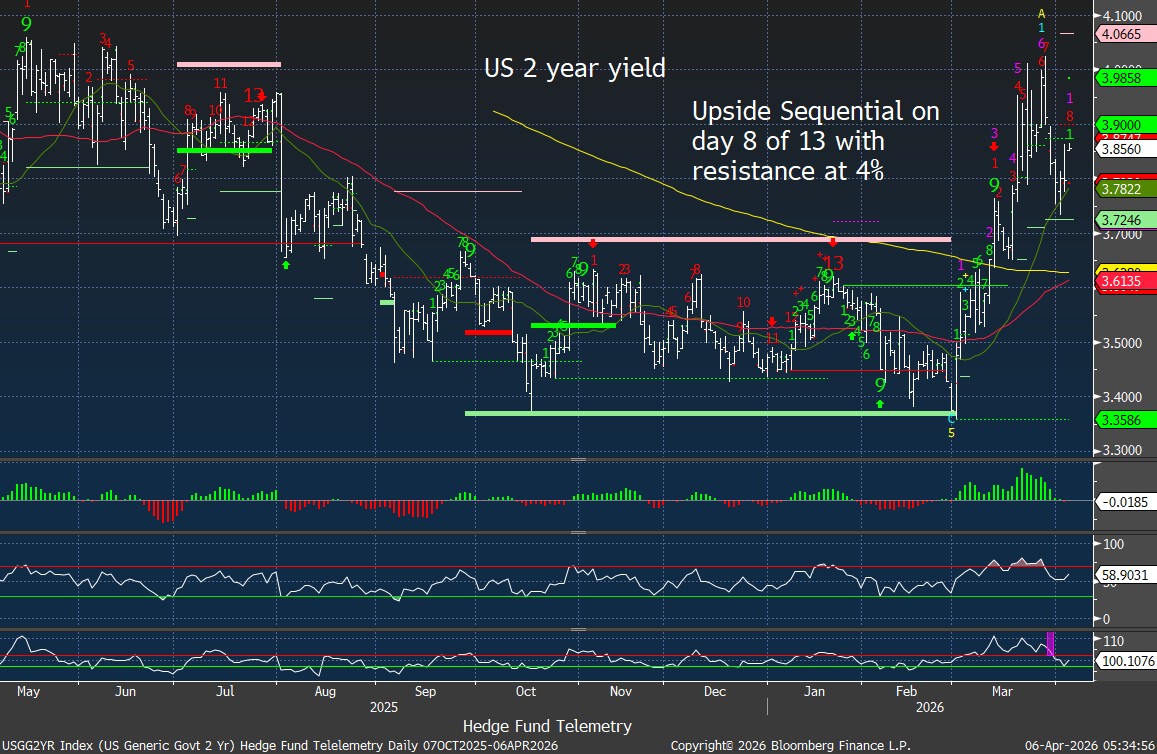
- 2Y: Trending higher toward ~4%
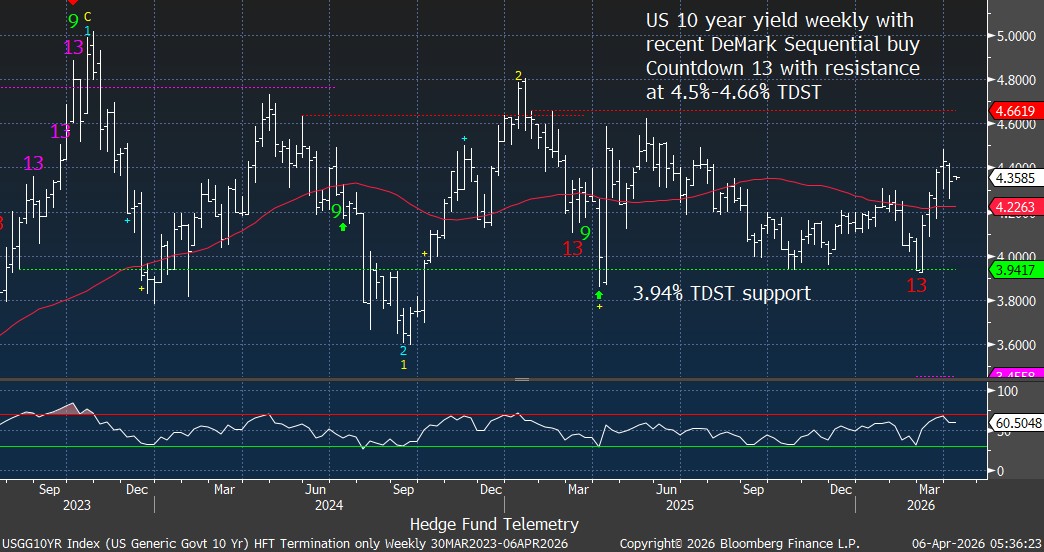
- 10Y: Weekly buy Countdown 13 → yields bottoming, resistance ~4.5–4.6%
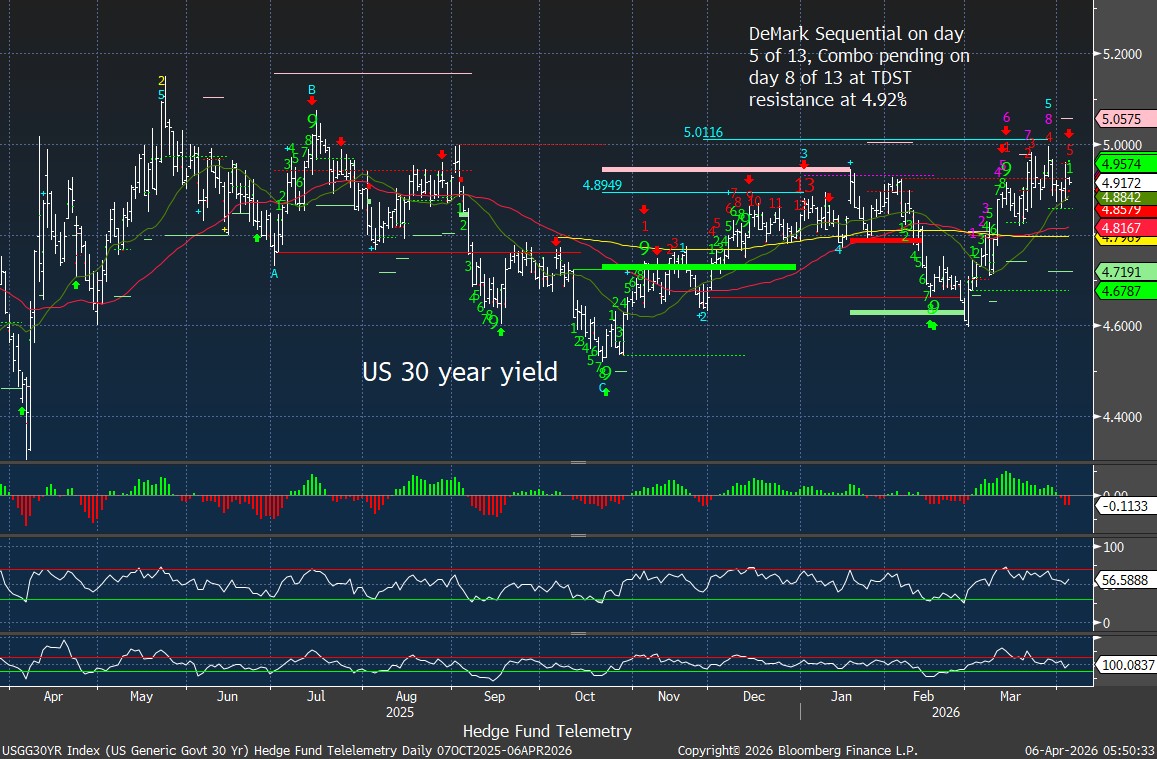
- 30Y: Pushing toward upper range near 5%
- Implication:
- Rising yields = tightening financial conditions, a key headwind.
US 2 year yield with upside DeMark Sequential in progress
US 10 year yield with upside DeMark Sequential in progress
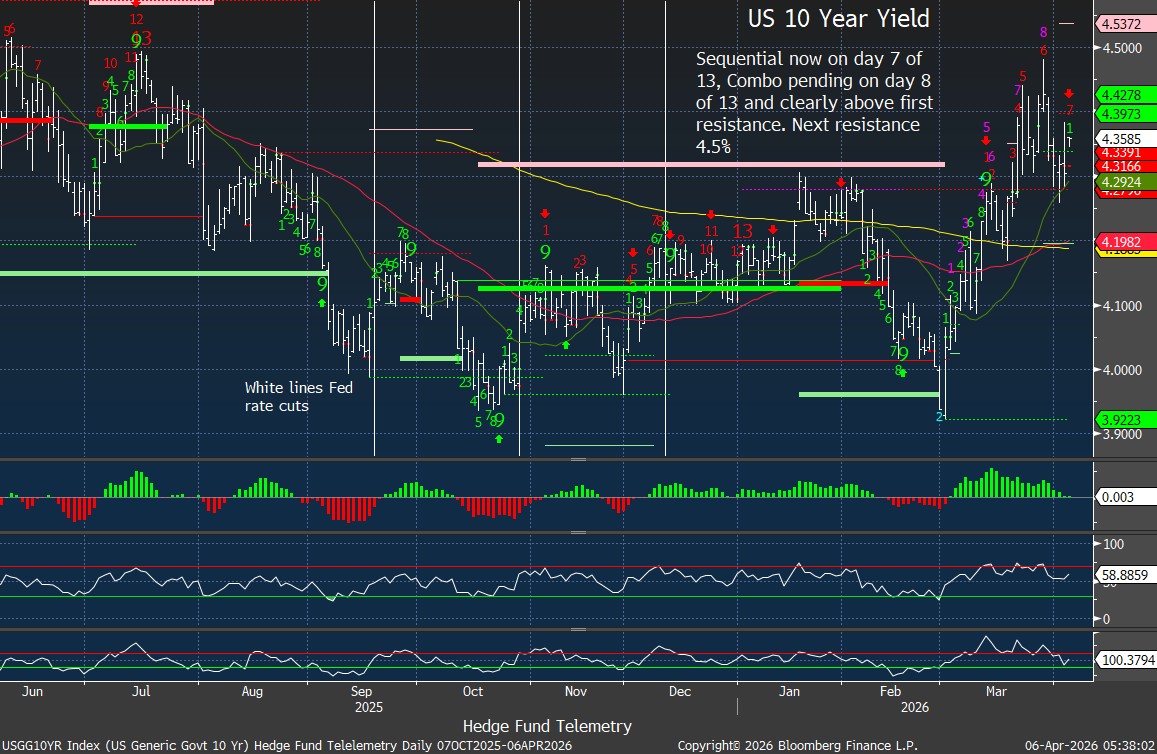
10 year yield weekly still with lower highs from 2023 although recent DeMark Sequential buy Countdown 13
US 30 year yield with upside DeMark Sequential in progress nearing 5% resistance and likely alarm bell level
FX – Dollar strength
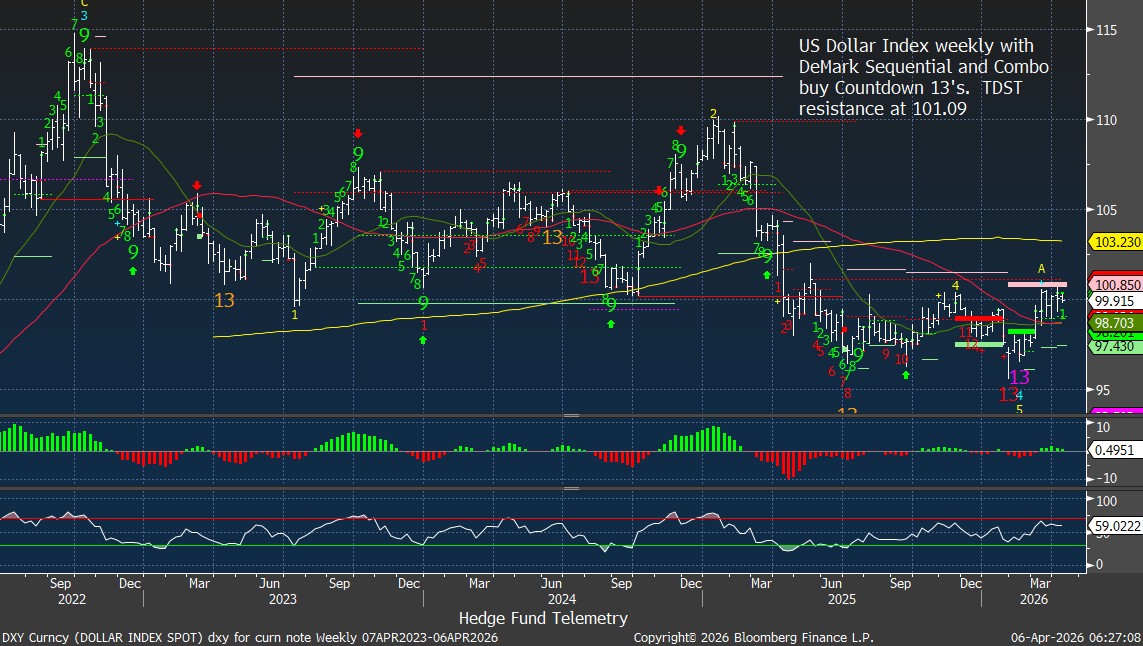
- DXY: Weekly buy 13 completed → dollar bottom likely in yet at resistance on daily time frame
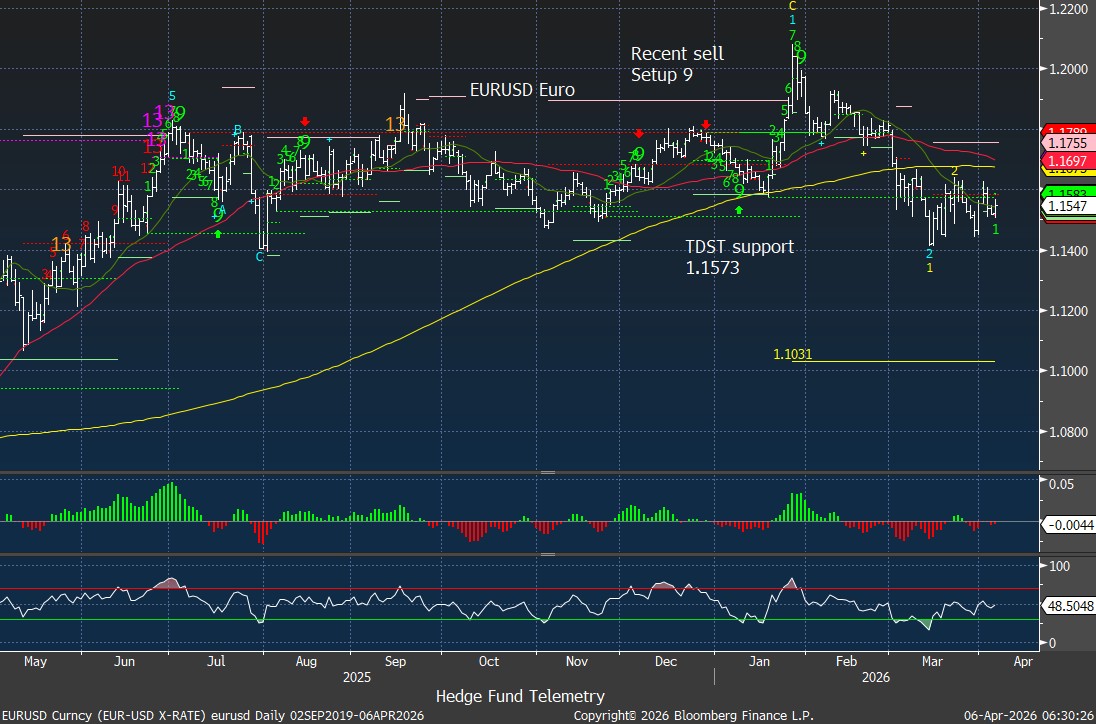
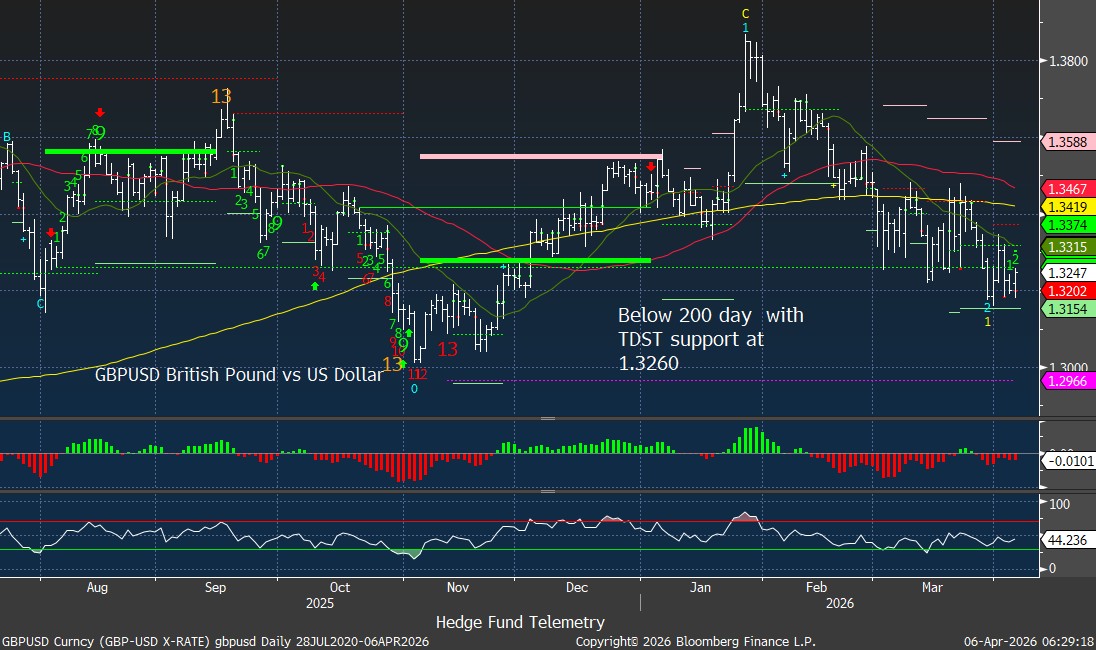
- EUR / GBP: Weak vs USD from January, testing support
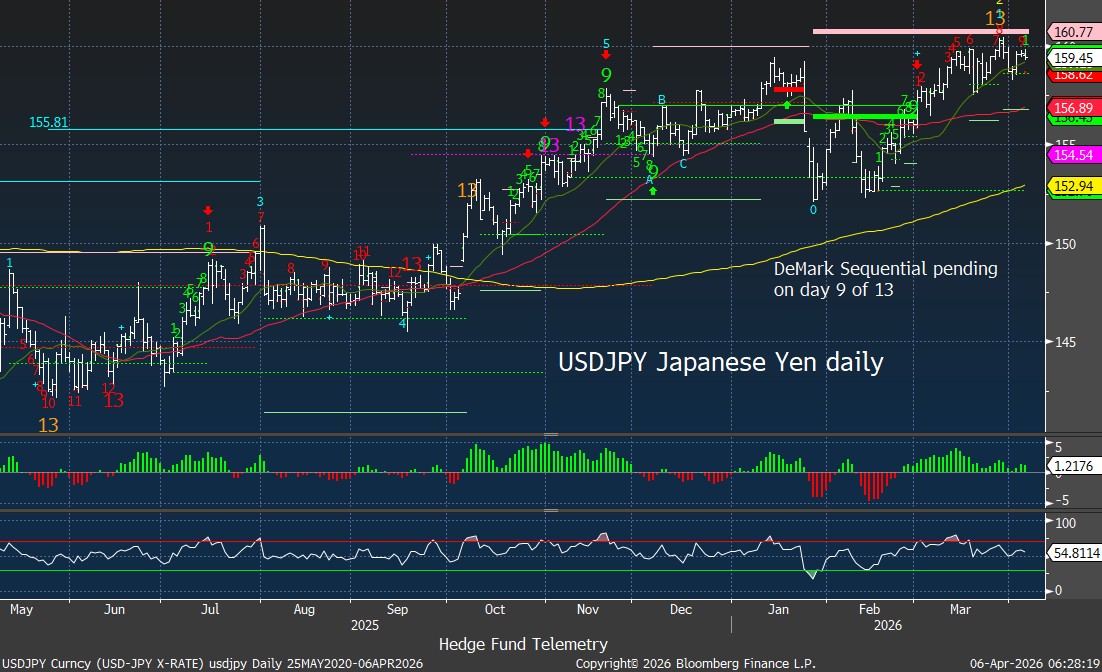
- USDJPY: Elevated, liquidity tight
- Takeaway:
- Dollar strength reinforces global tightening and risk pressure.
US Dollar Index weekly had recent DeMark buy Countdown 13’s
Yen weakness (USDJPY) continues with Sequential in progress
Euro peaked in January and it trying to hold support
British Pound had started to weaken from January breaking TDST support
Commodities – What has been strongest
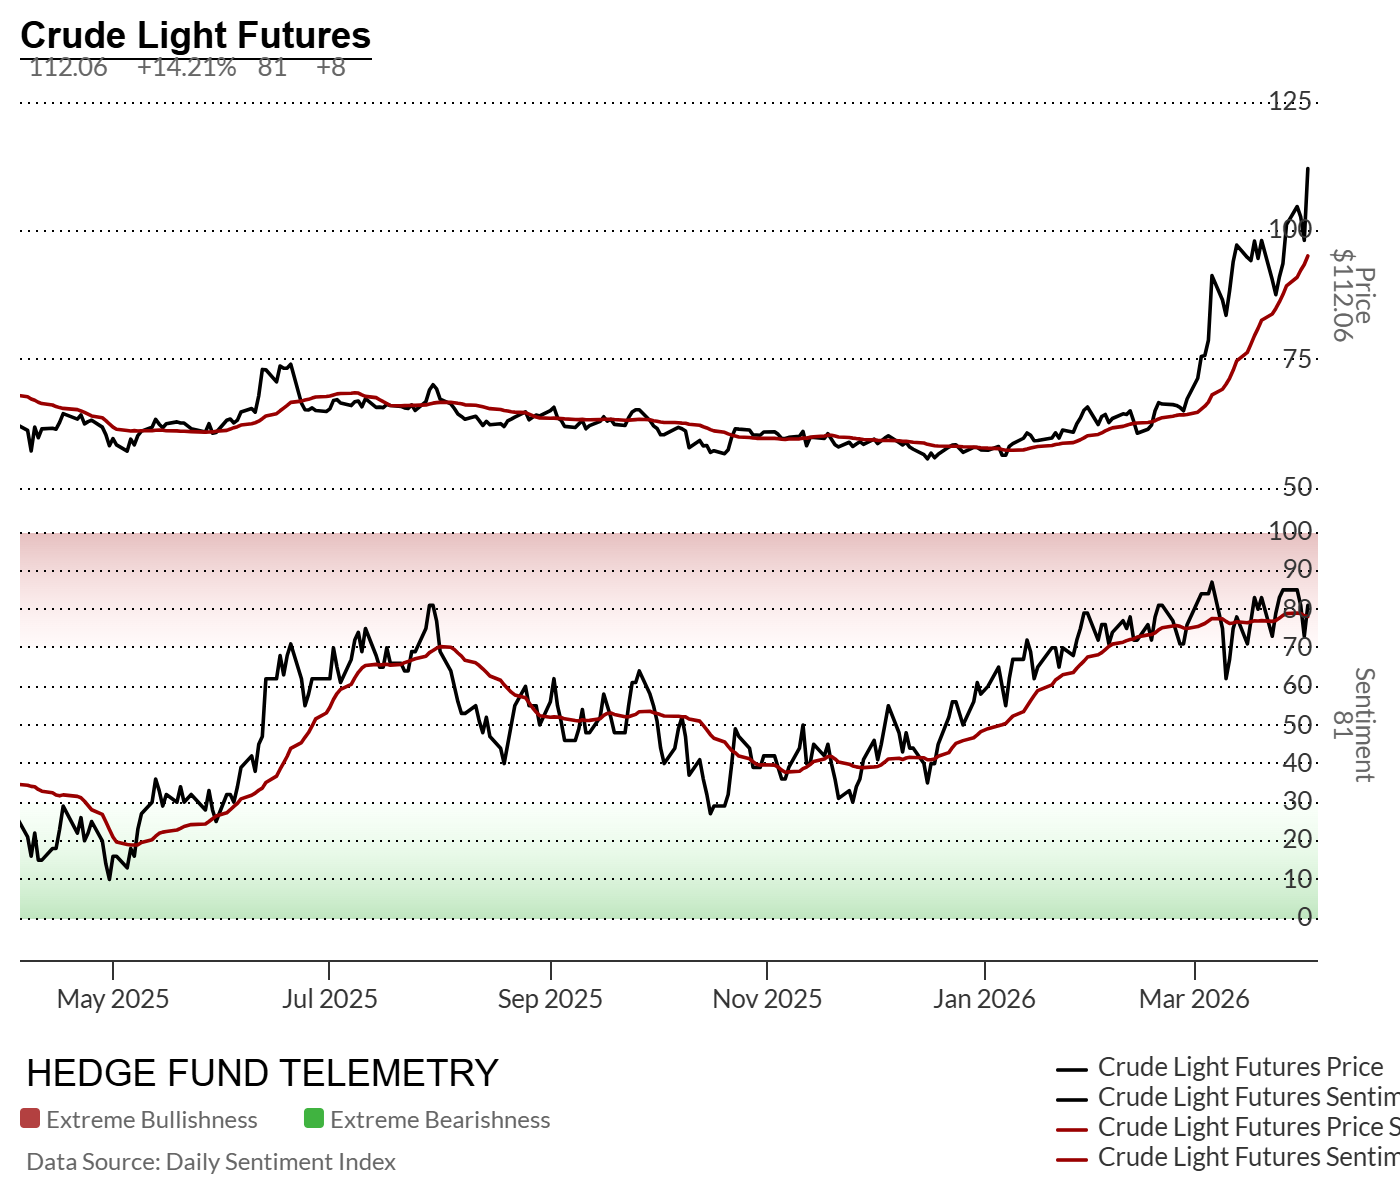
- Crude:
- Strong trend with DeMark Sequential in progress
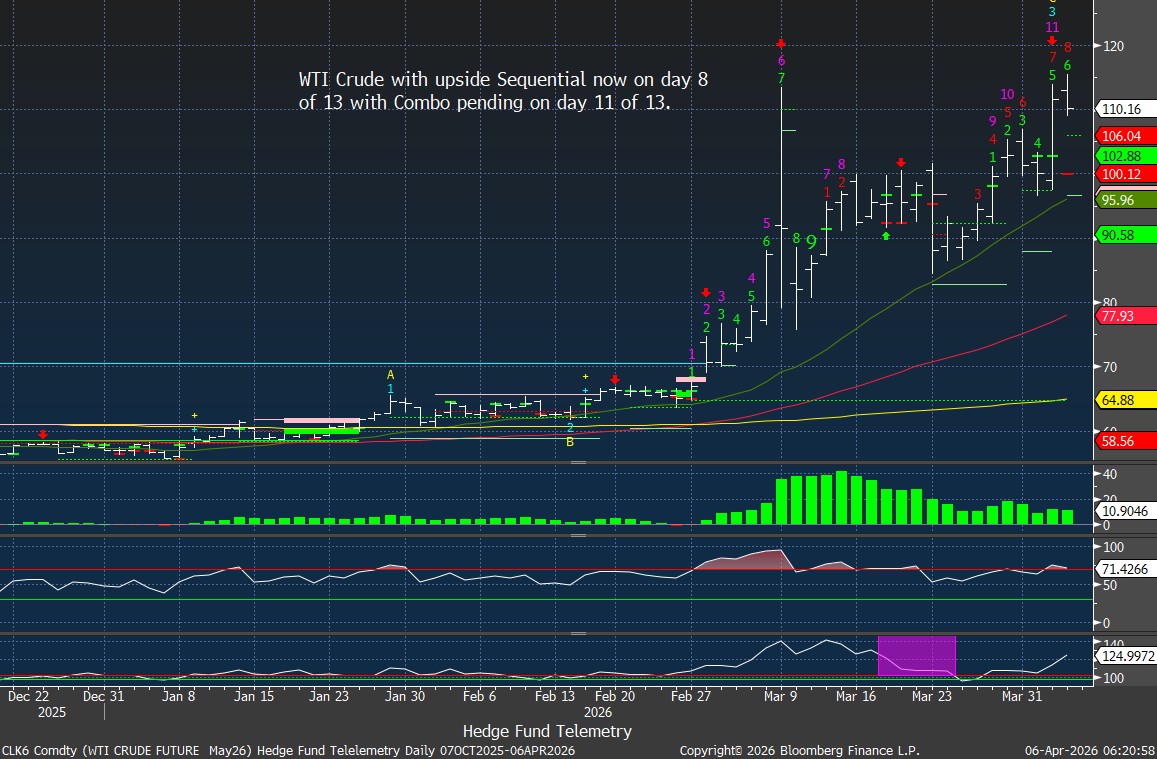
Crude bullish sentiment at 81% remains in the extreme zone. It can and might stay extreme
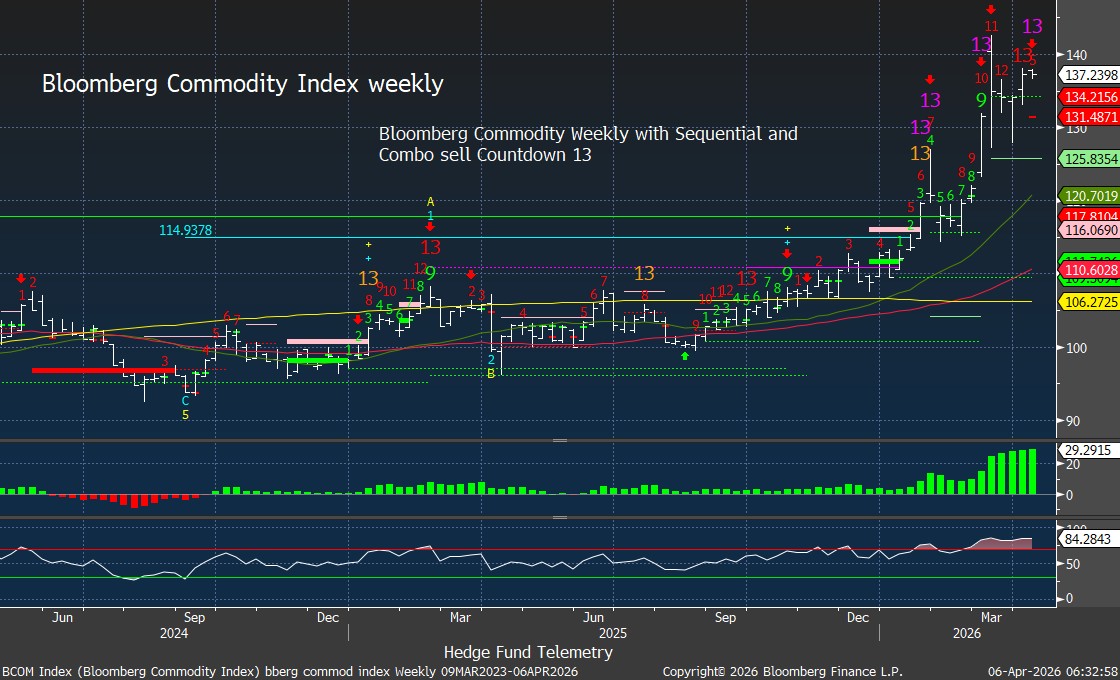
- BCOM Bloomberg Commodity Index:
- Multiple exhaustion signals are developing on daily and weekly time frames.
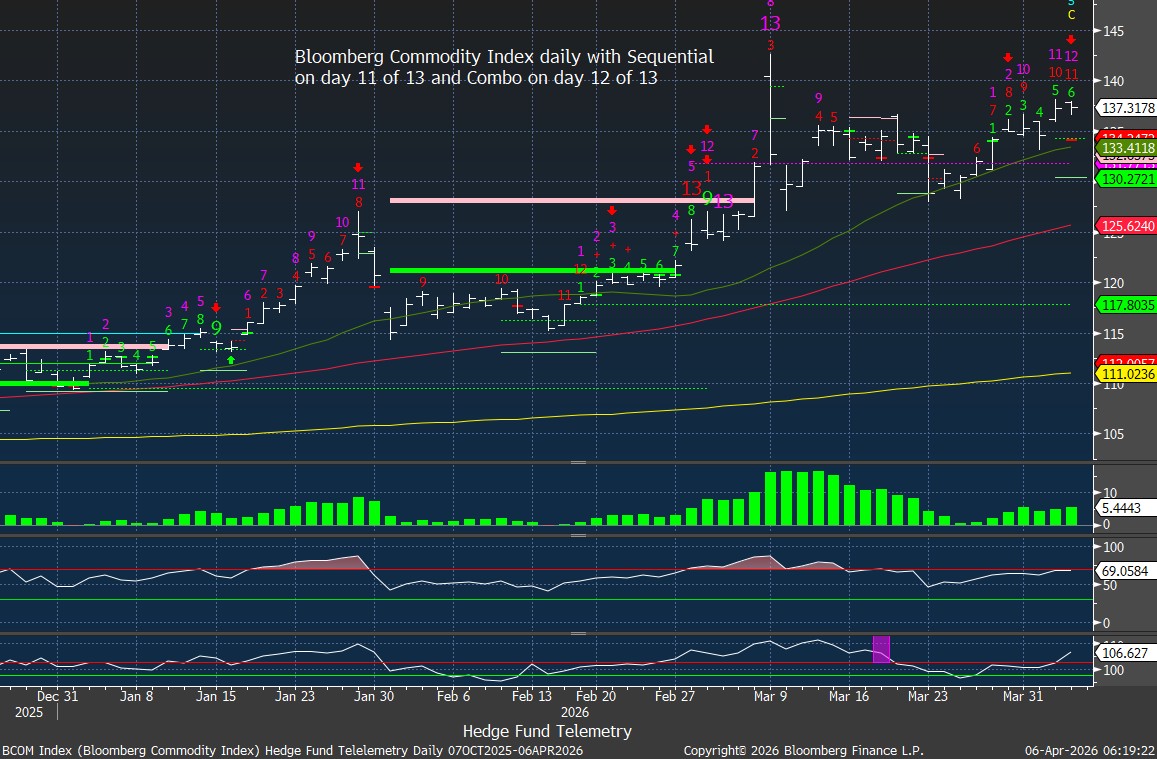
BCOM weekly with Sequential and Combo sell Countdown 13s, overbought RSI
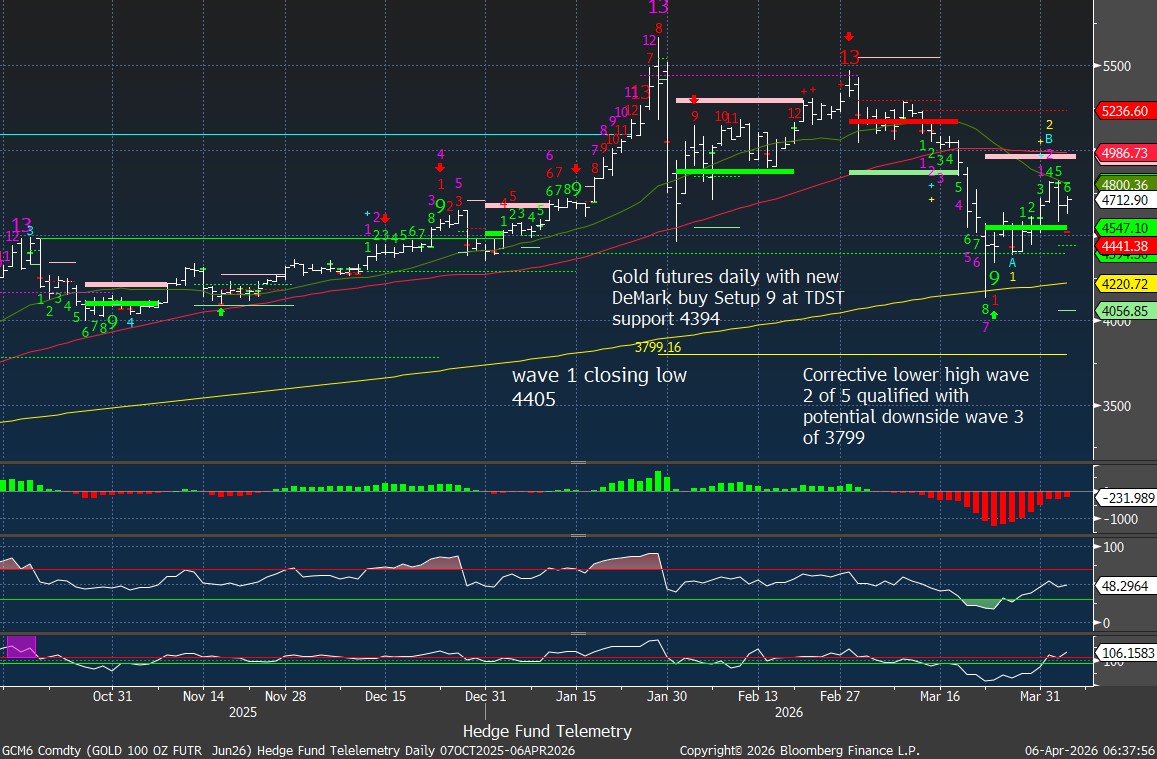
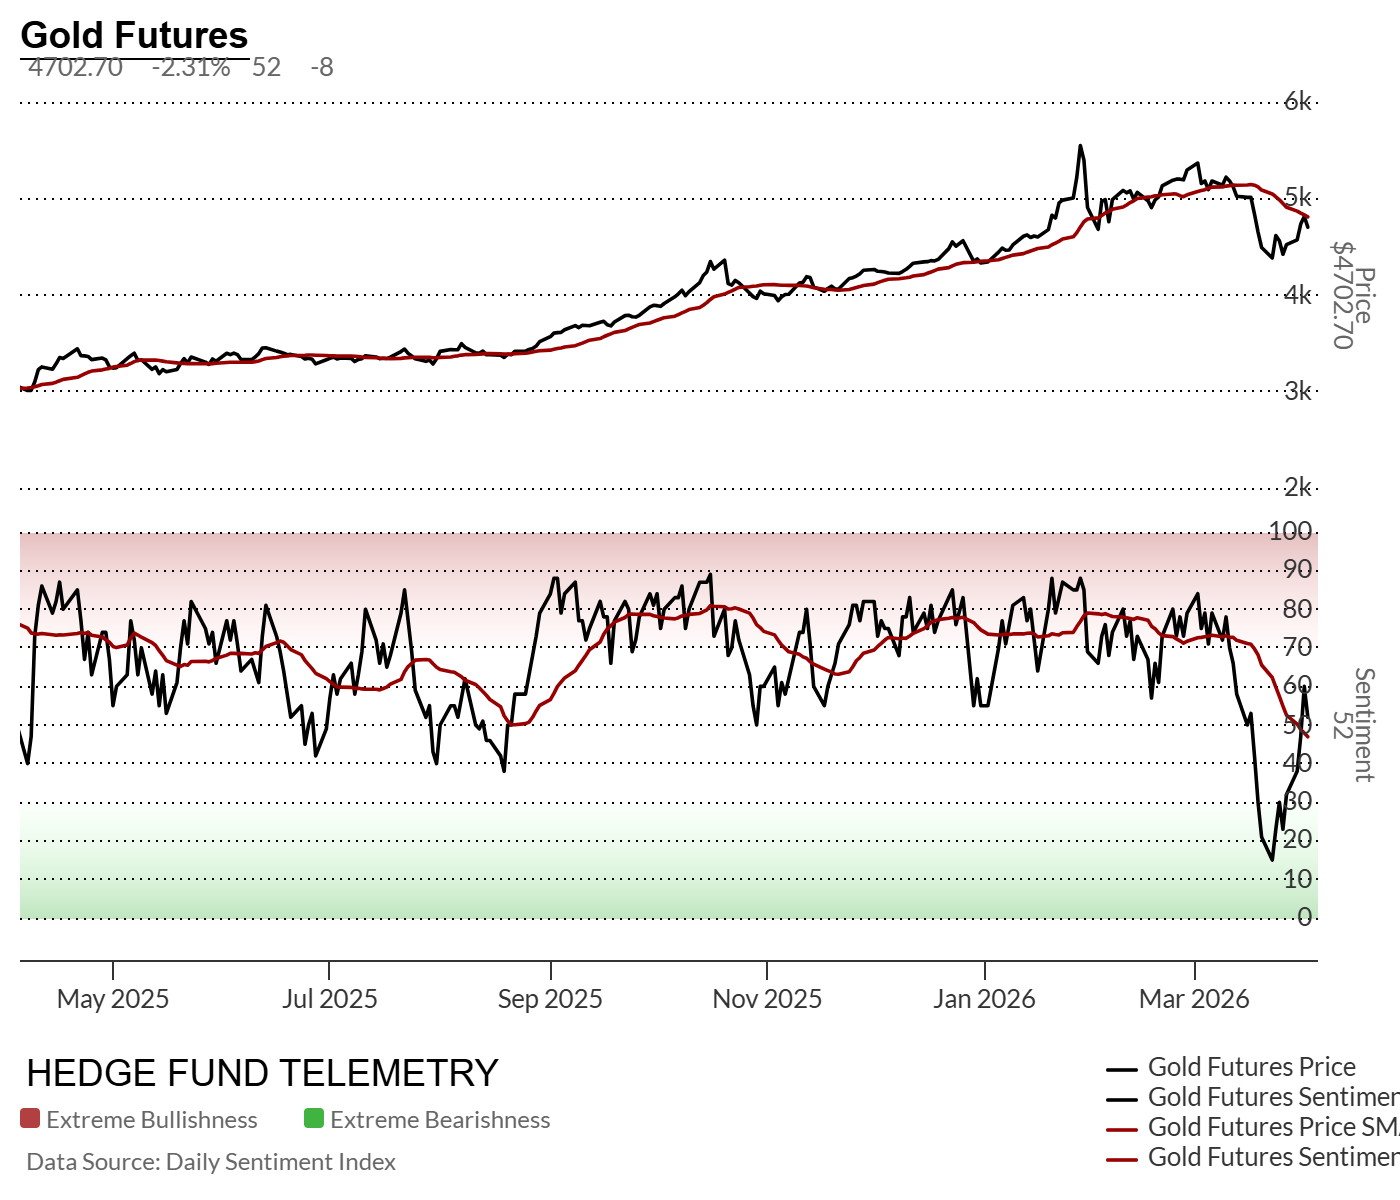
- Gold:
- Holding, not confirming breakout with lower highs. Corrective lower high wave 2 risk. If looking to buy 200 day might be where to start with risk of downside Sequential Countdown. Buy max size with DeMark 13 or at downside wave 3 price objective.
- Sentiment broke elevated pattern with mean reversion bounce.
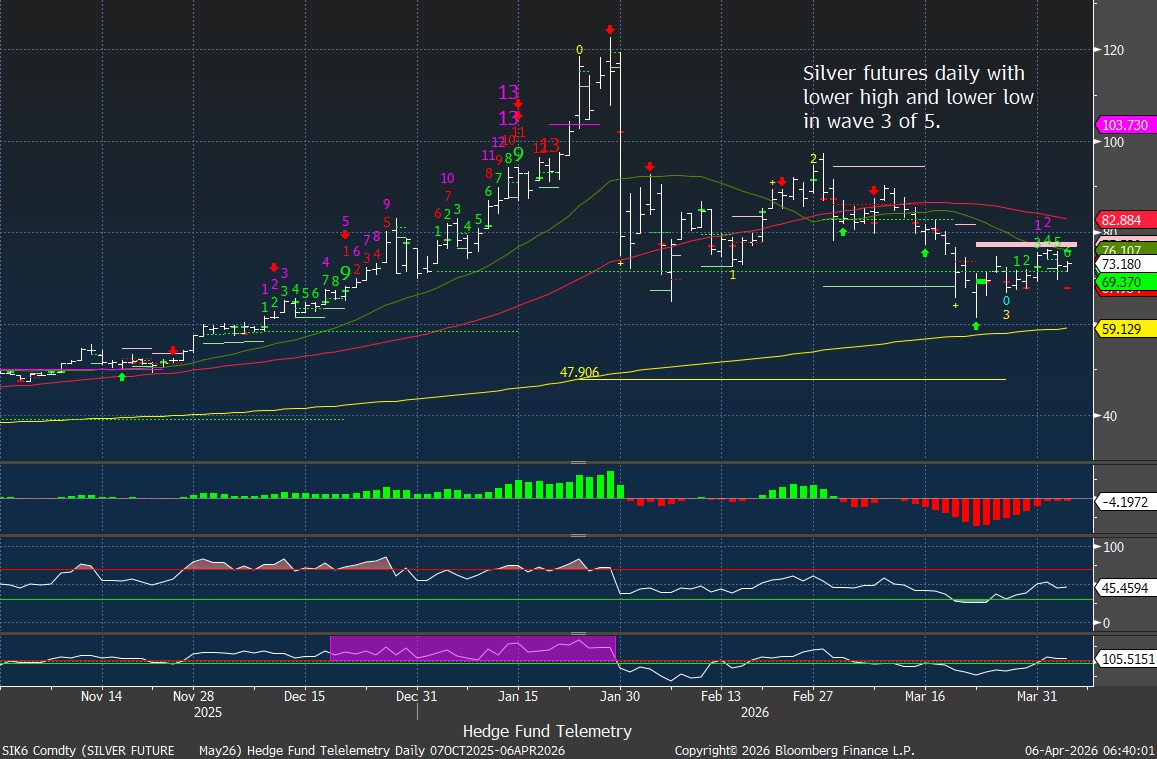
- Silver:
- Weak → no broad demand confirmation
Cross-Asset Message
- If Rates ↑ + Dollar ↑ + Commodities ↑
- Equities = unstable
Conclusion:
This is a non-coherent macro regime → volatility regime.
Equity Index Probability Framework
| Scenario | Probability | Description |
|---|---|---|
| Range-Bound / Volatile | 45% | Choppy, macro-driven swings dominate |
| Major Correction / Bear Phase | 35% | Liquidity + rates force valuation reset |
| Continued Bull Trend | 20% | Requires inflation + rates to fall |
US Sector ETF Weekly DeMark / Trend Snapshot
| Sector | DeMark Signal | 50-Week Status | Key Support Levels | HFT Risk Take |
|---|---|---|---|---|
| XLK – Technology | Sequential Sell Countdown 13 (upside exhaustion) | Above (trend intact) | TDST 131.42 / 50W 134.07 | Trend still intact, but upside is mature. Must hold 50W to avoid trend deterioration. |
| XLC – Communications | Sequential Sell Countdown 13 | Just Above (at risk) | 50W 111.25 / TDST 106.12 | Near-term decision point. Lose 50W → trend break risk increases quickly. |
| XLE – Energy | Combo Sell Countdown 13’s (within uptrend) + RSI overbought | Above (strong trend) | 50W 46.47 / TDST 45.08 | Strongest trend but most extended. High probability of pause/mean reversion. |
| XLF – Financials | Combo Sell Countdown 13 (confirmed by rollover) | Below (trend broken) | TDST 44.66 / Resistance 52.27 (50W) | Leadership lost. Below 50W = broken trend until reclaimed. |
| XLI – Industrials | Sell Setup 9 (wave 5 exhaustion), RSI reset | Above (trend intact) | 50W 154.21 / TDST 151.38 | Pullback within trend—for now. 50W is the line in the sand. |
| XLY – Discretionary | Buy Setup 9 (tactical exhaustion of downside) | Below (trend broken) | TDST 108.07 / 50W 114.00 | Early stabilization attempt, but still structurally broken. Needs 50W reclaim. |
XLK – Technology
Technology remains one of the cleaner relative uptrends, but it is no longer early. The key point is the weekly DeMark Sequential sell Countdown 13, which says upside exhaustion risk is already on the table. Price is still above the 50-week moving average, so the primary trend is intact, but this is no longer a chase setup. After a completed buy Setup 9, if there is a continuation, a new downside Sequential can begin.
Key levels
- TDST support: 131.42
- 50-week moving average: 134.07
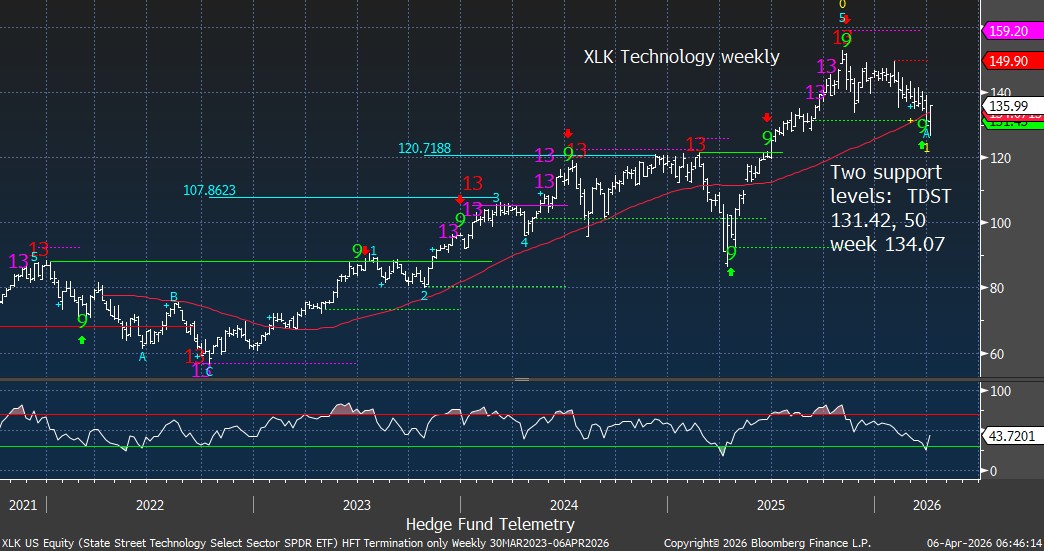
As long as XLK is above the 50-week, the intermediate uptrend still holds and pullbacks can be framed as corrective rather than structural. A break below the 50-week would be the first sign the trend is starting to fracture. Lose TDST 131.42 and that would argue the post-2023 leadership trend is becoming more vulnerable.
Bottom line: still a leader, but the sell 13 says upside is more mature and risk/reward is less forgiving.
XLC – Communications
Communications also looks tired. The important signal here is the recent weekly DeMark Sequential sell Countdown 13, which often marks upside exhaustion after an extended run. Price is sitting just above the 50-week moving average, so this is a much more important test than it may look on the surface.
Key levels
- 50-week moving average: 111.25
- TDST support: 106.12
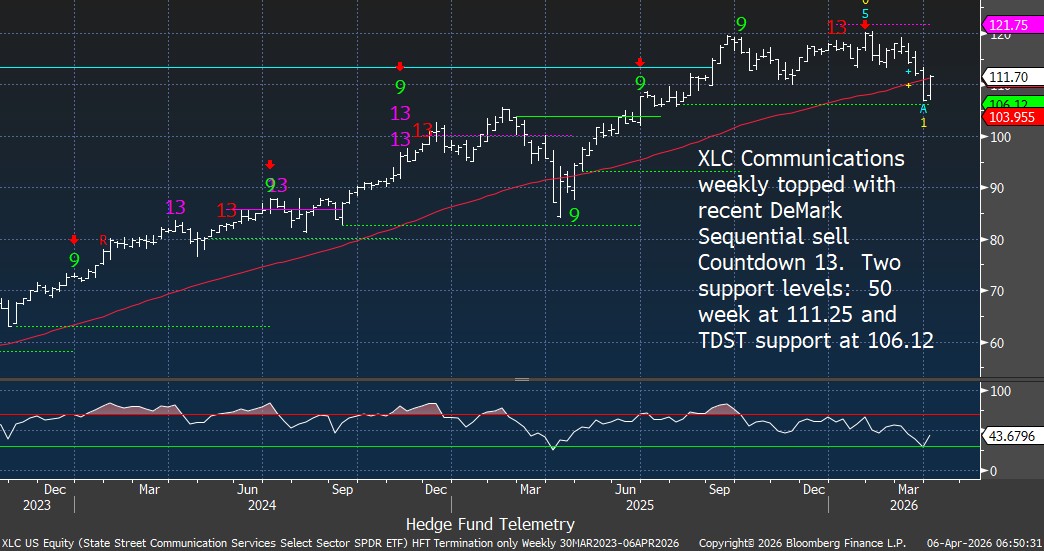
If XLC can hold above the 50-week, the bigger uptrend remains technically alive and this can still be treated as digestion after a mature advance. But if it slips below 111.25, that starts to look less like consolidation and more like a trend break. A move down through 106.12 TDST would confirm materially weaker tape.
Bottom line: the sell 13 matters here because price is no longer extended far above trend support. This one is closer to a decision point.
XLE – Energy
Energy is the standout upside extension. The chart shows weekly Combo sell Countdown 13s and, more importantly, those 13s developed within the current uptrend, which makes them more relevant from an exhaustion standpoint. RSI is also explicitly flagged as very overbought.
Key levels
- 50-week moving average: 46.47
- TDST / key support zone: 45.08
- Prior breakout area: 51.13
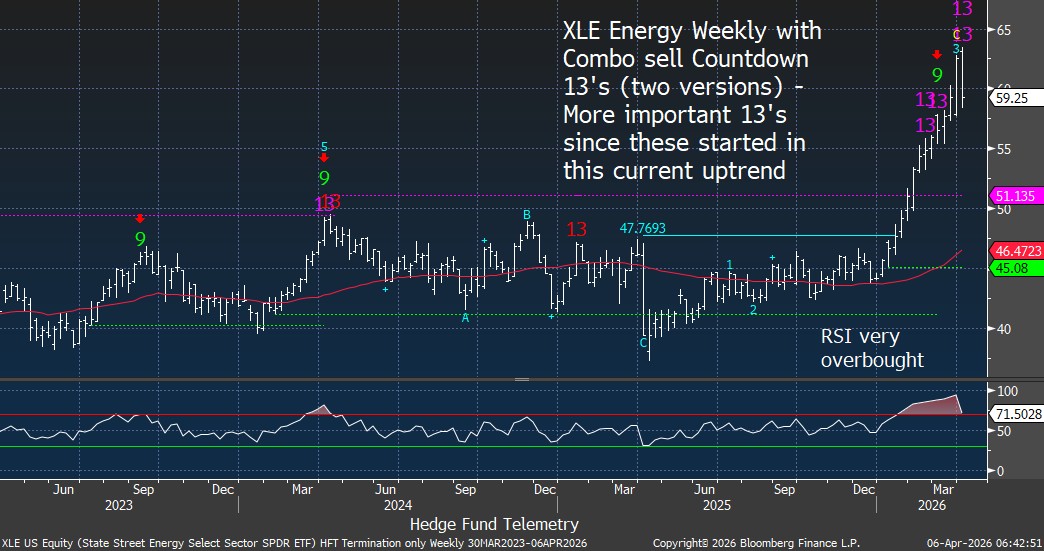
XLE is still clearly above the 50-week, so trend is intact and energy remains one of the strongest sector tapes. But this is a classic case where strong trend and poor entry can coexist. The DeMark 13s plus overbought RSI argue for a pause, shakeout, or at minimum reduced upside asymmetry near-term.
As long as XLE stays above the 50-week, the uptrend must be respected. A break below the 50-week would be the first real trend damage. Lose 45.08 TDST and the breakout regime starts to look suspect.
Bottom line: strongest tape, but also one of the more extended and vulnerable to mean reversion.
XLF – Financials
Financials have already rolled over more than the other cyclical leaders. The chart highlights a weekly DeMark Combo 13, and unlike Energy, this one has been followed by visible price deterioration. Most important, XLF is now below the 50-week moving average.
Key levels
- 50-week moving average: 52.27
- TDST support: 44.66
- Overhead resistance zone: 54.60–55.73
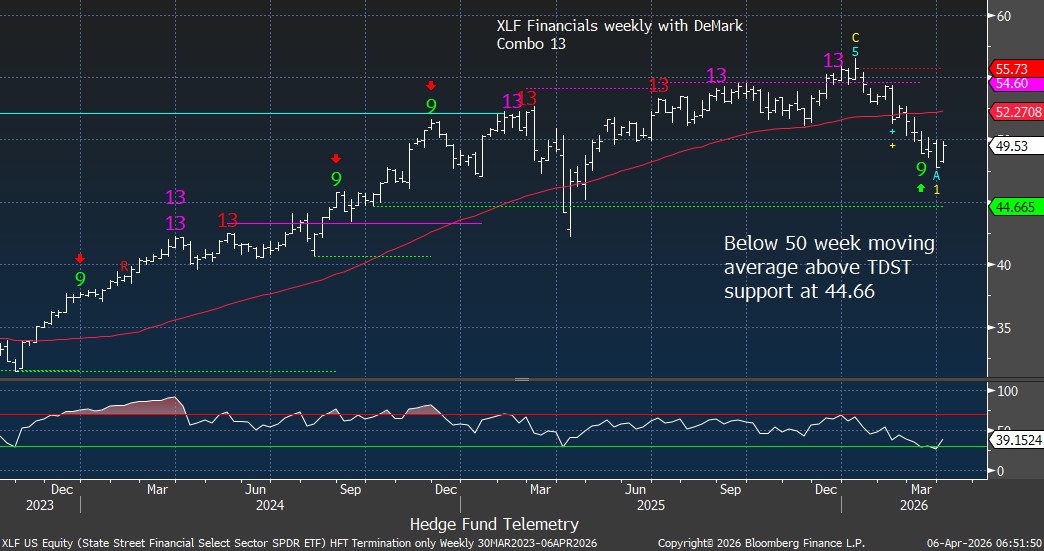
This is the cleanest example in your group of below the 50-week = trend break. Until XLF can reclaim that moving average, rallies should be viewed more skeptically as countertrend rather than resumed leadership. The good news is that price remains above TDST support at 44.66, so the sector is weakened, but not fully broken down.
Bottom line: trend leadership has already been lost. Reclaiming the 50-week is the repair threshold; losing 44.66 would open the door to deeper technical damage.
XLI – Industrials
Industrials have corrected from a strong trend but have not fully broken. The key DeMark point is the recent weekly sell Setup 9 at an upside wave 5 objective, which is classic language for a maturing advance. The chart also notes RSI has worked off overbought levels, which is constructive. Price remains above the 50-week moving average.
Key levels
- 50-week moving average: 154.21
- TDST support: 151.38
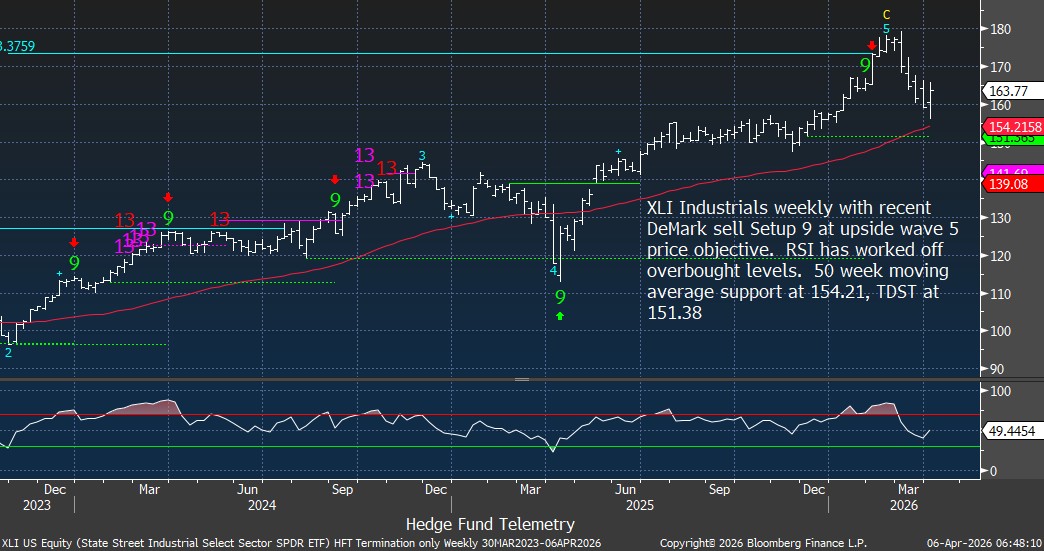
This is a pullback within trend until proven otherwise. Because XLI is still above the 50-week, the burden of proof is still on the bears. That said, this is not a sector that can afford much more technical slippage. A break below the 50-week would shift the narrative from orderly pullback to trend break. Lose 151.38 TDST and the correction likely deepens.
Bottom line: structurally better than Financials, weaker than Technology, and now at a key trend support test after a mature upside run.
XLY – Consumer Discretionary
This is one of the more interesting charts because the DeMark signal has turned constructive, but the trend has not yet repaired. XLY shows a new weekly buy Setup 9, which argues downside selling pressure may be getting exhausted. However, the price is still below the 50-week moving average, indicating that the larger trend has already broken. Continuation lower will negate buy Setup 9 with new Sequential Countdown starting.
Key levels
- TDST support: 108.07
- 50-week moving average: 114.00
- Lower support reference: 93.16
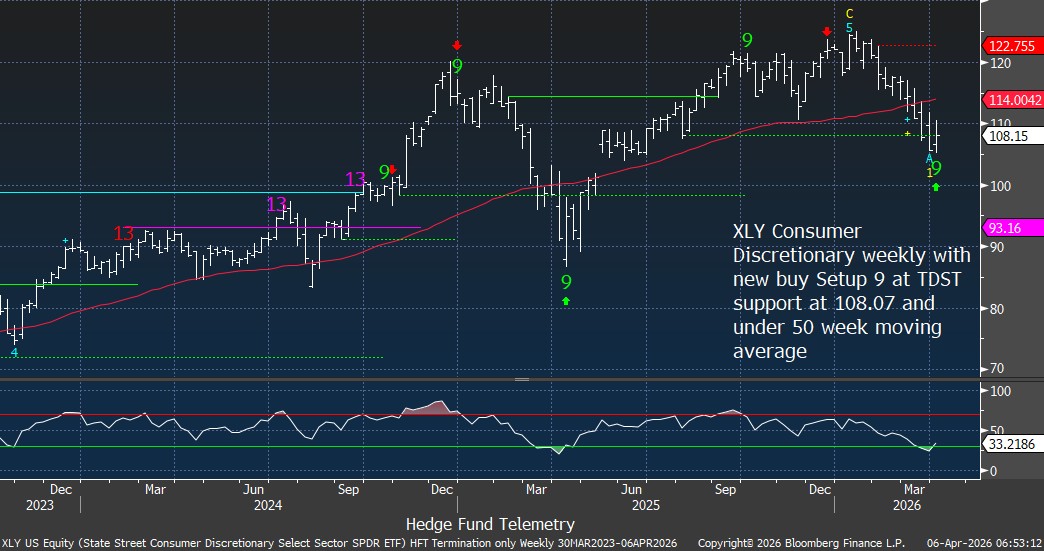
The buy Setup 9 says a tactical low may be forming, but from the framework, this is still a countertrend recovery attempt until XLY can get back above the 50-week. That moving average is the line that needs to be reclaimed to argue the sector is repairing. If XLY fails and loses 108.07 TDST, the buy signal likely fails and downside risk re-expands.
Bottom line: improving tactically, but still damaged structurally until the 50-week is retaken.
The sector message is fairly clean:
The most important intermediate-term DeMark signals here are the weekly sell Countdown 13s / Combo 13s in XLK, XLC, XLE, and XLF. That tells you a lot of the prior leadership has already entered an exhaustion phase, even if some of those sectors are still technically above their longer-term trend lines. Meanwhile, XLY’s buy Setup 9 is the only real tactical countertrend stabilization signal in the group. Risk of continuation lower with XLY negates buy Setup 9 with new Sequential Countdown starting.
possible 12-month roadmap
0–3 Months: Reflex Bounce / Stabilization
Oversold sentiment + DeMark buy setups drive tactical rallies, but breadth is weak and rates cap upside.
→ Trade it tactically: fade strength, not weakness.
3–6 Months: Reality Check
Inflation vs. growth tension builds, credit stress surfaces, and AI shifts from capex narrative → ROI scrutiny.
→ Dispersion rises, rotation accelerates, leadership narrows.
6–12 Months: Resolution
Bull case: disinflation + stable rates + resilient earnings → grind higher, selective leadership
Base case tilt: sticky inflation + higher rates + tightening liquidity → valuation compression, broader downside
Near-term rallies are tactical, not structural.
The bigger risk is still ahead, not behind.
Current Bias and what matters now
- Tactical > directional
- Asymmetric setups only
- Maintain liquidity optionality
- Fade:
- Commodity and positioning extremes
- Equity squeezes
- Lean into:
- Relative value (oversold high-quality tech vs financials – especially with private credit exposure)
- Oversold internals, DeMark buy Countdowns, oversold depressed sentiment
What Must Hold
- S&P 6200–6300 support zone
- Tech leadership stability
- Private credit holding together
- Sentiment not re-crowding too quickly
What Breaks the Market
- 2Y > 4.25%, 10Y > ~4.6%, 30Y > 5%
- S&P < 6000
- Credit spreads widen materially
- Energy shock, war escalation, inflation increases, and remains elevated
- Policy / geopolitical error
Bottom Line
This is not a reset low — it’s a transition phase.
Markets are shifting from liquidity-driven → constraint-driven.
Positioning supports bounces, not durability.
The View:
Late-cycle. Fragile. Two-way.
→ Trade the range. Respect the downside. Stay opportunistic.