
Markets had been lifting in the last several years on falling gasoline prices and softer headline CPI as evidence that inflation was moving sustainably lower from the highs seen in 2022. The larger risk today is that inflation is beginning to broaden again beneath the surface, and not long ago the markets had aggressively priced Fed easing and lower long-term yields especially with a White House friendly new Fed Chairman who in the past argued for tighter policy, smaller Fed balance sheet but getting the job a requirement Trump expects (and demands) is for the Fed to aggressively lower rates which might become a problem for Kevin Warsh as he starts his term as new Fed Chairman. The US-Iran war has caused supply chain disruptions and a sharp spike in energy and other commodity prices. Is this transitory, or will higher percentage price moves remain elevated, as most prices did after the last bout of inflation? And it’s coming at a time when consumer confidence data has been weakening?
The upcoming CPI and PPI reports may be less about energy (even though it will be a main focus of just about every market pundit) and more about whether sticky inflation components begin to reaccelerate. Insurance, utilities, healthcare, shelter, food-related categories, and labor-intensive services remain elevated, while industrial commodities, including copper, steel inputs, freight, and select agricultural markets, have quietly moved higher in recent months. PPI is particularly important because rising producer input costs have historically been transmitted to CPI with a lag.
The risk for markets is that inflation accelerates and remains elevated at a level structurally higher than the current consensus expects. Even modestly firmer CPI and PPI prints over several months could materially alter Fed expectations far into 2027. Ahead of the US-Iran war and the closure of the Strait of Hormuz, the market had priced in a disinflationary backdrop, allowing the Fed flexibility to ease policy amid slowing growth. Stronger inflation data would challenge that narrative and potentially force the Fed into a more restrictive posture for longer. That is, if the current policy is actually restrictive. Fed Fund Futures call for the next Fed move have now skewed ever so slightly toward a hiking stance.
That matters most for the US Treasury market. Long-duration bonds remain highly sensitive to inflation persistence and Fed credibility. If CPI and PPI remain sticky, Treasury yields — particularly the 10-year and 30-year — could move materially higher as investors demand greater compensation for inflation risk and rising fiscal concerns. The combination of large Treasury issuance, elevated deficits, and sticky inflation creates a difficult backdrop for duration. Late this summer, ahead of the midterm elections, US debt will cross $40 trillion, with $1 trillion in annual interest expense. Treasury Secretary Bessent has continued the trend set by his predecessor, Janet Yellen, by issuing a majority of short-term bonds, which can work in a way like QE with liquidity injections – helping equity markets.
The biggest risk is that the bond market begins to tighten for the Fed. Higher long-end yields would tighten financial conditions, pressure equity valuations, weaken housing activity, and increase refinancing stress across leveraged parts of the economy. Equity markets — especially long-duration growth, AI infrastructure, and speculative momentum leadership — remain heavily dependent on stable or falling yields.
My estimate for the three risk zones for the 10 and 30 year rates, where it would affect the economy, equity, and other markets:
US 10-year yield: Below ~4.0%
- Generally manageable for equities and the economy if growth remains stable.
- Equity multiples can still remain elevated
- Housing slows but does not freeze
- Credit spreads usually stay contained
- AI/capex/growth narratives can overpower rates pressure
US 10-year yield: 4.25%-4.50% – Rates are in this range now
- This is where markets begin to tighten materially.
- Historically, this range:
- Pressures high-duration growth stocks
- Starts hurting housing affordability
- Raises corporate refinancing costs noticeably
- Strengthens the US Dollar
- Tightens financial conditions enough to slow economic momentum
- For the S&P 500, this is usually where:
- Multiple expansion stops,
- Leadership narrows further
- Breadth deteriorates
- Small caps and cyclicals begin underperforming
US 10-year yield: 4.75%-5%. This becomes a larger systemic issue.
- Mortgage rates likely remain near or above 7.5–8%
- Commercial real estate stress accelerates
- Private equity/private credit refinancing becomes difficult
- Government interest expense surges
- Equity risk premium becomes unattractive versus bonds
- The market starts asking:
- “Why own equities at 22–25x earnings when risk-free yields are 5%?”
- This is historically where:
- Valuation compression accelerates
- Volatility spikes and Credit spreads widen
- Liquidity becomes more important than growth narratives
- A disorderly move above 5% on the 10-year would likely pressure:
- Mega-cap tech
- Unprofitable AI beneficiaries
- Private credit
- Regional banks
- Leveraged companies
- That would likely resemble:
- 2022 tightening stress
- 1994 bond shock dynamics
- Portions of the 2000 valuation compression of the tech bubble
US 30-year yield: The 30-year yield near 5% is already psychologically important.
- It signals the bond market demanding higher compensation for long-term inflation/fiscal risk
- It pressures government financing assumptions
- It raises long-term discount rates across all assets
- Historically, equities have tolerated this briefly but not comfortably.
US 30-year yield: 5.25%-5.5% Serious concern
- Inflation expectations are becoming unanchored
- Fiscal deficit concerns are growing
- Foreign demand for Treasuries is weakening
- Treasury supply overwhelming demand
- Pension funds rebalance toward bonds
- Equity multiples compress materially
- Housing affordability deteriorates further
- Consumer confidence weakens
US 30-year yield: Above 6%. Potential financial accident risk
- The US government’s interest burden explodes higher
- Long-duration assets reprice aggressively
- Real estate valuations likely reset lower
- Leveraged financial structures become vulnerable
- Persistent inflation
- Fiscal credibility concerns and leadership failure
The market can and has withstood high yields if:
- Earnings growth accelerates – this is currently happening with AI capex buildout
- Productivity improves – this is currently happening with AI advances
- Inflation falls – this is not happening, and the opposite is the risk in the coming months/quarters
- Credit markets remain orderly – this is currently happening
The setup resembles a market that may be underpricing inflation persistence and overpricing Fed flexibility. If inflation data starts and continues to surprise to the upside again, the narrative could quickly shift from “Fed cuts and soft landing” back toward “higher rates for longer,” with the Treasury market becoming the primary transmission mechanism for volatility across all asset classes. One of the problems facing consumers is the persistence of the higher prices from the last bout of inflation after Covid and the supply chain disruptions. When a politician says inflation is under control at 3% (both sides have said this), prices are not coming down materially, and on average, prices are still going up for goods and services. During that period, wages were rising somewhat in line with inflation, and wages are back on a downward trajectory. Unemployment has remained steady at around 4.3%, which is positive, but AI disruption could lead to significant layoffs in higher-paying job demographics.
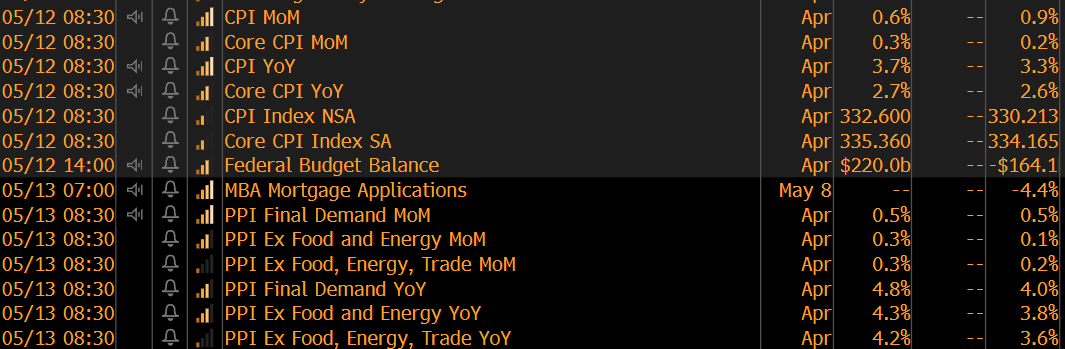
Below are many charts and views from the March CPI Consumer Price Index inflation report, and expectations are for the April CPI report to show CPI MoM rising 0.6% vs March’s 0.9% and CPI YoY rising to 3.7% vs March’s 3.3%. Core CPI is expected to rise MoM and YoY moderately, 1 tick to 0.3% and 2.7% – core strips out food and energy – two things that really matter to most consumers but matter more to economists, politicians, and those hoping for inflation to remain low. The PPI Producer Price Index data hits on Wednesday.
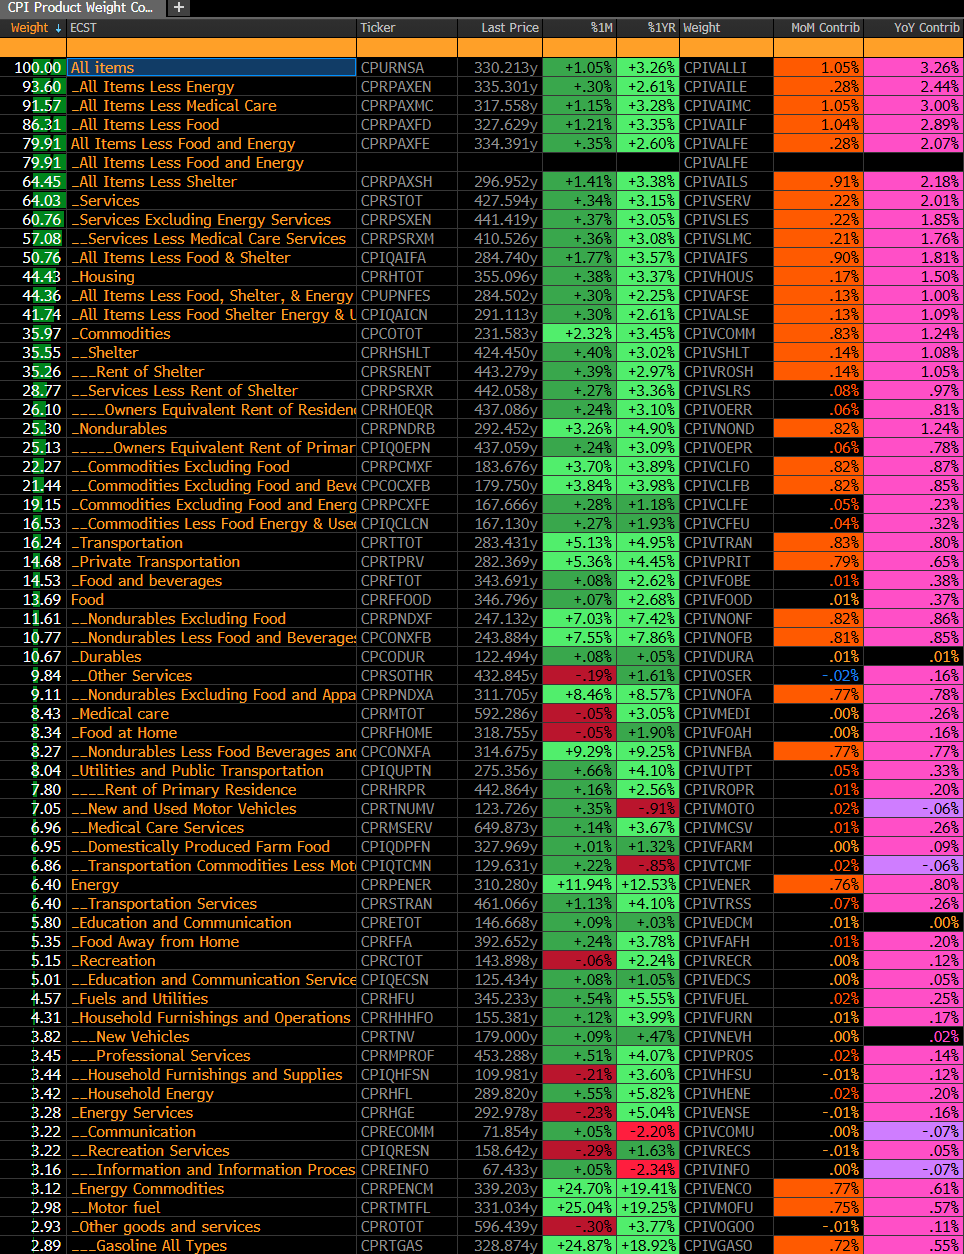
This is the top half of the entire components and weighted percentages from the March CPI report. As you see, most of the components were higher than in February and from a year ago. There are a lot of “fewer items” in here; however, there are also many sharp rises due to the US-Iran war and supply chain disruptions. Some energy components, like gasoline, had already begun to rise in February from January lows ahead of the Middle East “excursion”.
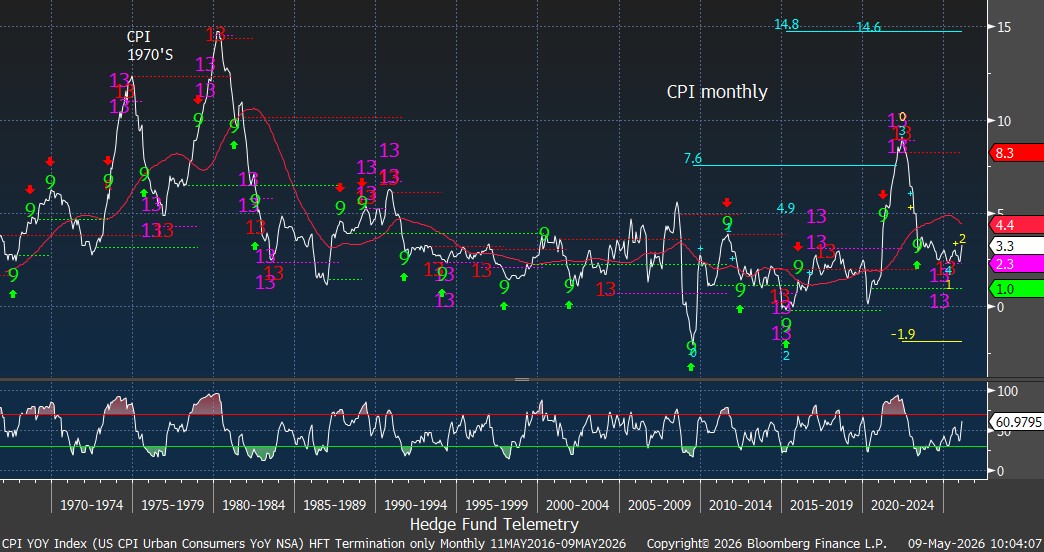
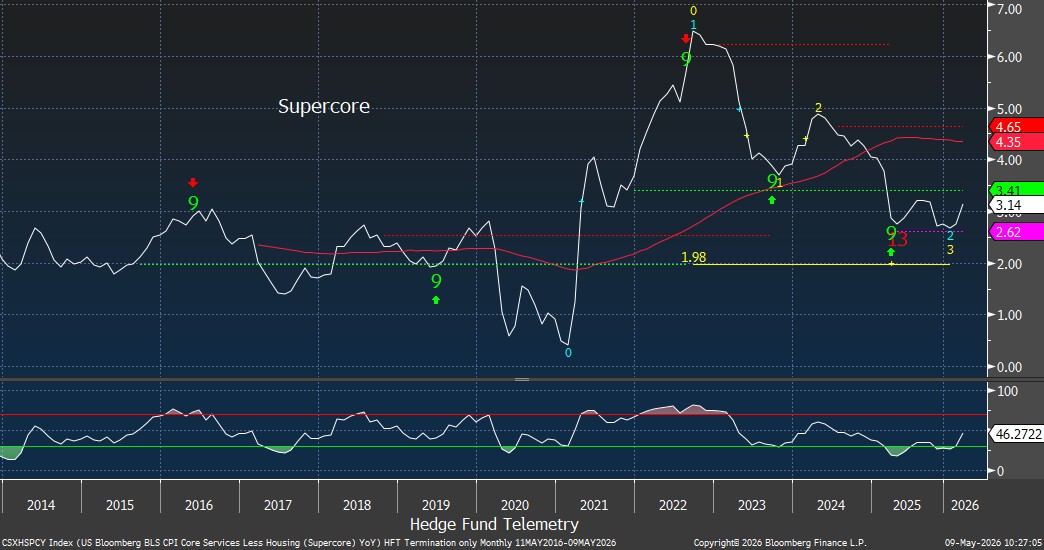
I’ve run the CPI YoY monthly data going back 100 years with DeMark indicators, and, remarkably, the Setup 9s and Sequential and Combo 13s have spotted tops and bottoms fairly accurately over that period. The 5% level would be a breaking point.
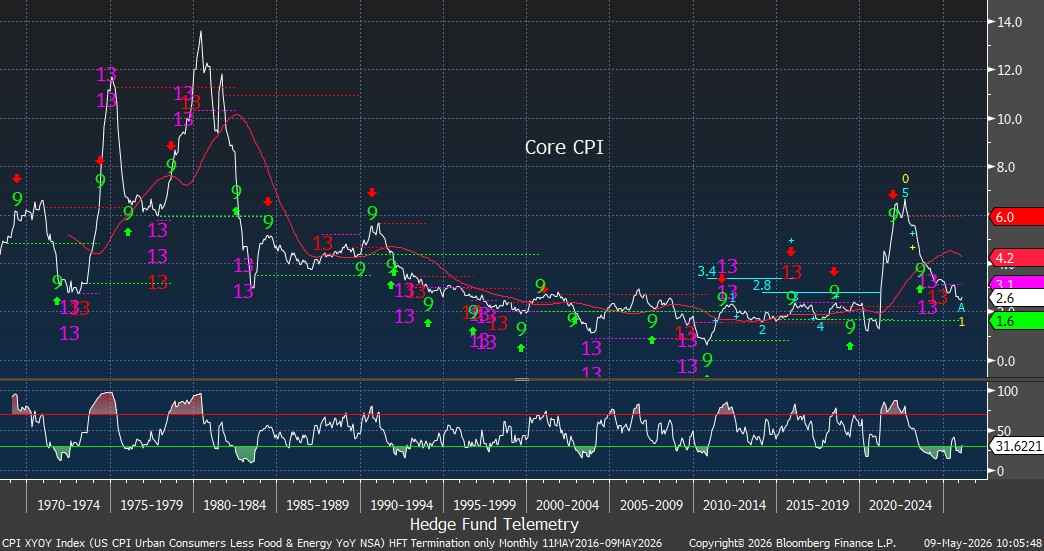
Core CPI, excluding food and energy, has remained the go-to metric for economists and politicians, as everything looks good.
“Supercore” inflation is a narrower measure of inflation that policymakers and economists use to track the most persistent, wage-sensitive component of inflation in the economy. It strips out food, energy, and shelter. It focuses on labor-driven sectors such as medical services, insurance, airfares, restaurants, hotels, and financial services. This came down from the peak in 2022 and this was a big talking point of inflation dropping. If this starts to lift again, inflation can become more embedded.
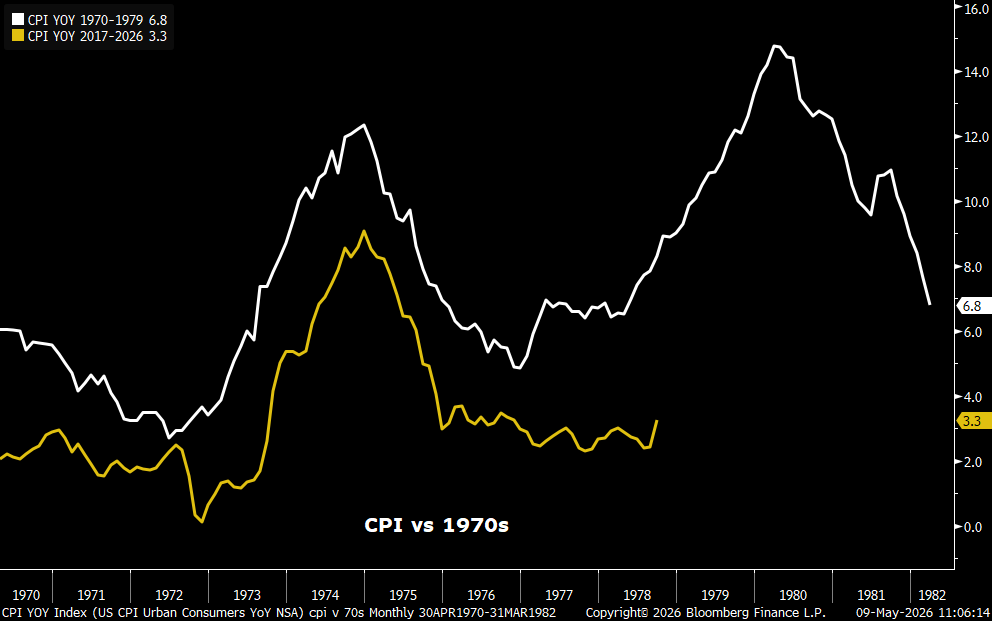
I know many macro investors who have predicted a double spike in inflation similar to the 1970s – this has not yet occurred, but it might reach higher levels, though I doubt levels comparable to the second spike in the 1970s. A 5-7% inflation rate would be felt and have broad implications.
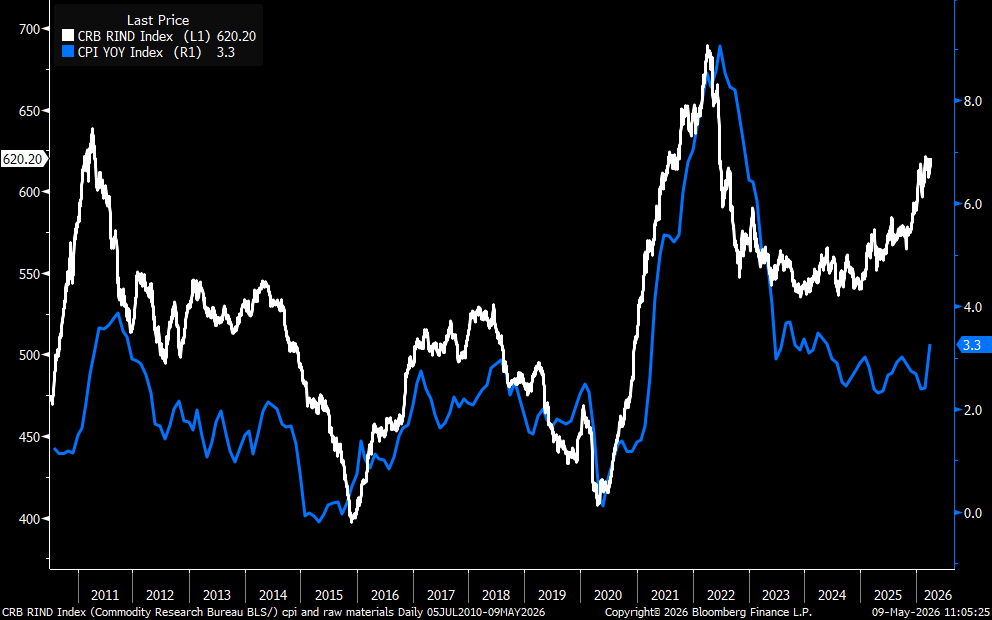
The analog of the CPI and the CRB Index (commodities) argues that a higher CPI in the coming months/quarters is possible.
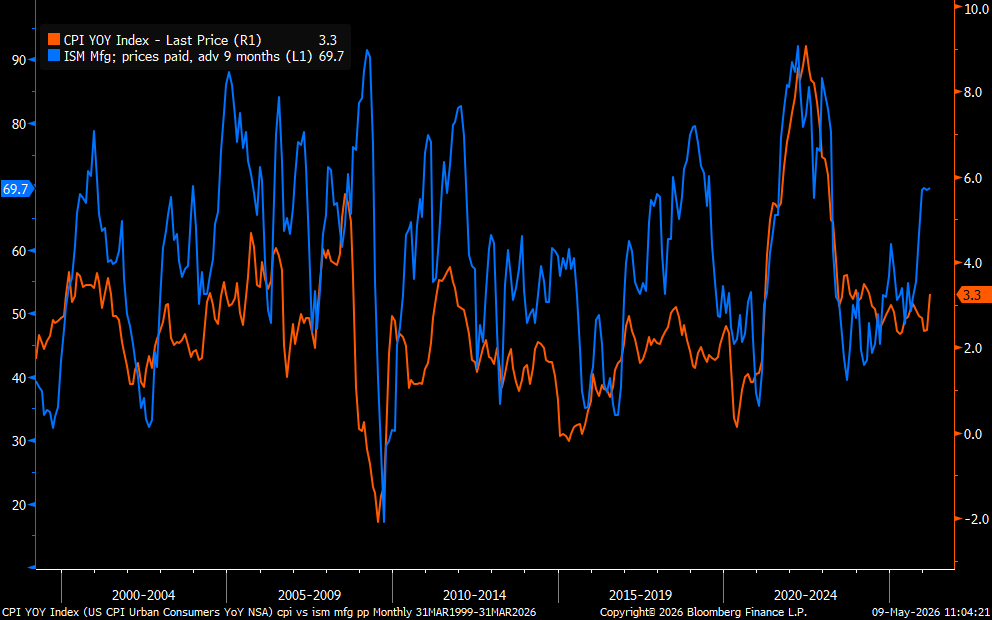
I grabbed this chart a few weeks ago that showed the ISM manufacturing prices paid spiking to 69.7 in March. The April data showed this spiking to 84.6%. This makes the case that a CPI over 4%, perhaps 5%, is highly probable.
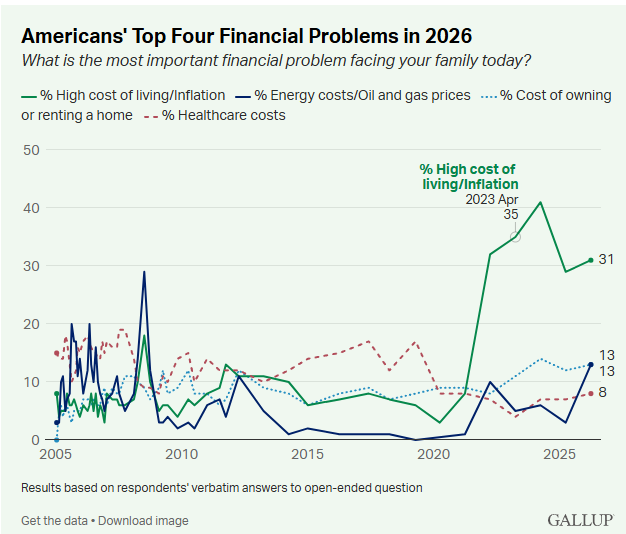
Before I highlight some of the charts of the components within the CPI data, I thought I would detour to mention that the consumer isn’t really in a great mood already due to persistently high prices.
A Gallup poll shows the top four financial problems facing families today. Since prices on many parts of the CPI have remained elevated from several years back when prices spiked, inflation remains the number one concern, with the cost of owning/renting a home increasing along with energy costs that have spiked higher.
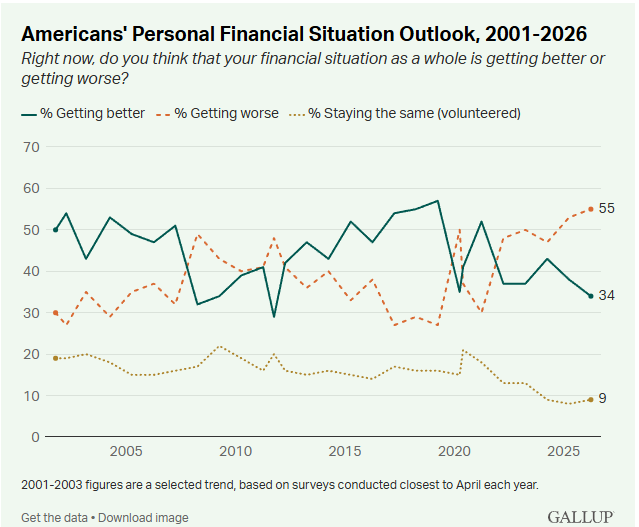
Many consumer confidence polls and data have shown that consumer confidence is already depressed. Rising inflation will only exacerbate the weakening confidence, with a likely pullback in spending in the coming months/quarters.
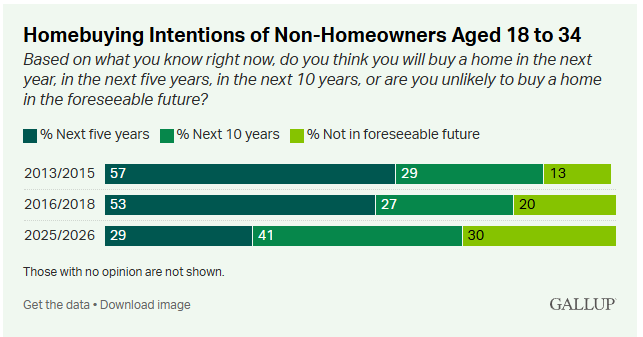
With inflation comes higher home prices, which are already elevated due to low supply after the last 15 years of ultra-low interest rates. Homeowners are (some happily) trapped in their homes amid lower mortgage interest rates, which have now frozen the housing market, with mortgage rates materially higher. It’s tragic that younger families and potential home buyers can’t afford to buy a house.
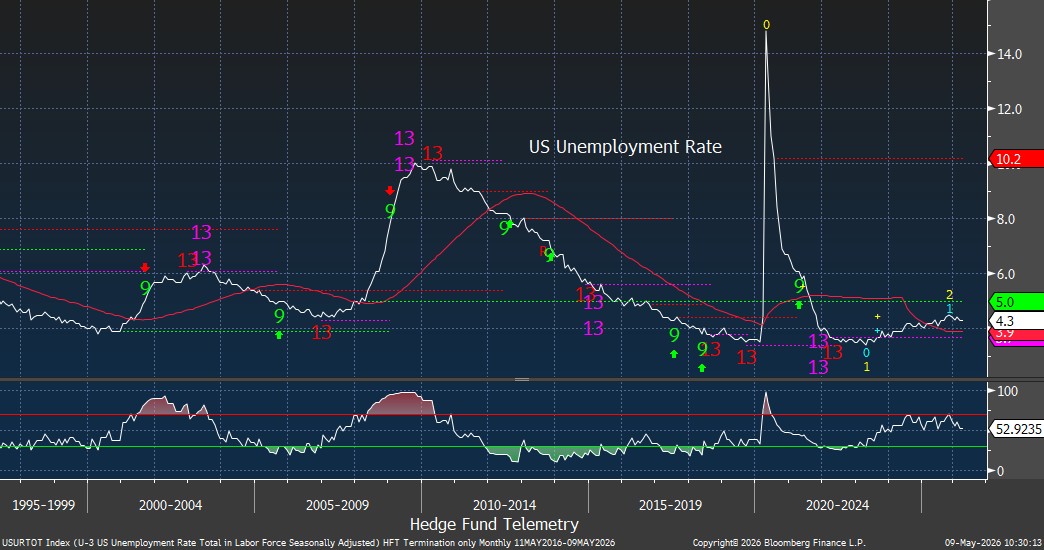
The good news for now is that the US unemployment rate remains historically low. Above 5% and a lot of alarm bells will ring.
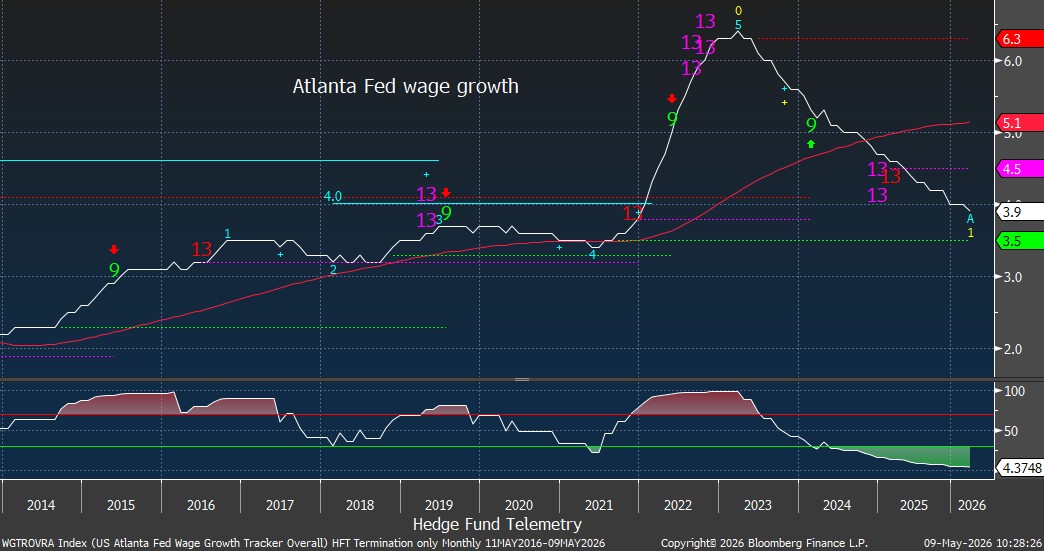
The Atlanta Fed wage growth showed mostly moderate gains from 2010 to 2021. In 2022, wages spiked and have been moving lower to more historical levels, while economists have said wage growth has remained above inflation – it’s not by much, and if inflation moves higher than wage growth, again, alarm bells.
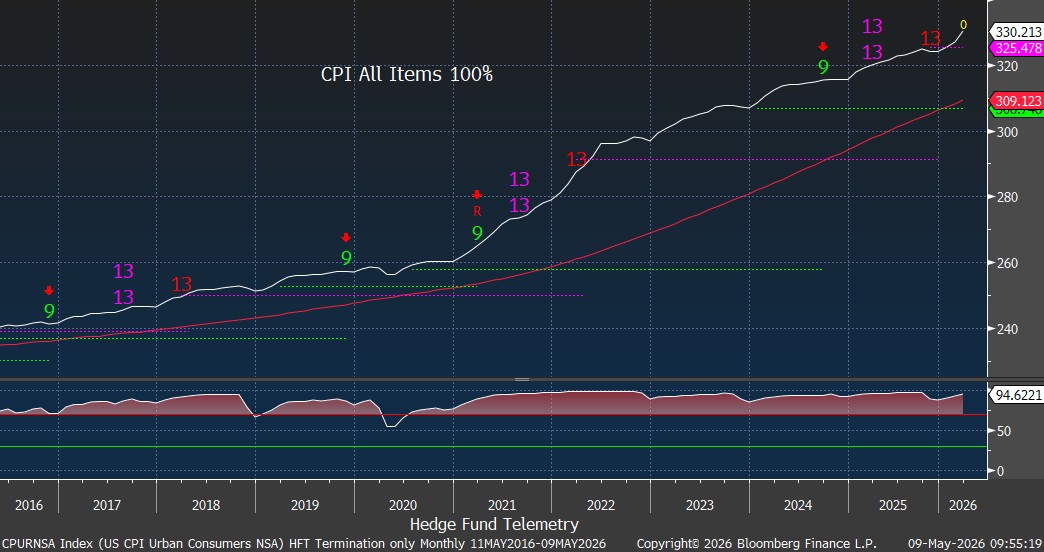
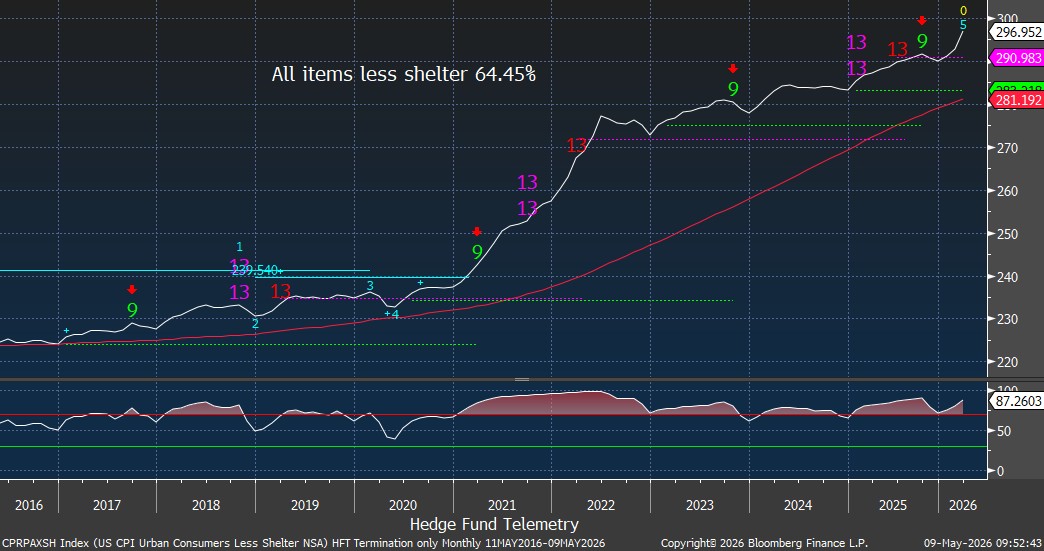
CPI all items shows the increase from 2021. Prices might have stopped going as fast as in 2021, but prices are still increasing. The percentages on the charts are the weighting within the CPI. I’d ignore the DeMark indicators on these charts.
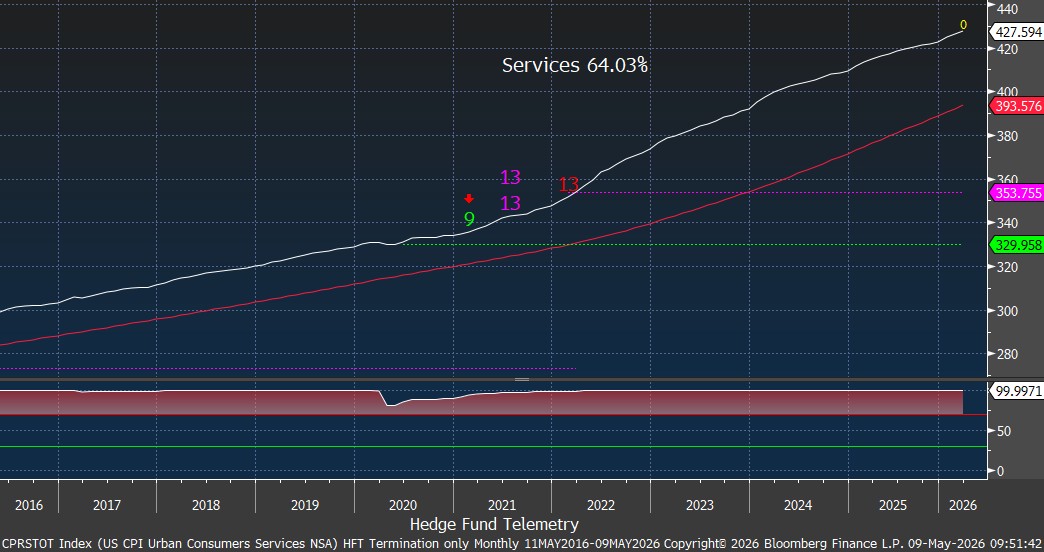
Services account for a large share and continue to rise. A meaningful rise from 2021 onward
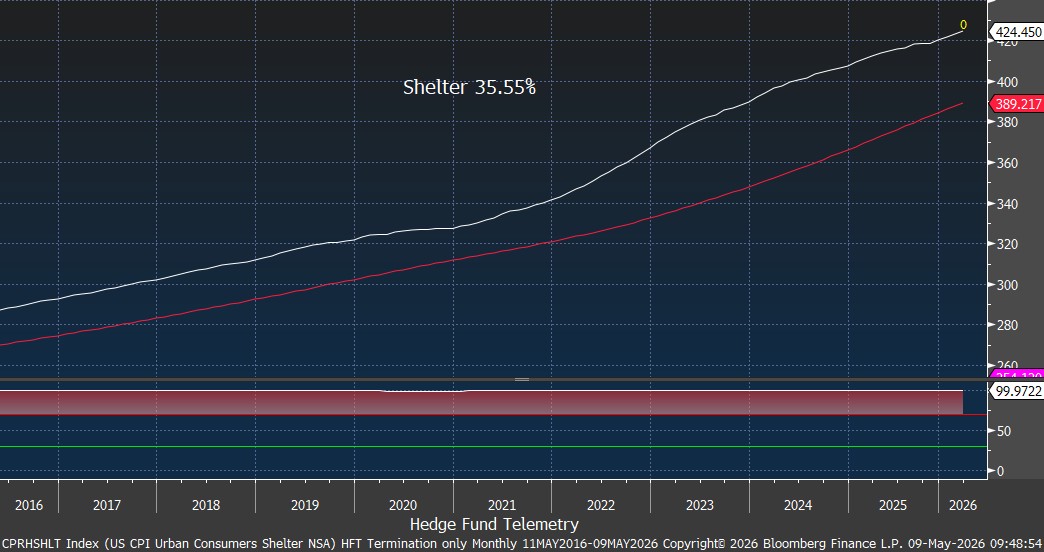
Shelter inflation began to level off in 2025, but could accelerate again. With the housing market frozen, as explained above, this seems likely to rise.
All items less shelter are taking another leg up.
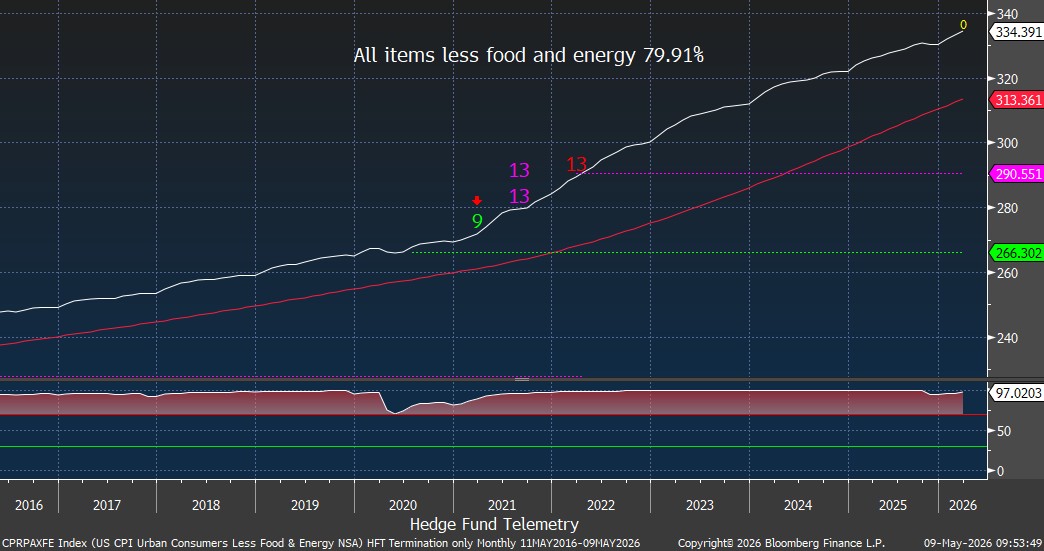
All items, less food and energy, are still going up. Whatever happened to the push for affordability from politicians?
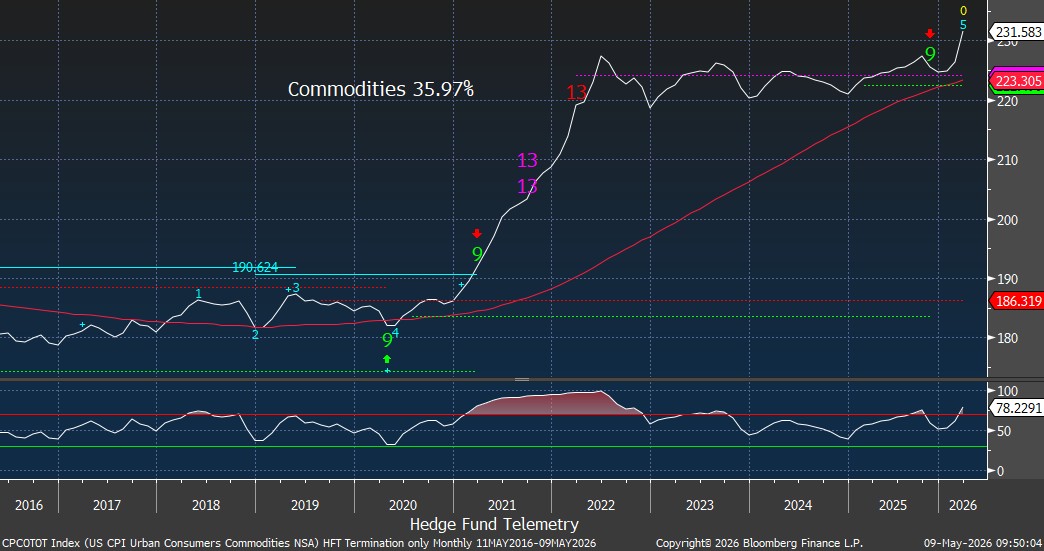
Commodities, which is 36% of the CPI index has seen inflation flat from 2022 yet still elevated with a new leg higher now
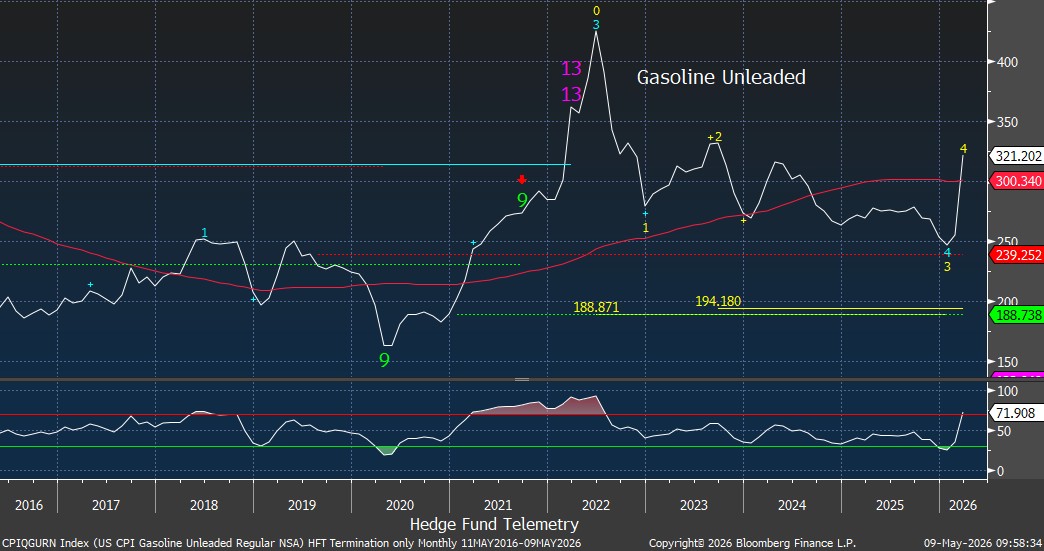
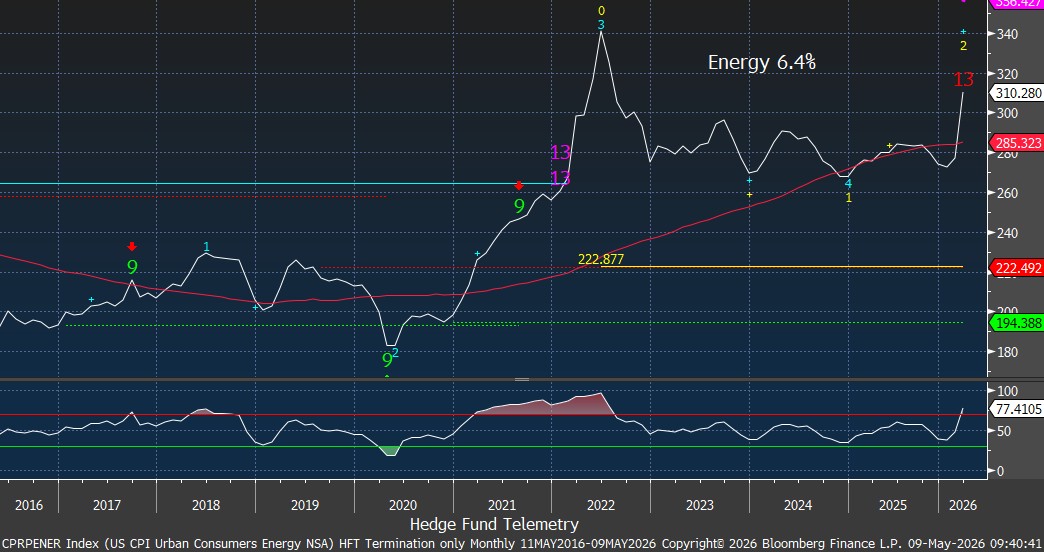
Gasoline in the CPI data has not yet reflected the full move higher, so expect this to show another decent increase in April and May. A 62% increase in the average price of unleaded gasoline in the US from January is getting a lot of attention and causing angst among consumers. Globally, energy costs have also increased, which will hit consumers outside the US.
Energy actually saw meaningful declines from 2022 and is moving up and might surpass the 2022 highs
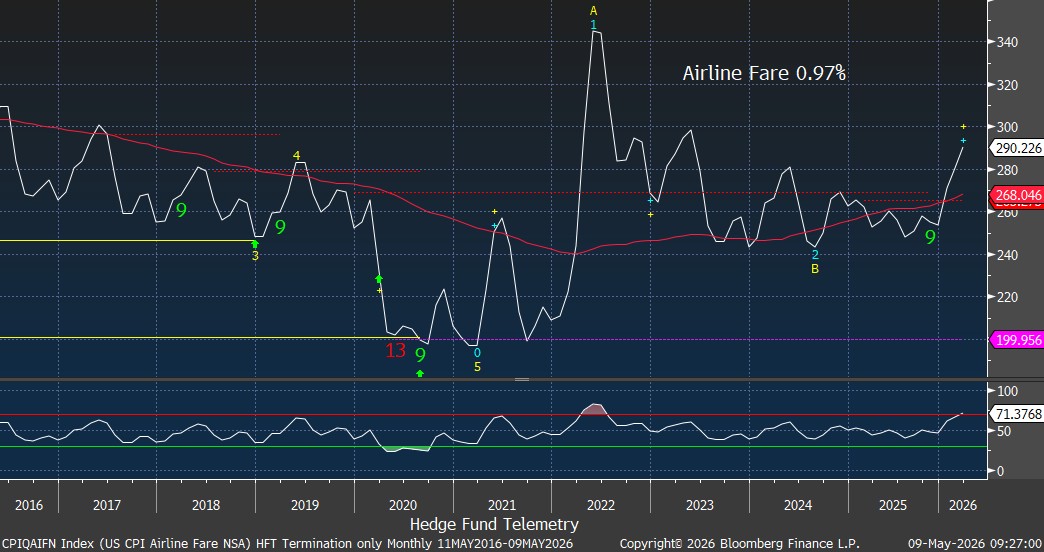
Airline fares are spiking due to higher jet fuel prices, which are similar to those of other petroleum products. Today, Lee Ann told me she has not yet purchased a flight to LA next month. She said she’s been waiting. I said, waiting for what?? I booked her flight tonight. This, too, should show a meaningful increase in April. Higher travel and transportation costs (including freight and shipping) will see demand weakness now or at some point.
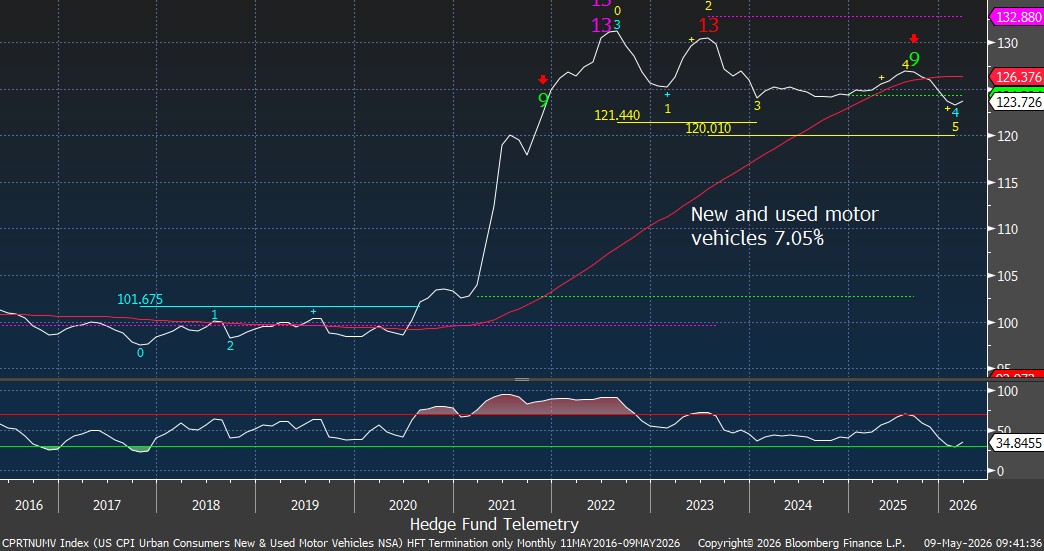
New and used motor vehicles also leveled off in 2022 after significant price increases. Perhaps some good news.
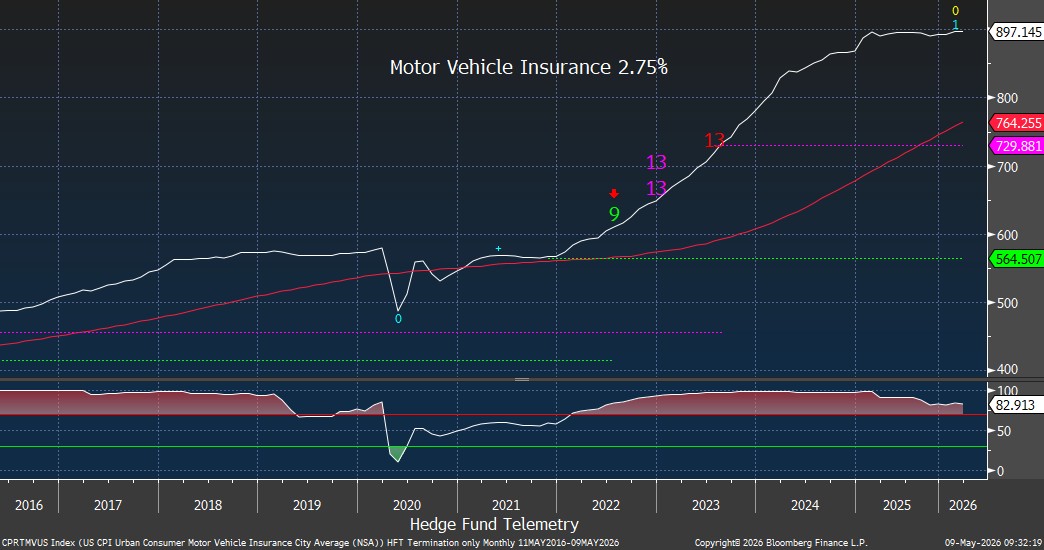
Motor Vehicle insurance leveled off last year but remains elevated.
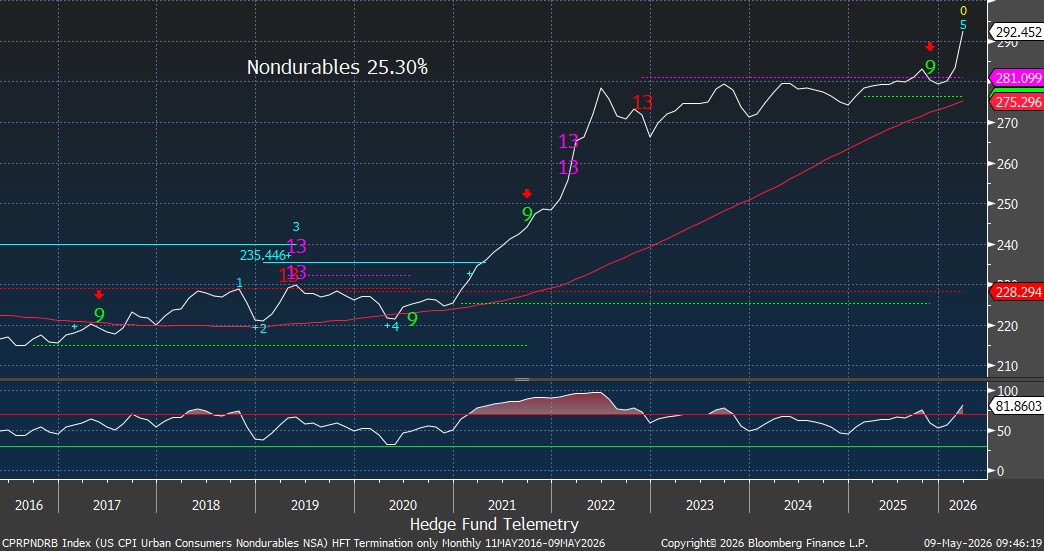
Non-durables with a new leg higher after flat from 2022.
OK, if you’re still with me, here are three components that might be a little humorous.
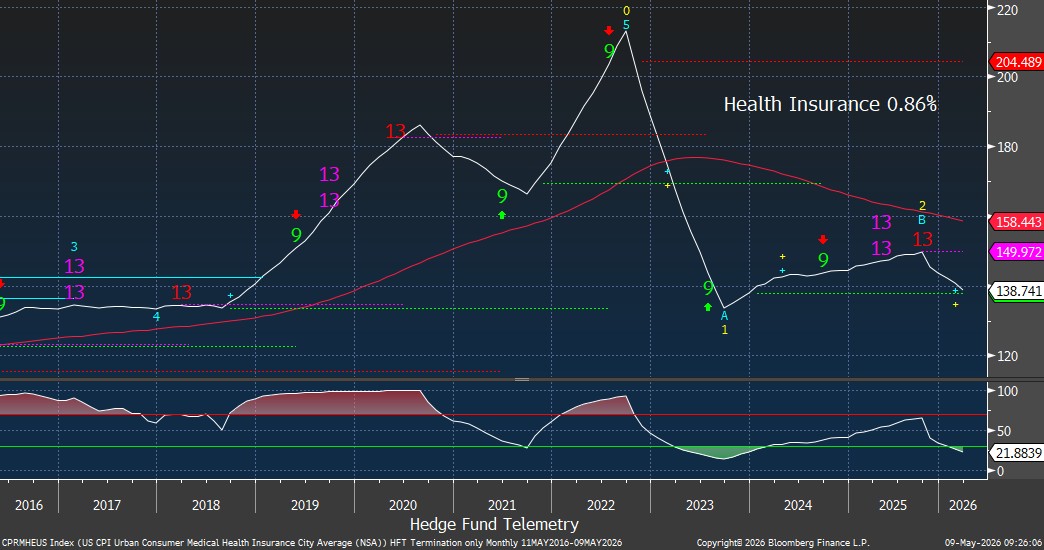
Health insurance prices have been deflating. In what world is this happening? If you pay for health insurance, you know this is a made-up number. And considering one of the four worries mentioned above was about the cost of healthcare, the consumer knows what is actually happening, and they are worried.
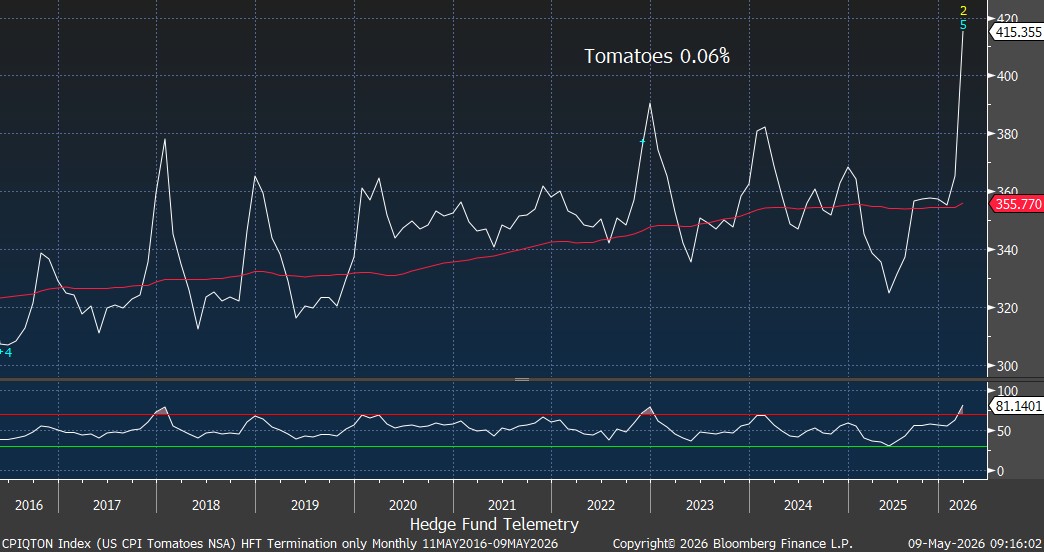
Tomatoes might be a hot topic on the campaign trail come this fall. Prices are spiking, and I love tomatoes.
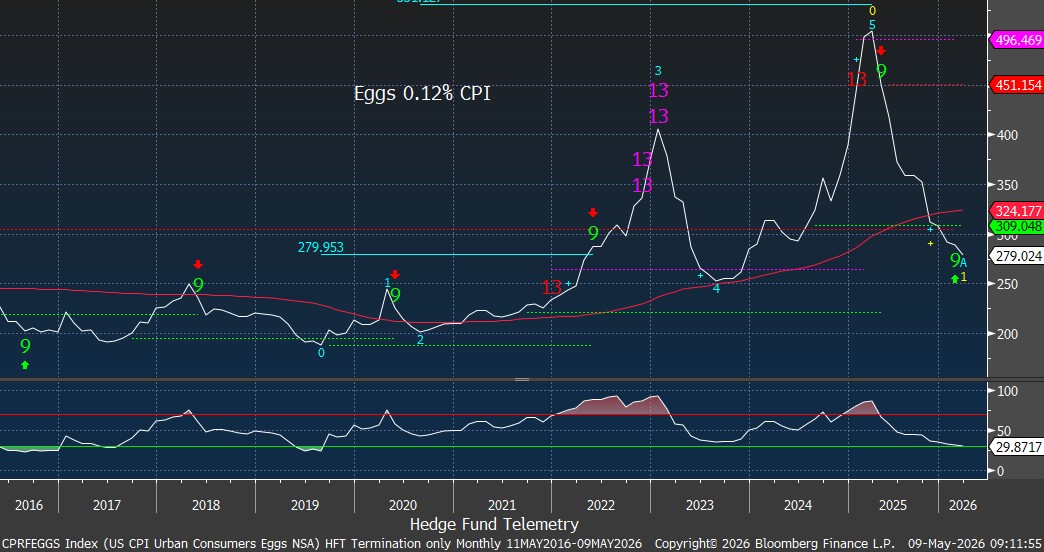
Finally, one of the big talking points and wins that President Trump likes to tout for his affordability push is that egg prices have fallen sharply. Nobody’s ever seen anything like it! (except for in 2023) And it makes up 0.12% of the CPI data.
Thanks, and if you have any questions or comments, please feel free to email me.