

I was recently told that “there are no risks” as faith in the market can’t get much higher with the new market-friendly administration policies. There are things I like about what Trump is doing notably with the government spending waste and hope for M&A coming back with a friendlier regulatory environment. If you know me, I’m not a fan of either party as addressing the bigger issues of entitlement spending with the US national debt won’t be touched. Add in the insanity of how those in elected government positions can freely trade on insider information with both sides making millions. But this is not about the government but more about the markets and some structural issues I’m picking up.
Crowding combined with leverage always poses a risk at some point. Retail is all in, as are funds, as I showed cash levels at decade lows. Last summer, we got a taste and confirmation of the crowding in the markets when the Yen carry trade unwound quickly, hitting not just currencies but everything. Perhaps that was a preview of something more significant since the amount of passive fund flows is even higher today compared to then. Below, I have some charts with important exhaustion signals as well as some thoughts from Nomura’s derivative strategist, who is starting to notice risks derivative traders are always on the lookout.
I’m typically early, as the indicators give signals when everything looks great to the average investor. Some may want to ignore them until they see the risks develop more clearly, and that’s OK, too. My job is to show what I see and think something nasty might be brewing for the coming weeks/months. I have a lot on this note to examine.
Quick Market Views
Stocks: Indexes are up small 0.1% while breadth is moderately negative with NYSE and Nasdaq down ~300 issues. S&P breadth is slightly positive with 276 up, 224 down. With the S&P hitting a new high there are only 5% with new 52 week highs.
Bonds: Rates reversed lower more on the short end with 2’s down 3bps and 10’s down 1bp.
Commodities: Energy remains strong with Natural Gas up 7% (it’s cold in the US right now) and crude is up 0.5%. Metals are weaker with gold down 0.1%, Silver down 0.5%. Copper is down 0.5%.
Currencies: US Dollar Index is up 0.1%. I still am watching the Yen with USDJPY at 151.53 with risk if this break 150. Bitcoin is up 0.5%
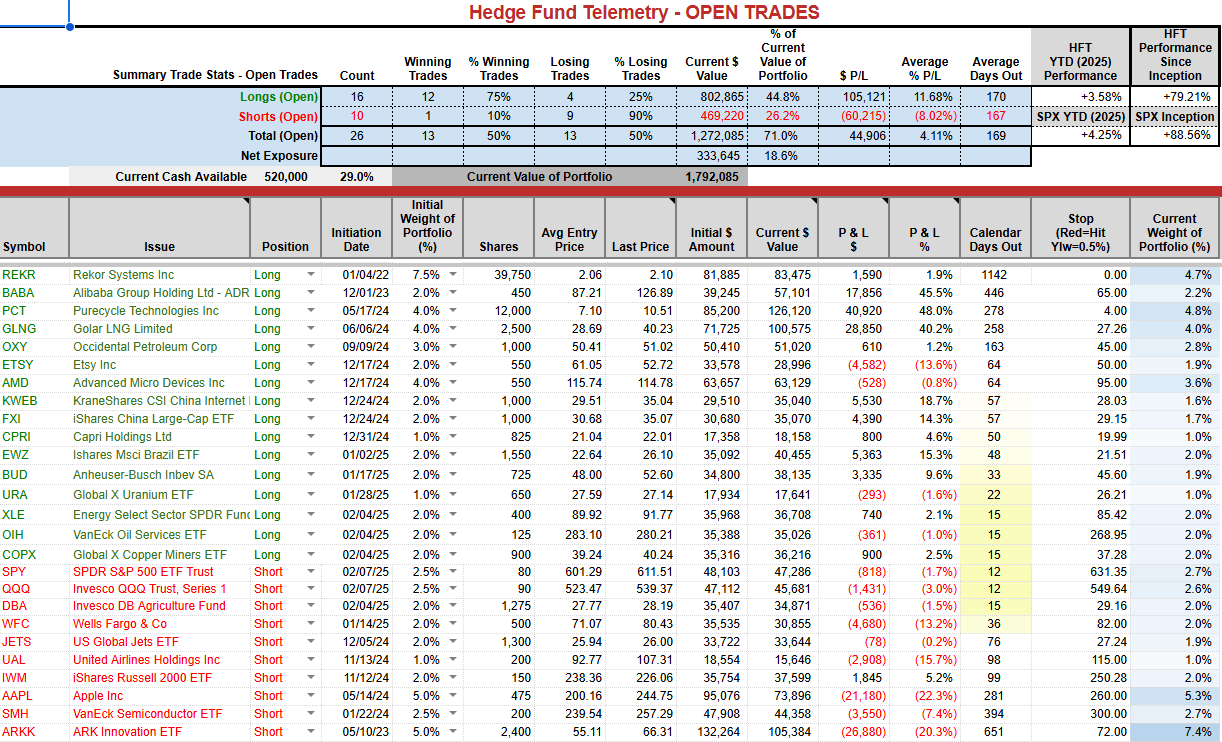
Trade Ideas Sheet: A little give back with 0.25bps today but still on track.
Changes: I will double up the SPY and QQQ shorts to 5% weight momentum is slowing. I will take off some longs: OXY with a 1.5% gain, CPRI with 6.5% gain (it’s small and I am impatient), ETSY wiht a 13% loss (not horrible results but they have work to do and need another quarter to show progress), I will also sell BUD long with a 10% gain. (new sell Setup 9). I am watching to add to Uranium long (see below). I will hold BABA and China exposure ahead of tomorrow’s report as we have cushion with a 45% gain.
I am also recommending buying the March 21st expiration SPY 605-590 put spread for $2.50. Also March expiration QQQ 530-500 put spread for $4.00. As always these can and might go to zero as they are hedges so keep your size small.
Thoughts: There’s a lot on this note that clarifies my concerns. I am comfortable with current longs and shorts.
US INDEXES
Here is a primer on the DeMark Setup and Sequential indicators.
S&P futures 60-minute tactical time frame continues to move sideways at the top end of the range in the last 6 weeks.

S&P 500 Index daily has everyone excited however there is a new DeMark Combo 13 with the strict version now in play. There are other global indexes with Sequential and Combo 13’s now in play too. Other Combo 13’s recently did see a period of pullbacks that were exploitable on the downside. A move to the 50 day at 6000 is doable, perhaps more.
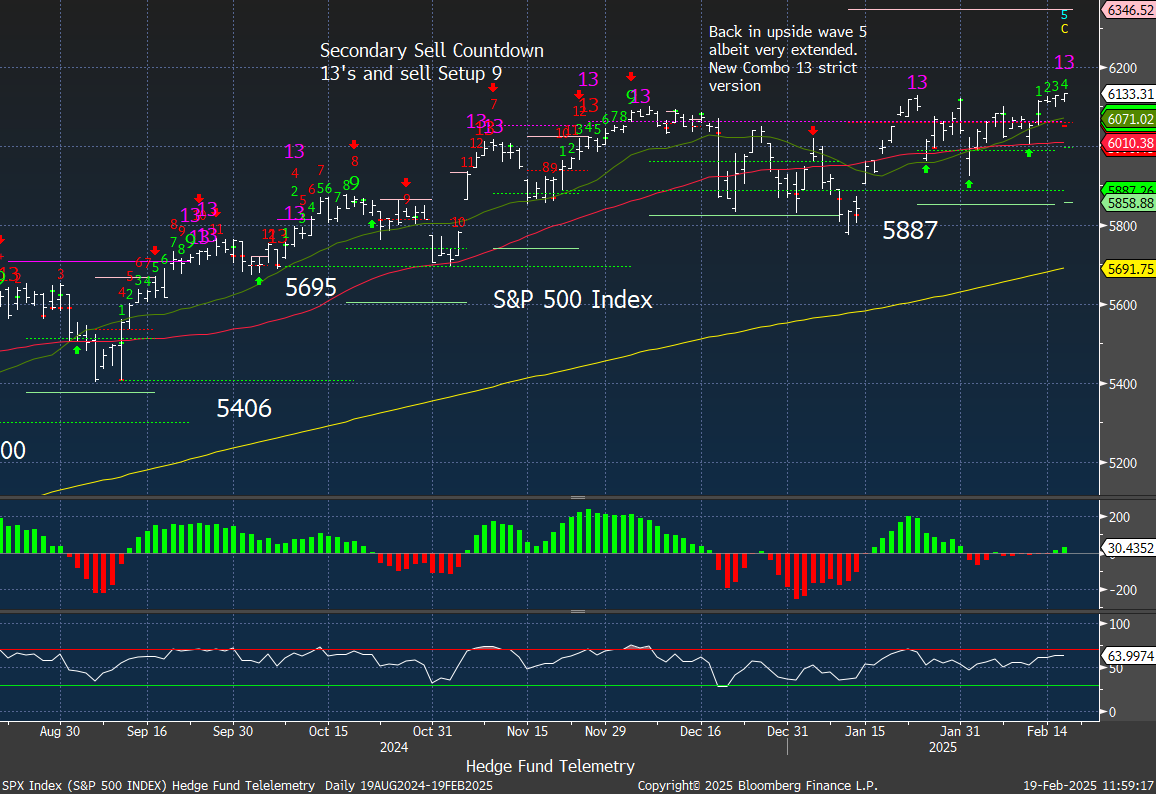
The weekly also has the strict version of the DeMark Combo 13 today with the new high.

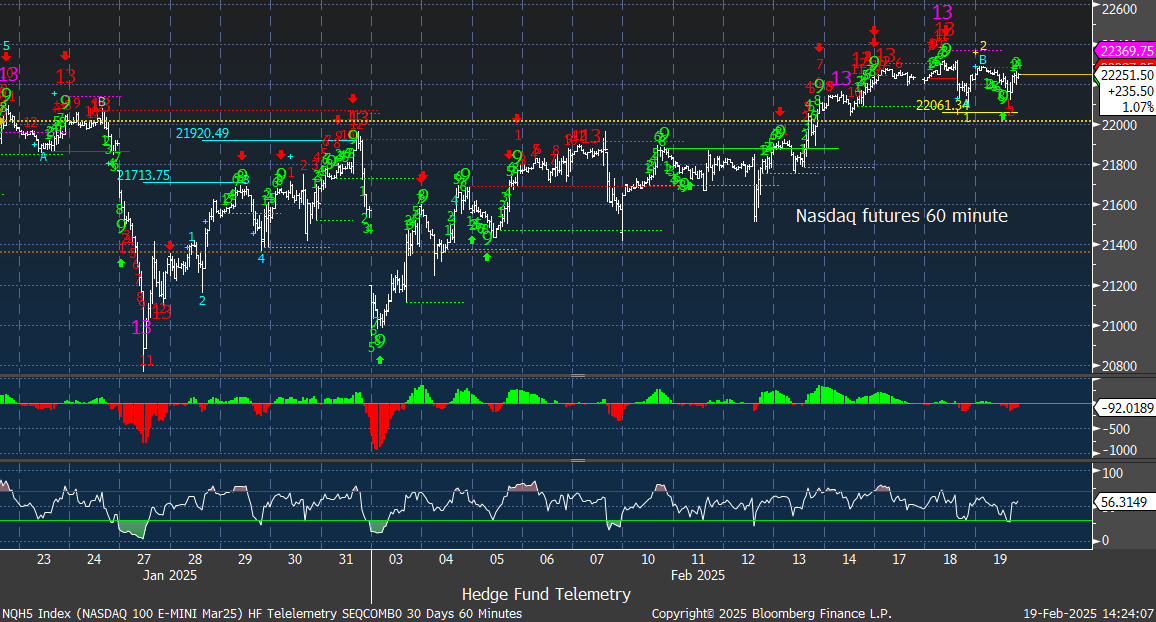
Nasdaq 100 futures 60-minute tactical time frame with recent DeMark Sequential and Combo sell Countdown 13’s stalling the advance that lacks momentum.
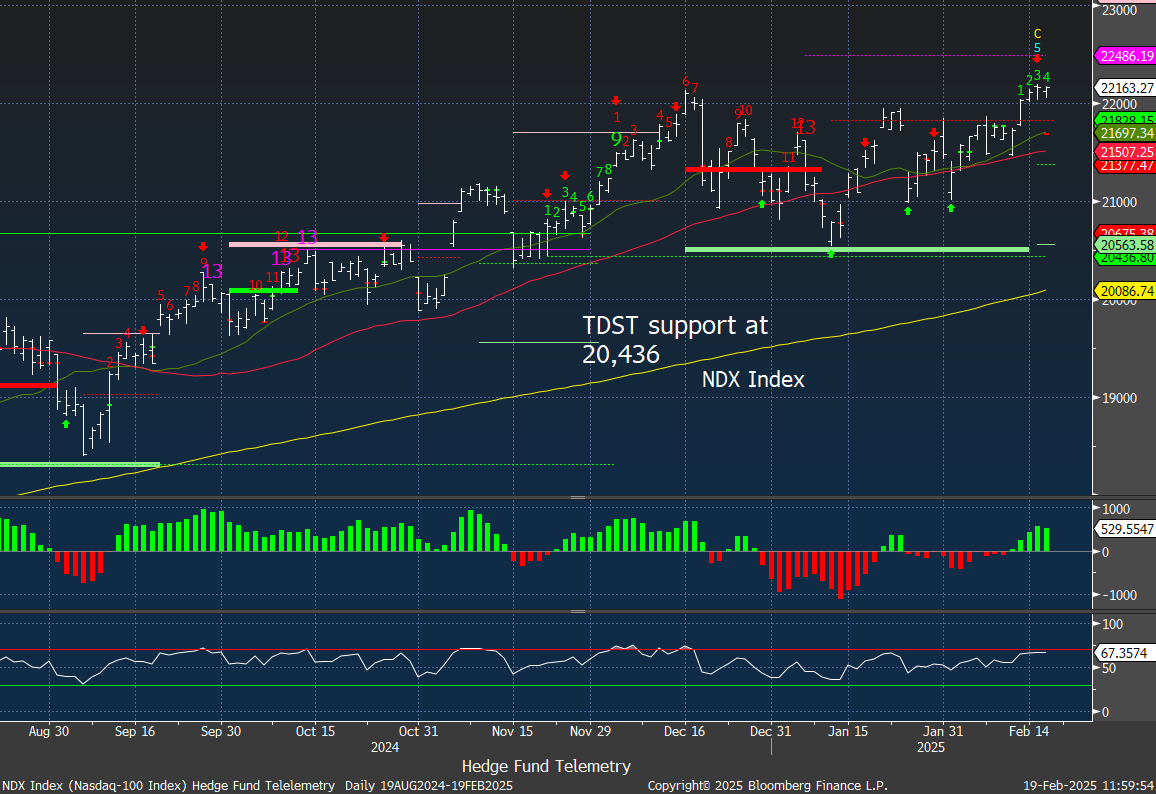
Nasdaq 100 Index daily not doing much today but well above the 50 day which I’ll say is first major support.
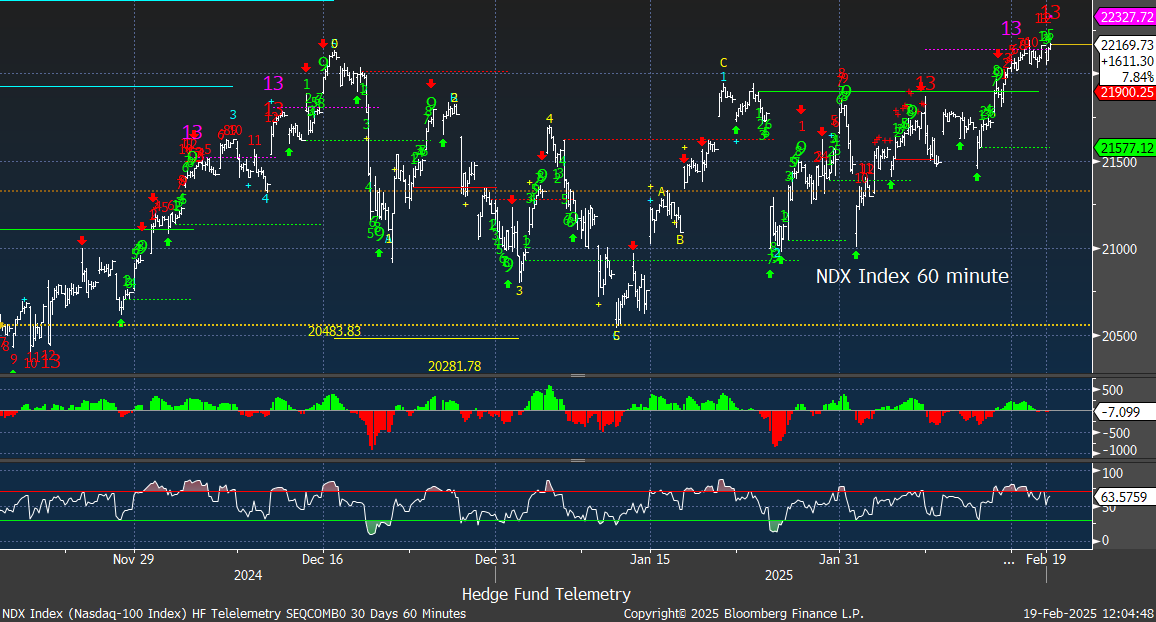
NDX cash Index 60 minute does have new Sequential and Combo 13’s
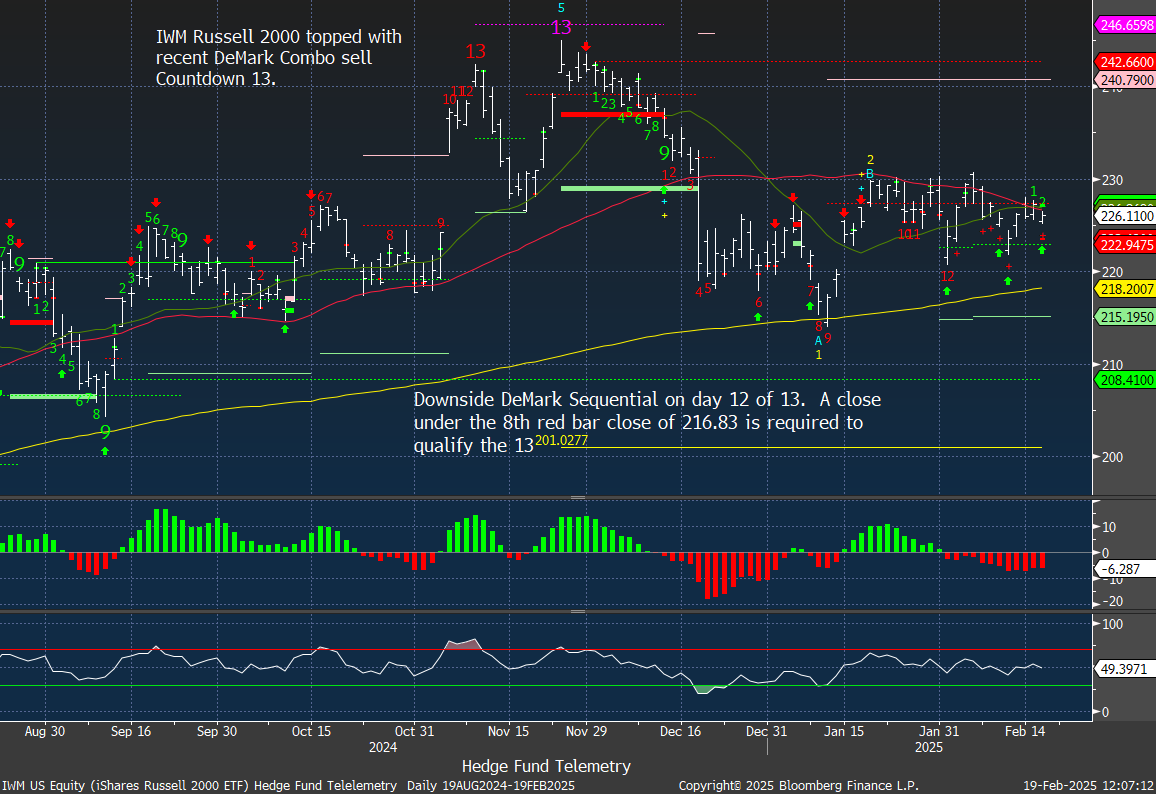
IWM Russell 2000 continues to trade sideways well off highs. I will stay short.
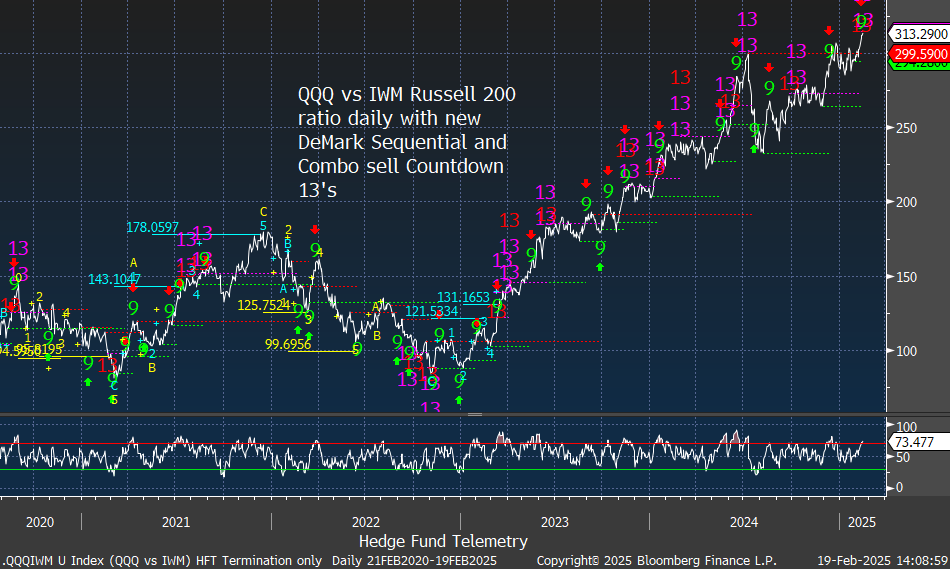
QQQ vs IWM Russell 2000 ratio has new Sequential and Combo sell Countdown 13’s now in play. Historically, these signals caused a stalling or pullback in the overall market. It’s not a buy IWM, sell QQQ as I believe if QQQ does pullback it could pullback more than IWM which could and probably would pullback as well.
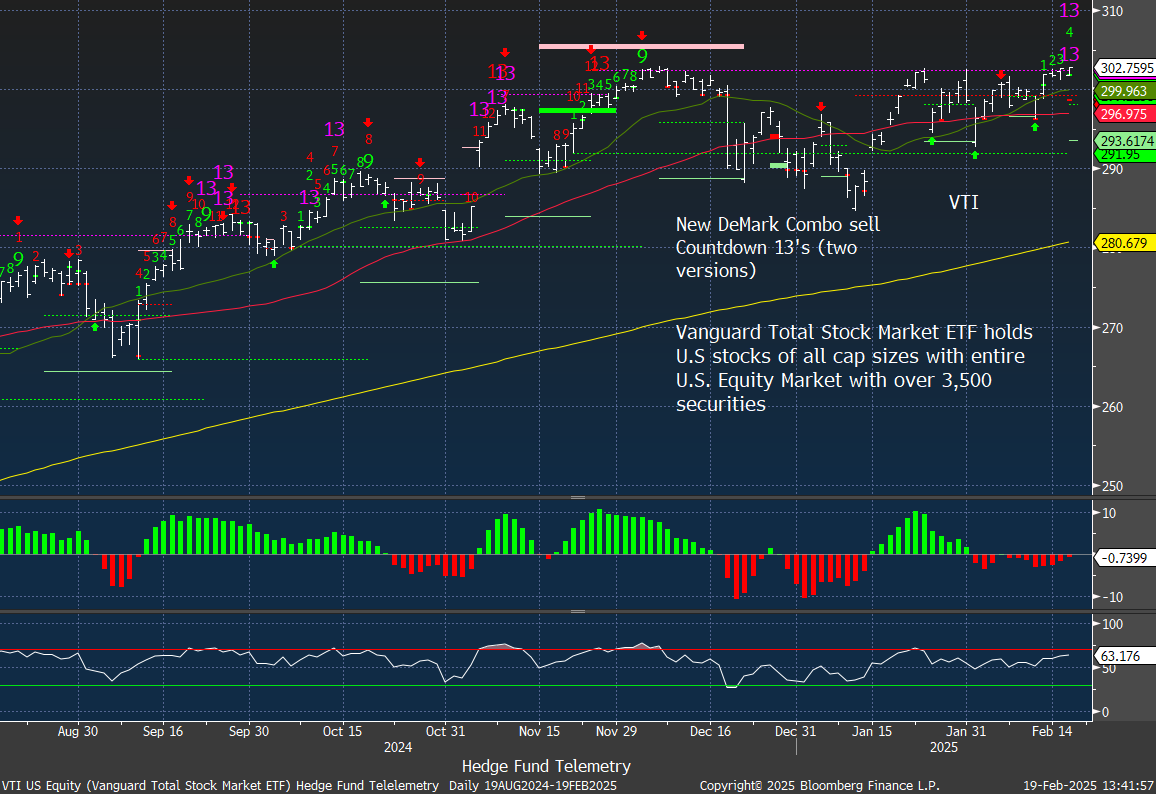
VTI is the total US market cap of 3500 stocks and also have new Combo sell Countdown 13’s which has seen pullbacks in recent memory. Perhaps not as much as some might have wanted but pullbacks nonetheless.
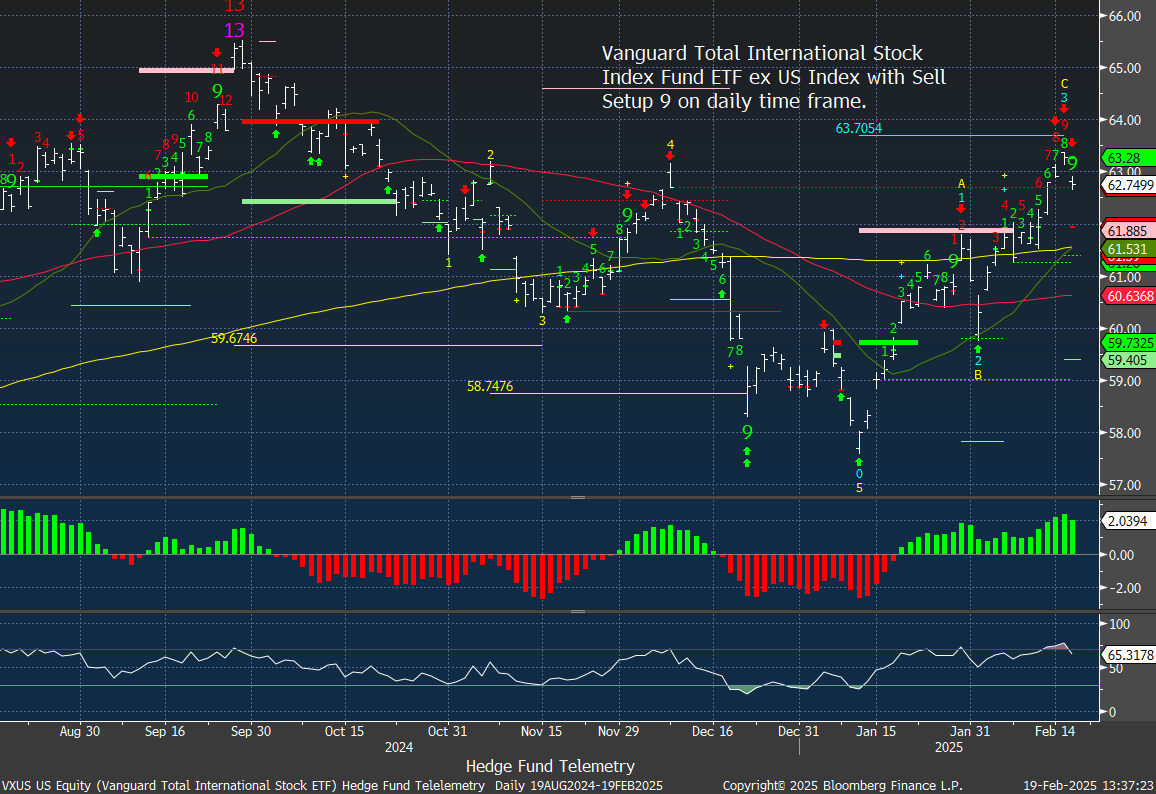
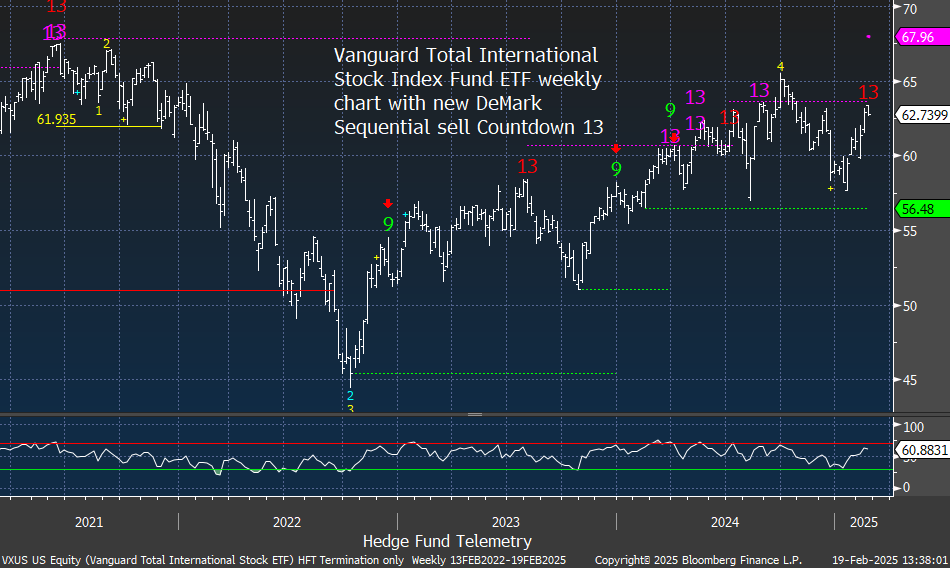
VXUS is the international ETF outside the US with a daily Sell Setup 9 and weekly Sequential sell Countdown 13. Sell Countdown 13s are also available on some international indexes, including Hong Kong and European indexes.
The weekly has a new Sequential sell Countdown 13 with a decent record of working shortly after these signals.
Trade Ideas Sheet
Pre changes
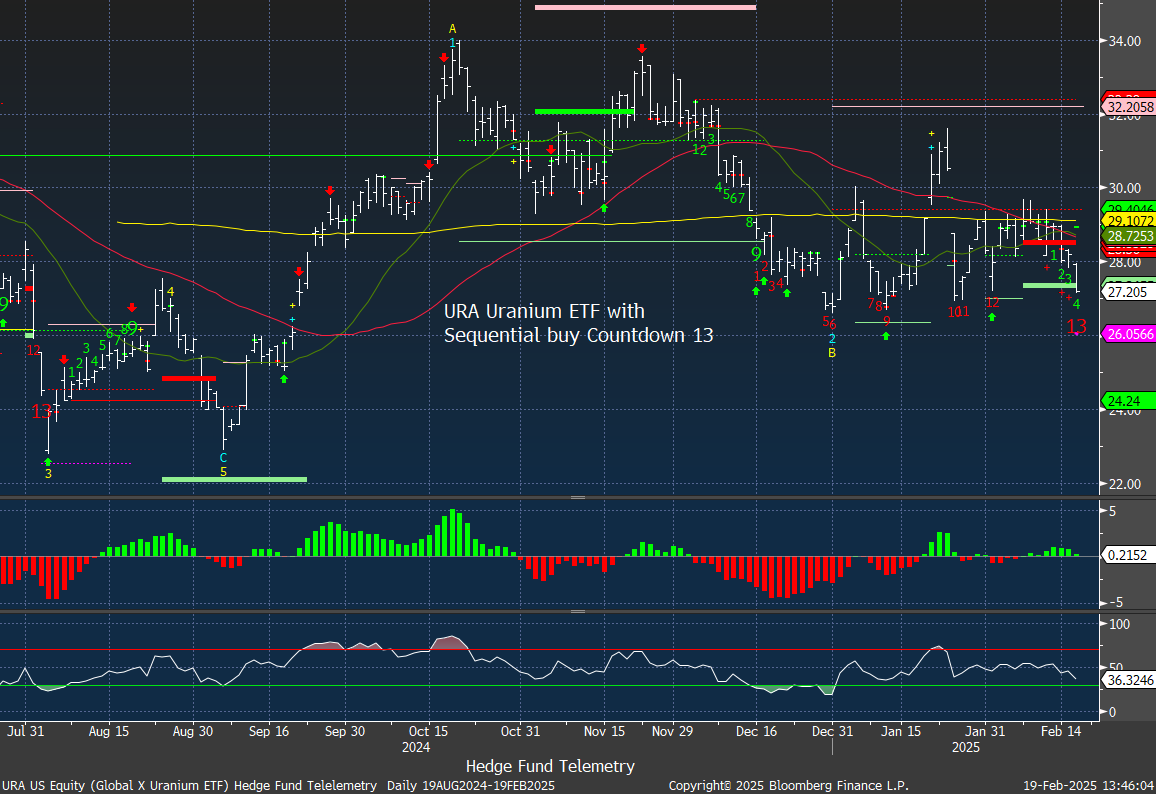
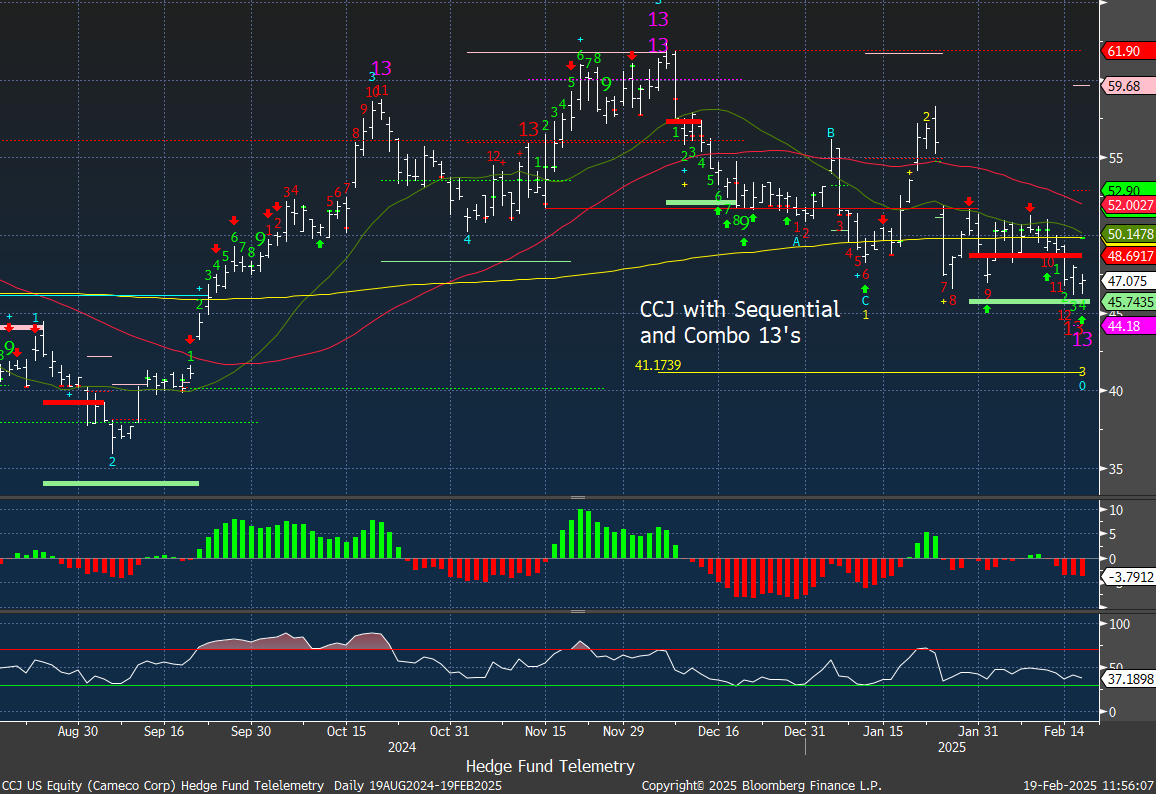
I’m a fan of the nuclear power trade for the long term. It’s a proper solution for the global energy needs which is cleaner, safer and smaller than the ancient nuclear power plants and other forms of energy production. If the US wakes up to this in the coming years, they won’t get behind other countries that are rapidly advancing this technology. In the short term, I have a small 1% weight as a marker size position as I’ve been anticipating downside DeMark Sequential buy Countdown 13’s which we now have today. CCJ Cameco reports tomorrow and I don’t know if it will bounce but I want to increase my position once there is a reversal up. I will add to these on an upside close.
NVDA is the most important stock in the market and reports on February 26th. It’s bounced back led by retail buying this by far the most of any stock. The risks with the stock currently are with delays with the new Blackwell chip sets (it’s been going around for the last few weeks) as well the Deepseek alternative that doesn’t need the extreme computing power. Add in the high bar for guidance beat which has seen drops in the past if not extraordinary. $3.5 trillion market cap trading at 55x P/E.

Short basket, crowding, and the risks
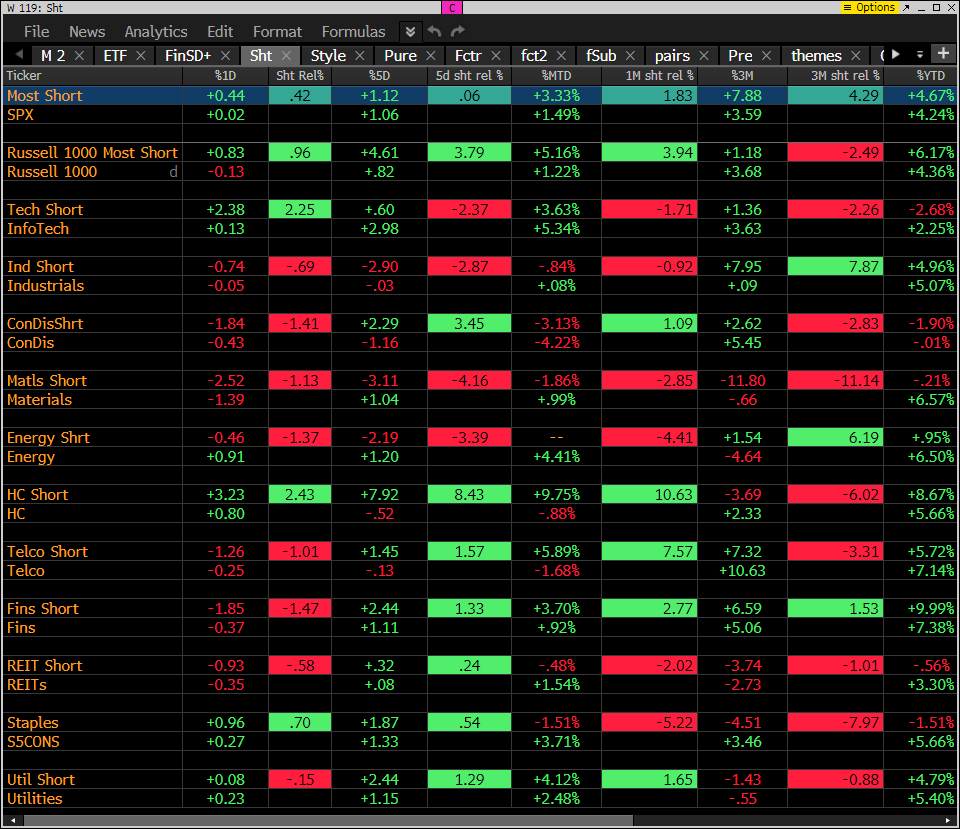
The GS most shorted basket has been moving sideways, with the markets lacking momentum on the upside and downside. This tells me that the index action is driven by short covering and long-only buying. It confirms the other data regarding the market crowding, especially with retail leading the charge.

Charlie McElligott from Nomura is a derivatives specialist that many of us follow. When at my fund, my first call was always with the sell side derivative options guys as they tended to know “where the bodies were buried” or, in kind words, where the risks in the markets were positioned. There has been some recent heavy call buying of VIX volatility index options. Charlie has some concerns. When we see high percentile levels of exposure that could get off sides quickly, we need to take notice.
Charlie – “So yes, this estimate of VIX Dealer / MM net “Short Gamma” imbalance is indeed something fierce (although again, admittedly, the night before VIXperation)“
Charlie – “But holy cow…when looking at our usual VIX slide shocks, the cumulative projected impacts of said current Options Dealer positioning / hedging alongside the VIX ETN complex implied rebalancing then speaks to a hypothetically eye-watering and amount of VIX Delta to buy“
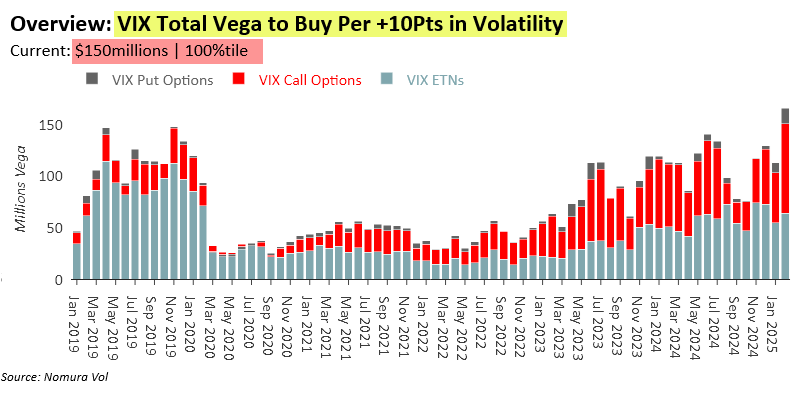
Charlie – “The coil is ever-so-slowly being loaded for a “Vol Squeeze” within U.S. Equities…but I don’t believe that we are in position for a big de-risk just yet, as the market begins to socialize the clustering risks and required positioning –dynamics to get there”
Charlie – “I discussed the new VIX Call flows (Dealers / MMs Short ~280k March 24C and 25C to Customer buyer on what I’m speculating is a is U.S. govt shutdown hedge) in the post U.S. Equities close note I sent last night–with a hypothetical-yet-spooky backtest (see last night’s note) on potential Vega hedging requirements in a Vol Shock which then creates the energy for a nasty negative convexity “Vega Squeeze” if Spot VIX rallies towards those strikes as we approach said March expiration, as Vol of Vol would likely blow higher again on Dealer / MM reaching out into higher strikes / buying VIX futures to stay hedged, which would then widen the distribution of outcomes into ever-dicier territory.”
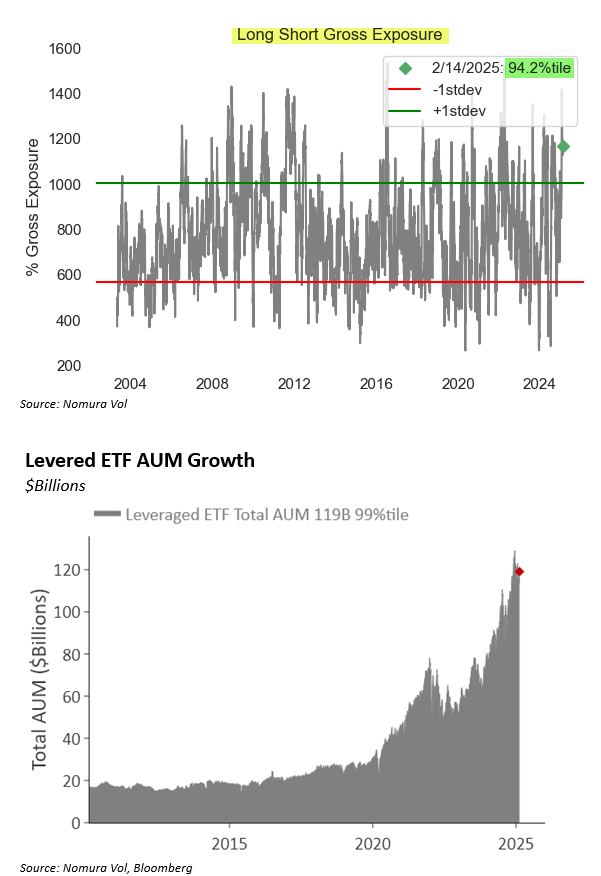
Tom – I have discussed how crowded the markets are with huge retail buying at the highs (various sell side brokers have confirmed this action). Hedge funds are positioned long with exposure at 94 percentile. And below the leveraged ETF AUM is at 99th percentile. When NVDA fell hard recently the triple levered semiconductor ETF dropped over 50% in one day. Imagine if there is some sort of shock in the market and ALL the levered ETFs have to sell. Good luck getting out first…
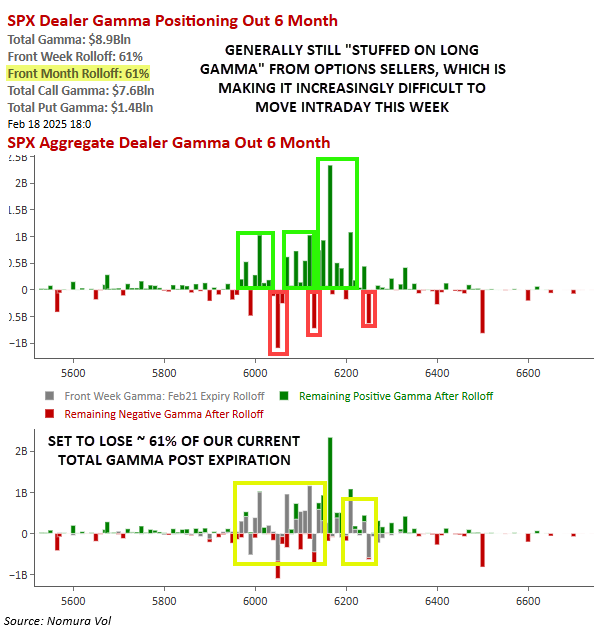
I’ve discussed the lack of momentum in the last week, and Charlie covers this here. Once this expiration is complete, the markets will be more free to move.
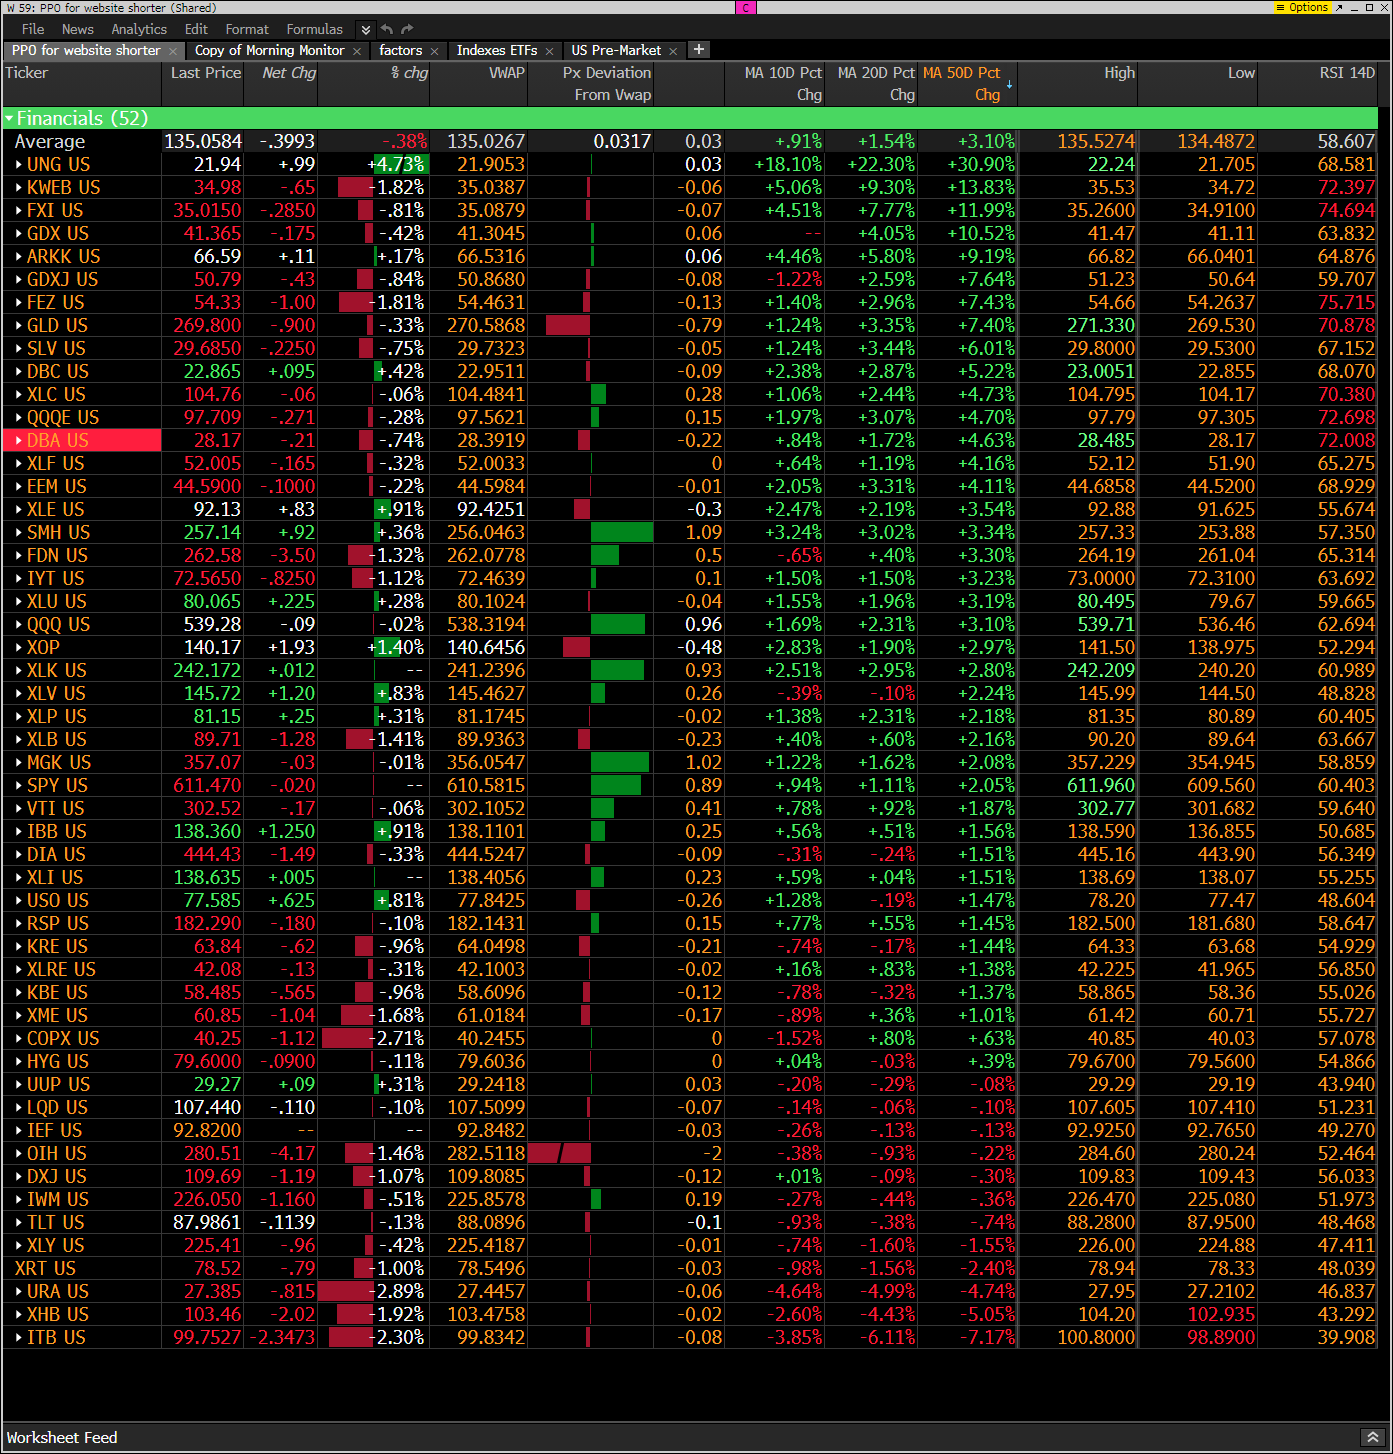
Hedge Fund Telemetry ETF Percentage Price Oscillator Monitor
The PPO monitor (percentage price oscillator) force ranks ETFs by percentage above/below the 50-day moving average. For information on this monitor, please refer to this primer. This monitor and others are offered to Hedge Fund Telemetry subscribers on Bloomberg.
Goldman Sachs Most Shorted baskets vs. S&P Indexes
This monitor has the S&P indexes and the Goldman Sachs most shorted baskets.
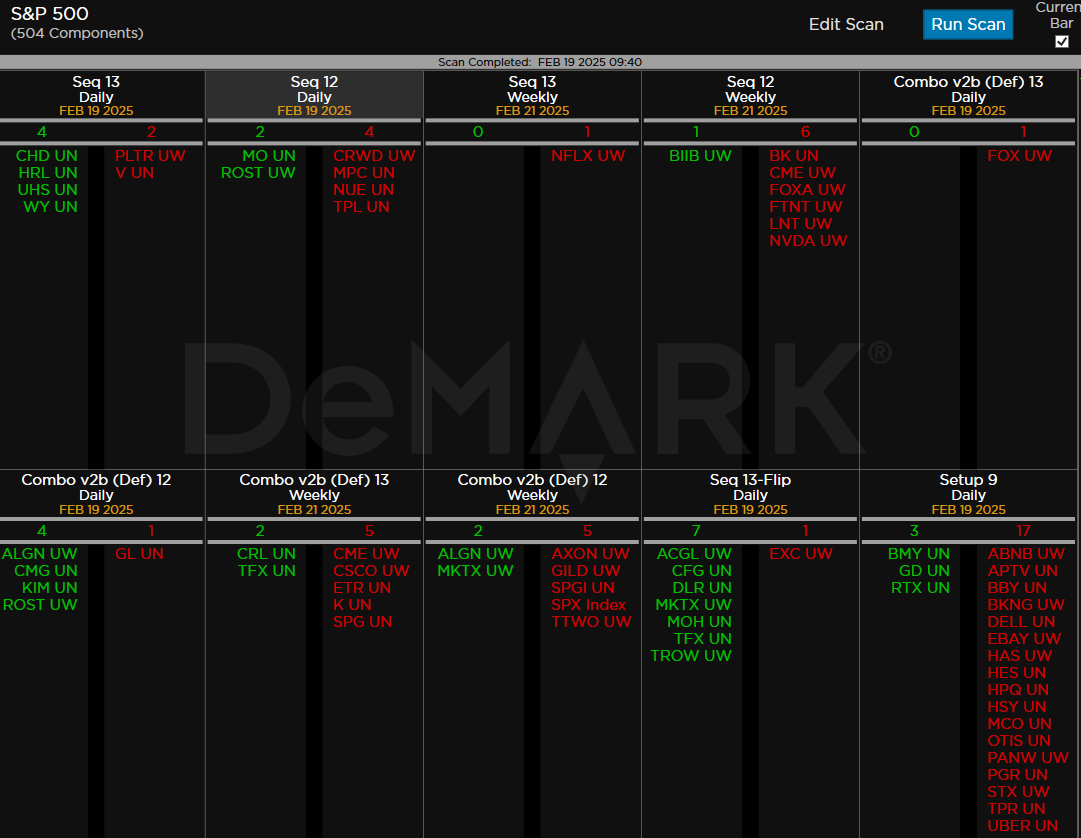
DeMark Observations
Within the S&P 500, the DeMark Sequential and Combo Countdown 13s and 12/13s on daily and weekly periods. Green = buy Setups/Countdowns, Red = sell Setups/Countdowns. Price flips are helpful to see reversals up (green) and down (red) for idea generation. The extra letters at the end of the symbols are just a Bloomberg thing. Worth noting:
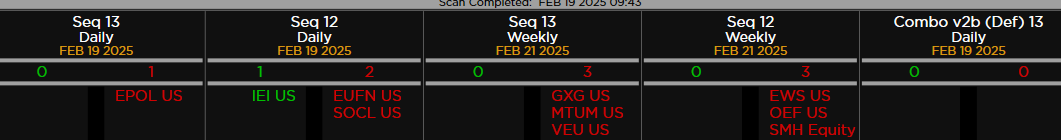
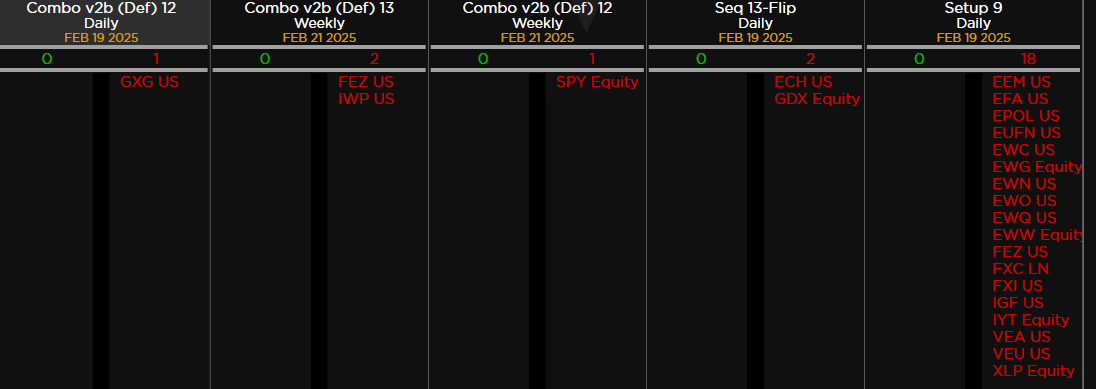
Major ETFs among a 160+ ETF universe.
If you have any questions or comments, please email us. Data sources: Bloomberg, DeMark Analytics, Goldman Sachs, Street Account, Vital Knowledge, Daily Sentiment Index, and Erlanger Research