A blow-off top is a fast, almost vertical final surge in price—driven by fear of missing out—followed by a sharp reversal. It typically ends an extended uptrend when late buyers crowd in and liquidity thins. If you look at the weekly charts that lacked any pullback from April, it is more concerning, as pullbacks typically remove some froth and allow people to buy reasonable dips. The longer this goes uncorrected, the steeper and deeper the decline is possible – especially with the most shorted baskets lifting and clearing out shorts who would be natural buyers on declines. Those bullish the market, I have heard say “it’s just getting started”, “a new bull market”, “it’s not a bubble”, and some say “it is a bubble” in the sense it’s good to buy now. This time, like every time, is different from other bubbles or significant tops. “It still can go more vs what happened in 1999.” “Valuations are not extreme like 1999.” I can go on, but let’s look at the checklist and facts:
- Parabolic slope – the move off the April lows has not had the S&P touch or close under the 50 day moving average since April. This is one of the longest uncorrected moves I can recall in my career.
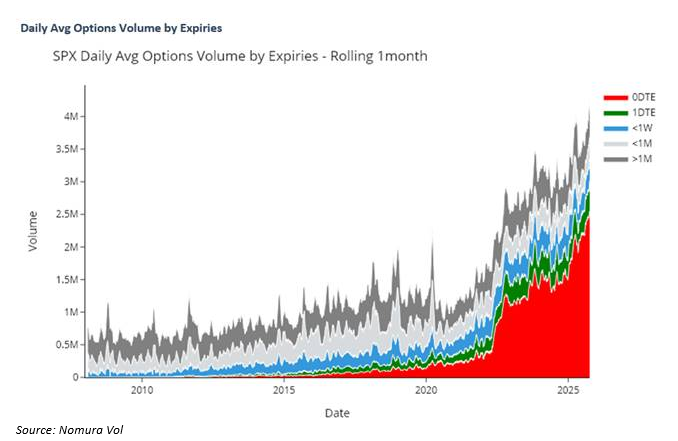
- Climactic volume and heavy options activity (calls). 0DTE options trading is now the clear majority of options trading. Equity put-call ratios are at low levels seen at other peak index levels.
- Gap-ups that fail intraday, often, I will wait until later in the day to get a better representative price.
- Sentiment extremes (euphoria, “can’t go down,” “fundamentals don’t matter” “so much liquidity” narratives). Daily Sentiment Index charts we use have the 20 day moving average of bullish sentiment at 75%+. Other sentiment polls for equities have similar readings.
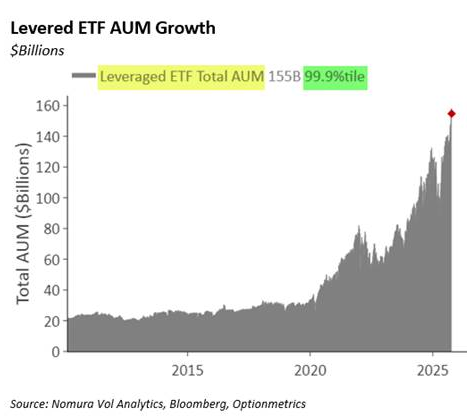
A few attributes that make this time different… and not in a comforting way. The amount of leverage is extreme, surpassing that of the tech bubble period, especially when factoring in the huge AUM of levered ETFs. The amount of credit and debt of all sorts, from sovereign to investment-grade/high-yield and opaque private credit, is extreme; it might as well include consumer buy-now-pay-later usage. According to MS, retail investment in equities saw a record $100 billion in the last month. Concentration is unprecedented, with the top 10 S&P stocks’ weight now accounting for 40% of the total market capitalization in the S&P. Nvidia has been the most significant contributor for several years, attributing nearly 20% of the total S&P gain by itself. Valuations are elevated, perhaps not elevated enough to scare the bulls who cite the 2000 P/E levels. The majority of the gains have not been due to earnings growth; rather, it’s been multiple expansion. The AI theme has carried the weight of the gains in the indexes, and the recent circular financing transactions are questionable, which leaves little room for maneuver if and when capex growth starts to peak or slow in 2026. I’ve recently highlighted the risks associated with the AI theme, which revolved around funding, power generation deficits, and ultimately, return on investment. JPM’s excellent industrials analyst recently stated that the current energy requirements for the slated AI data centers in the US are 16 gigawatts, whereas the total US electricity output is 25 gigawatts. Some things don’t add up with the hopes for AI data center deployment in the near term or even the next five years.
Complacency back in 1999 was similar to other periods of extreme market moves. The economy was strong; the US government was running a surplus, with total US debt at $4 trillion. Jobs in new technologies were booming. The Fed was accommodative after the late 1998 LTC mess and worries over Y2K disruptions. Today, the economy is strong, but fueled by government deficit spending and an accommodative Fed, which has implemented four rate cuts in the last year. Inflation concerns were put in the background as the Fed is concerned about unemployment increasing, which remains at a historically low 4.3%. The amount of confidence and reliance on the Fed saving the day again has never been higher. Housing in 1999 was increasing and today housing is in a severe slump. Treasury rates remain elevated compared to the last 10 years, but are still around the average historically, due to high deficits and US debt now exceeding $37 trillion. Debt service is now one of the highest government outlays, and with the government in need of lower Treasury rates, the plan to roll the US debt with short-term T-bills will continue. The bottom line is that it is a precarious situation overall, and a lot has to be perfect without disruption in any of the markets (both equity and bond markets).
I’m not hoping for some financial calamity, as I believe the administration has a big task to pull off an economic miracle. I would have said the same thing if the other party were in power. I’m more of a realist, and I believe I have a decent amount of experience navigating other bubble-like periods and longer-term financial market history, knowing that the possible outcome could be difficult. One thing is true: as bubbles and market speculation increase every decade, a new crop of market participants emerges who lack experience and are more than willing to participate. This particular period has a significantly more gambling mentality, perhaps due to the prevalence of gambling on nearly everything, not just in markets, but also in sports and politics, all done on phones!
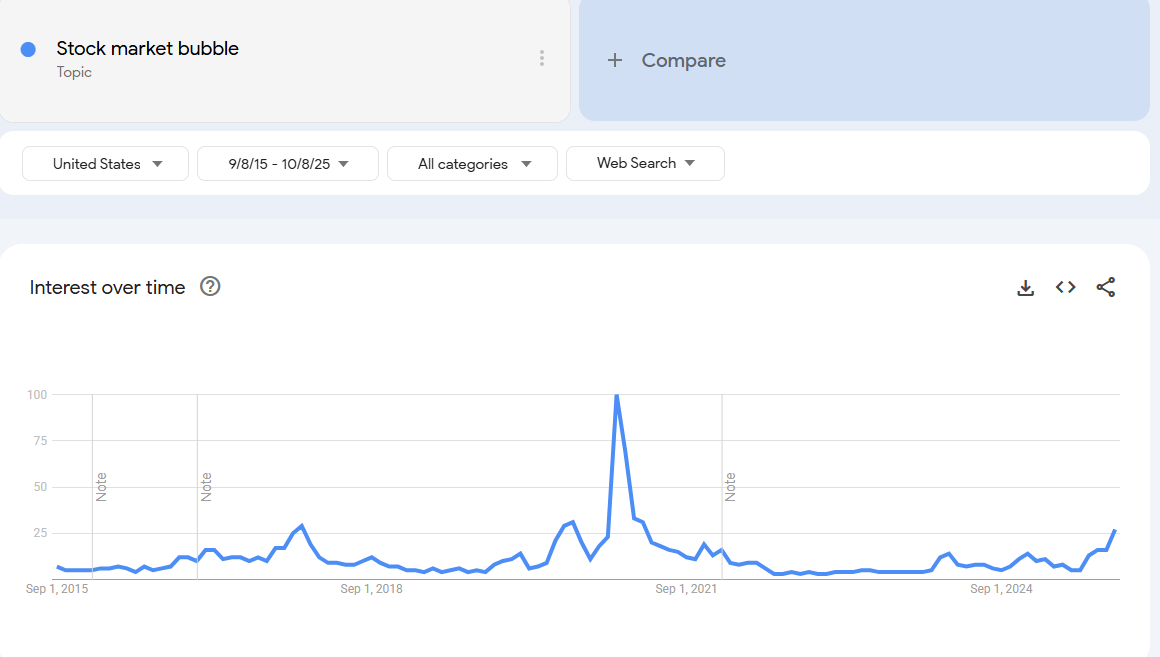
My concern about a market event occurring in the near term has increased due to all of the above issues. The steepness of the move is blow-off top in nature since there has not been any pullbacks to work off some of the froth and complacency. I ran a quiry on Google Trends for “Stock Market bubble” and found a few other instances when people searched for it. January 2018 was a time when the market increased sharply, ignoring several daily DeMark exhaustion signals, but then the market cracked hard with a volmageddon blow up. The next was in late summer in 2020 after the large move off the covid lows. The markets also pulled back by over 10% but recovered significantly, reaching a level higher with the ARKK’s February 2021 peak. The majority of stocks peaked in February 2021 and the index narrowed with mega-cap peaking in late 2021 with a small increase in searches. It flatlined as the markets went lower in 2022. And now it’s increased again.
A lot of stuff to check out on this note. Let me know if you have questions.
TRADE IDEAS
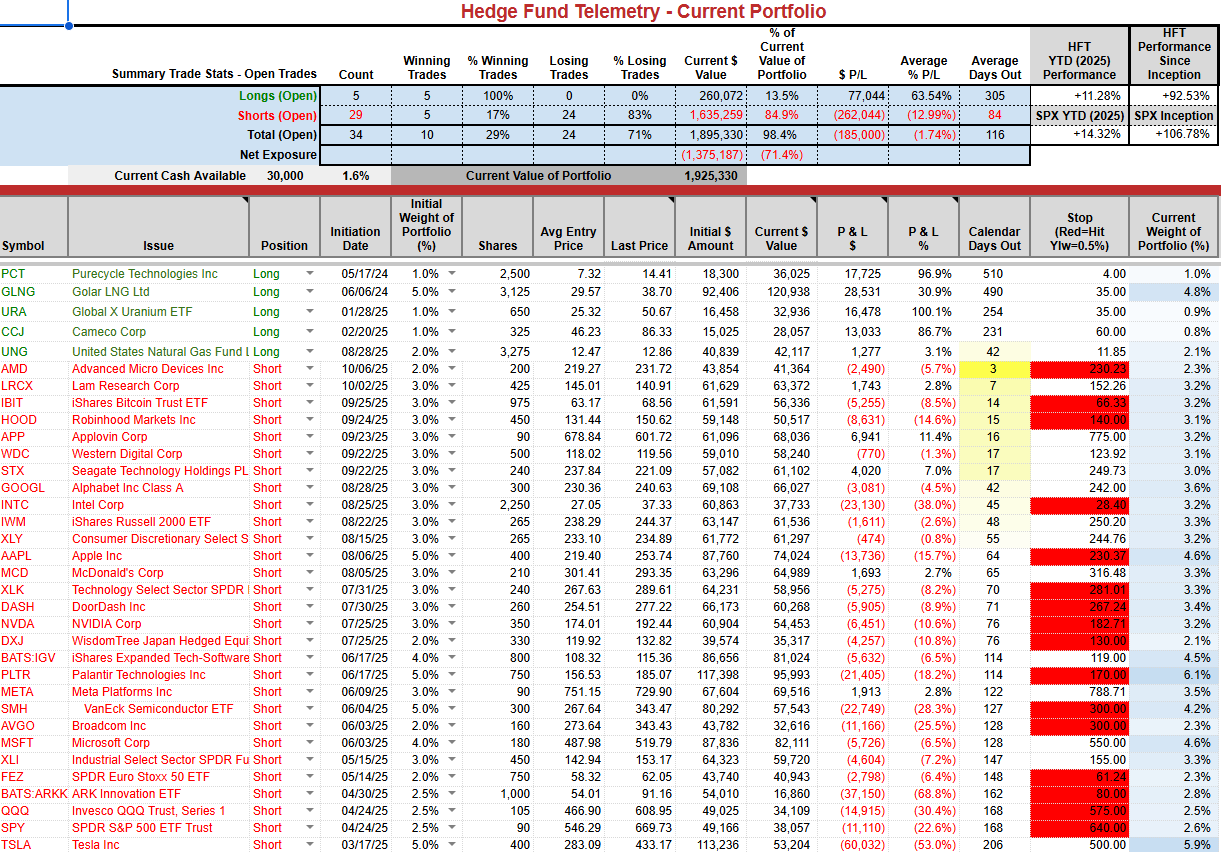
Starting to see some shorts move lower. Keeping sizing as is right now and still have plans to press on breakdowns. Several may not get back to cost but if they drop it will benefit the overall PNL. I have booked significant gains this year and can afford to take a bit more risk, positioning myself net short.
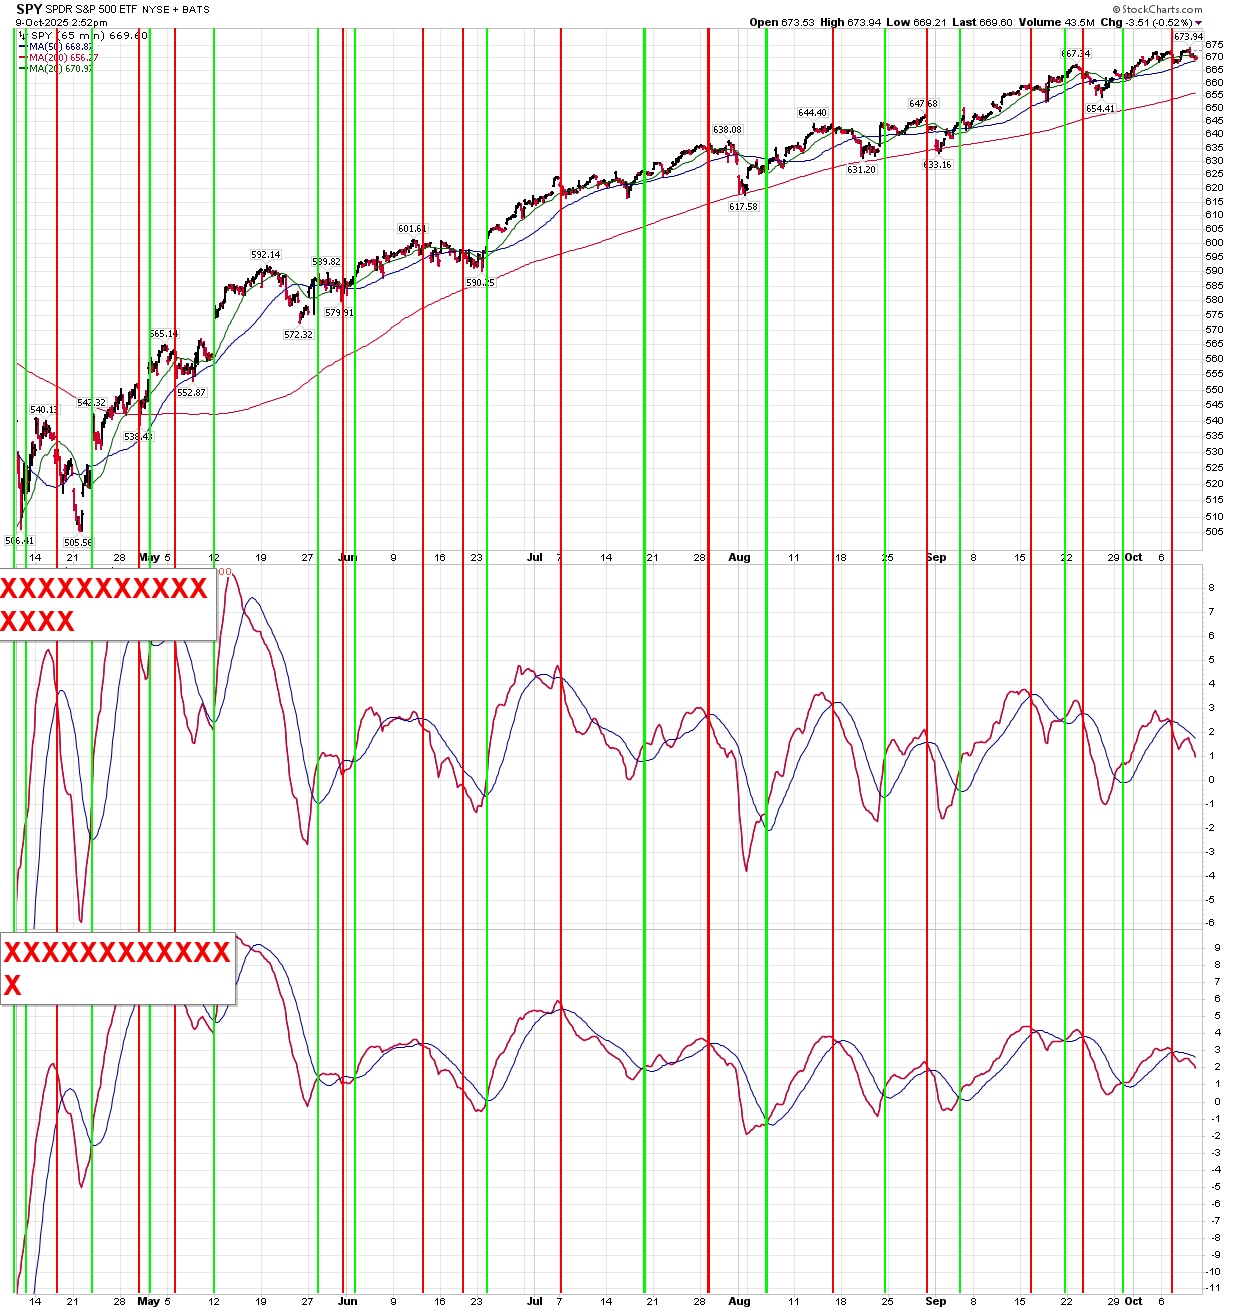
The short term SPY and QQQ momentum indicators remain on sell signals
US MARKETS
Here is a primer on the basics of the DeMark Setup and Sequential indicators.
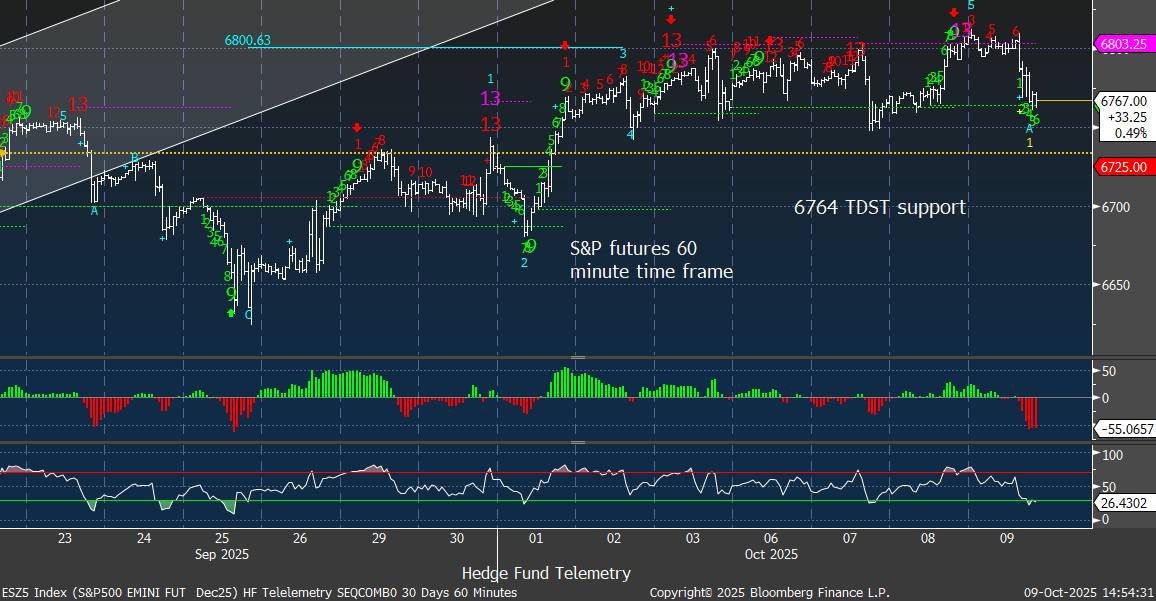
S&P 500 futures 60-minute time frame holding the recent lows with TDST Setup Trend support (green dotted lines)
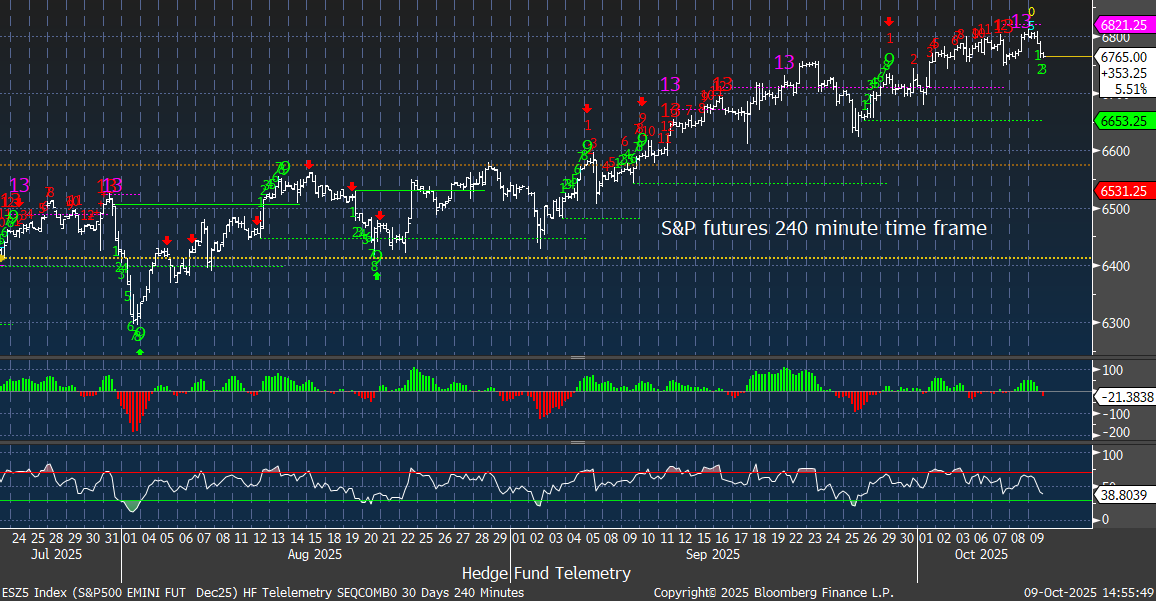
S&P 500 futures 240-minute time frame is a good time frame in between the 60 minute and daily. New Sequential and Combo sell Countdown 13’s in play.
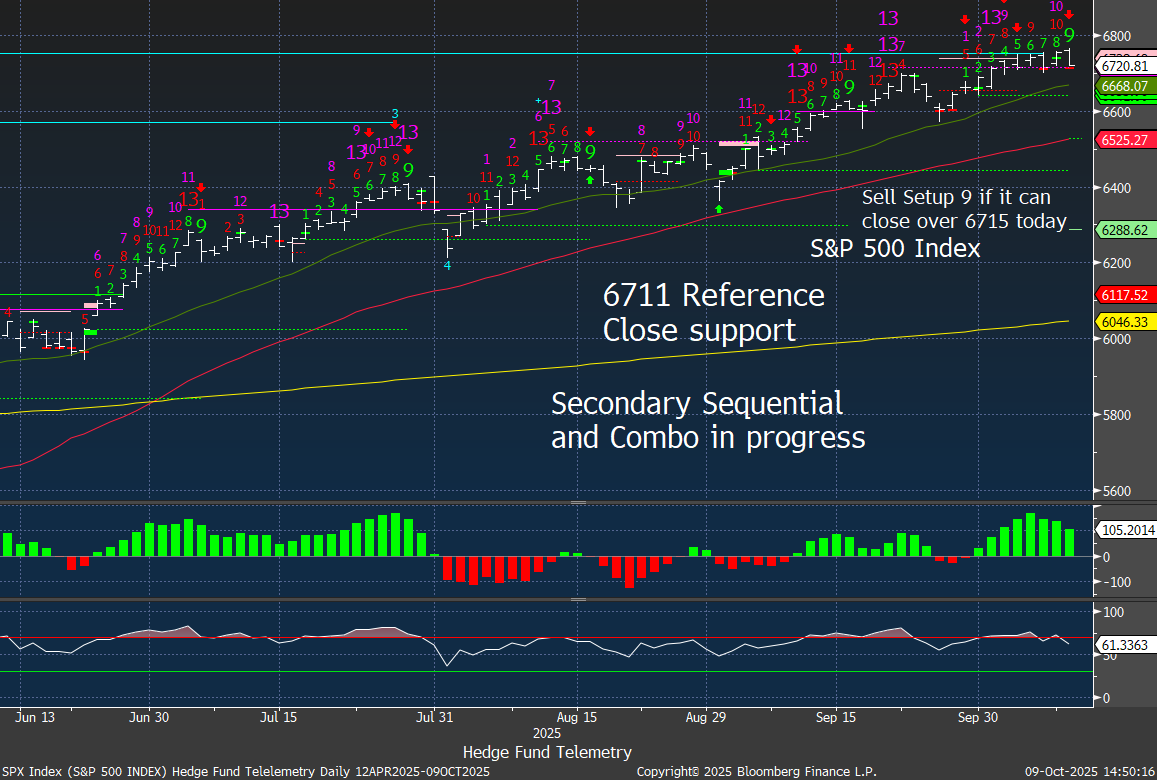
S&P daily is close to a price flip down, canceling the sell Setup 9.
Nasdaq 100 daily should get the sell Setup 9 unless this drops more by the close

Russell 2000 weekly is due for a pullback with new sell Setup 9

weekly charts with Demark exhaustion
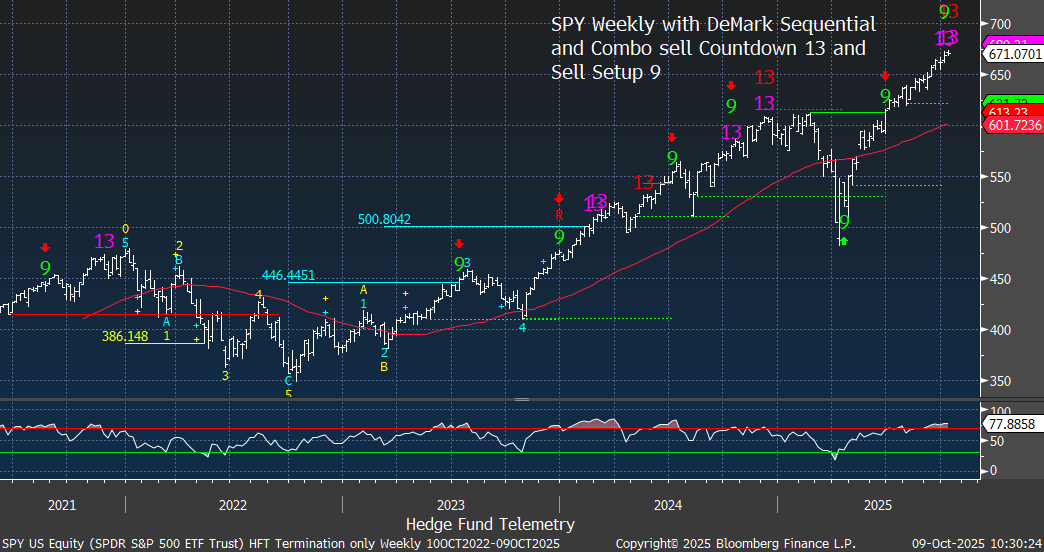
SPY weekly with new Sequential and Combo sell Countdown 13’s. Other 13’s saw corrective action after these signals. The lack of corrective action is concerning and this is a blow-off top.
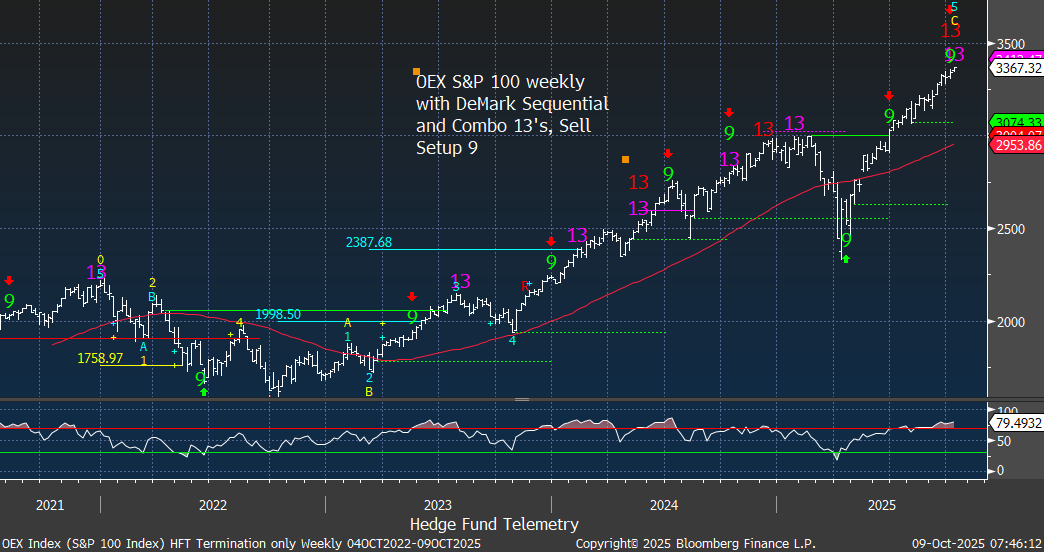
OEX S&P 100 weekly is the meat of the market. New Sequential and Combo sell Countdown 13’s and sell Setup 9. RSI overbought and the lack of any corrective action is concerning. This is a blow-off top.
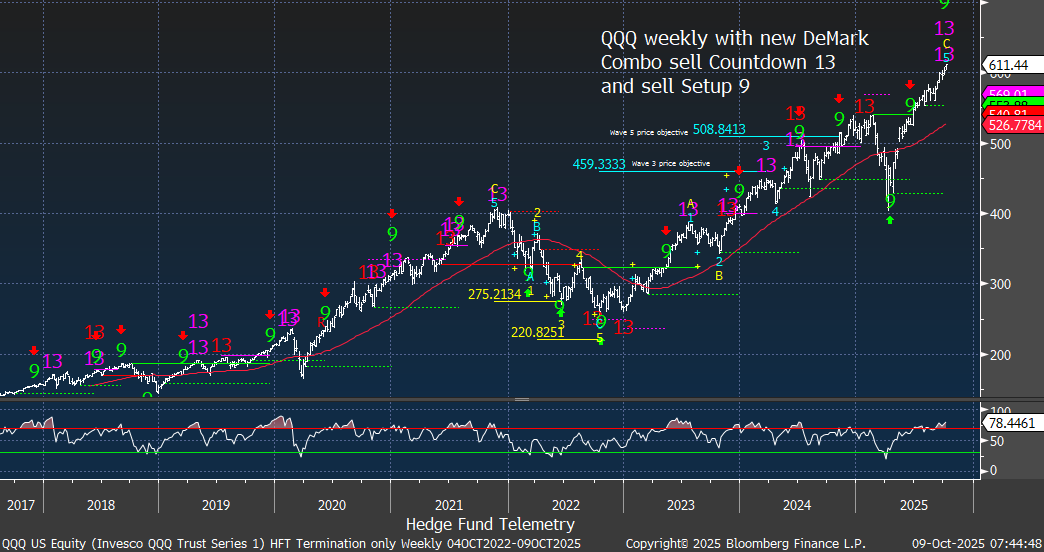
QQQ weekly looks to me like a blow-off top with new Combo 13’s (two versions) and a sell Setup 9. The lack of any corrective action is concerning.
QQQ vs SPY ratio weekly with Sequential and Combo sell 13s. Back in April, tech was oversold with the buy Countdown 13.

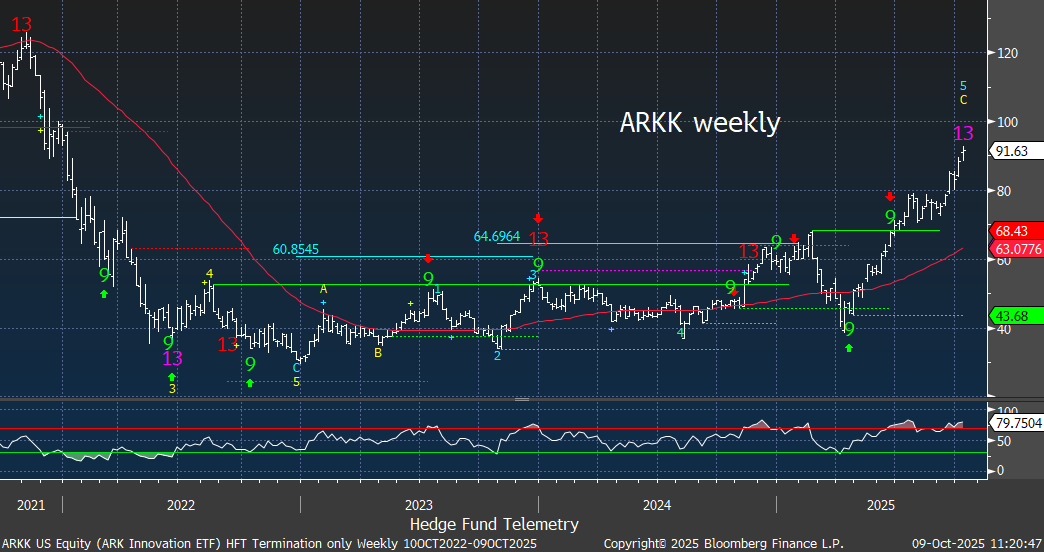
ARKK weekly
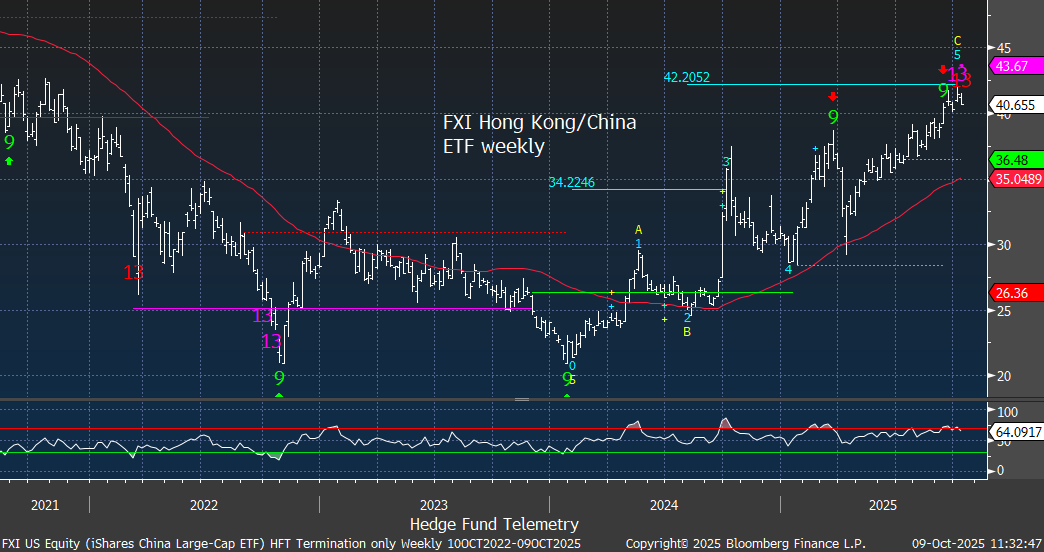
FXI Hong Kong China weekly
Shanghai weekly

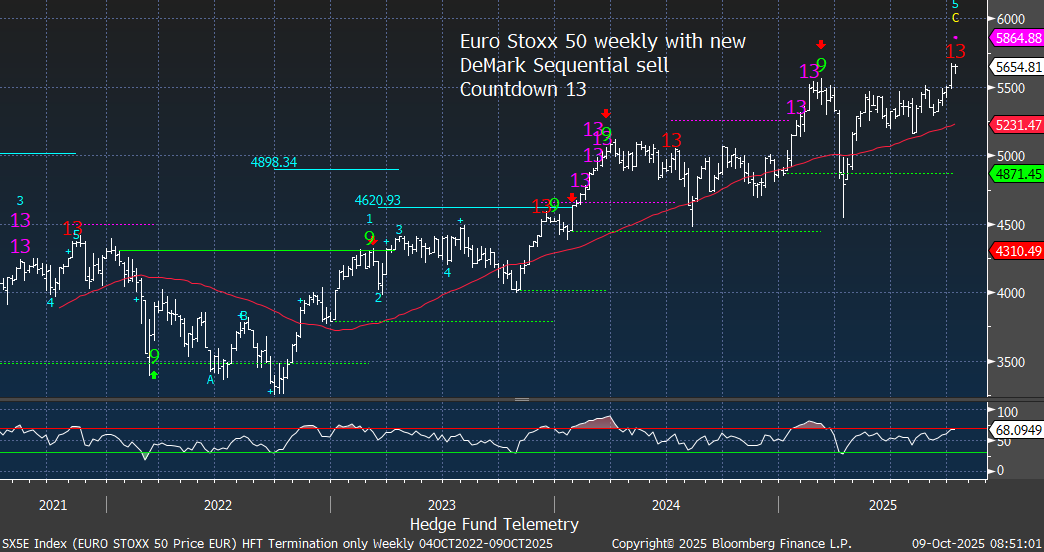
Euro Stoxx 50 weekly
Scary stuff
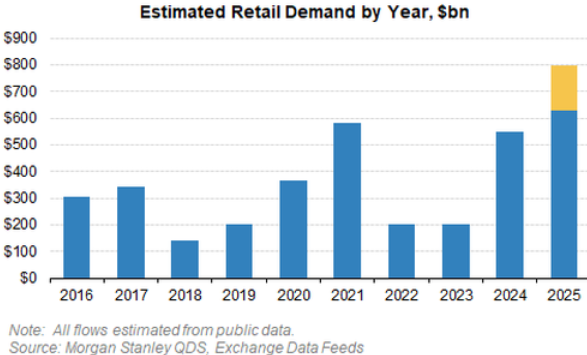
Morgan Stanley posted this, showing $100 billion in retail demand in just the last month. If markets reverse, these buyers could quickly turn into sellers. This isn’t bullish when it’s after the buying has already occurred.
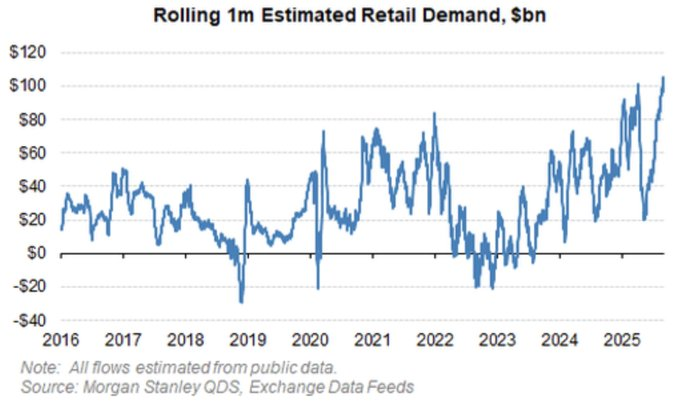
Retail buying was massive in 2020 and even more so in 2021, and I had called this a risk for “future sellers,” which materialized in the following year.
The volume of short-term options trading appears to be a blow-off top in speculation. From Nomura
This one terrifies me. And it should be a concern for those holding these ETFs. If you thought Volmaggedden was bad, this could be even worse with a market dislocation adding significant downside, from Nomura.
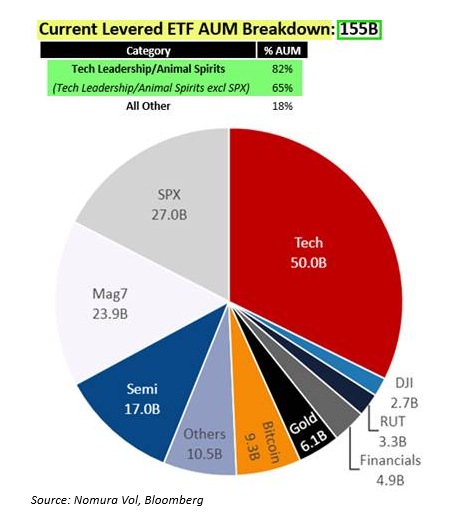
What is the AUM breakdown of levered ETFs? Most are focused in tech, Mag 7, Semi’s. From Nomura
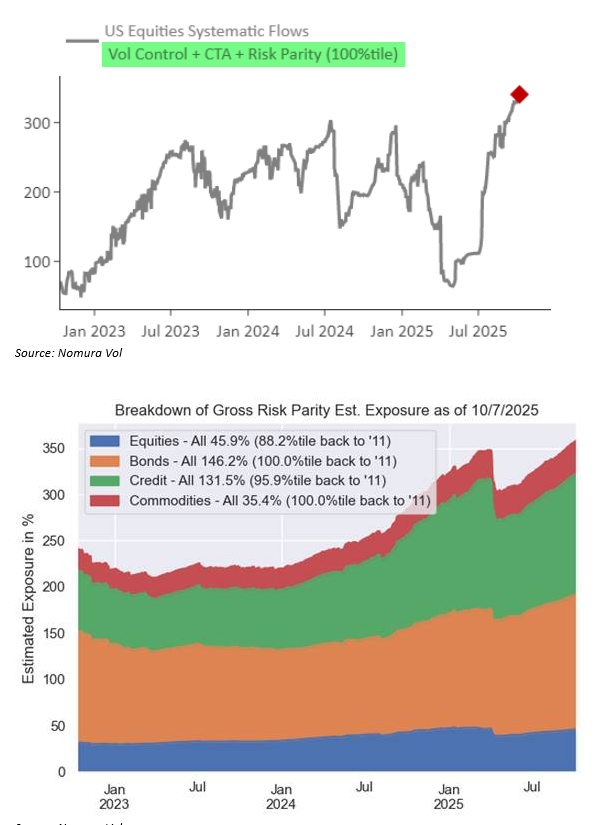
Vol control + CTA +Risk Parity are all in. Risk parity has nearly all the assets above 90th percentile and two at 100th percentile. From Nomura
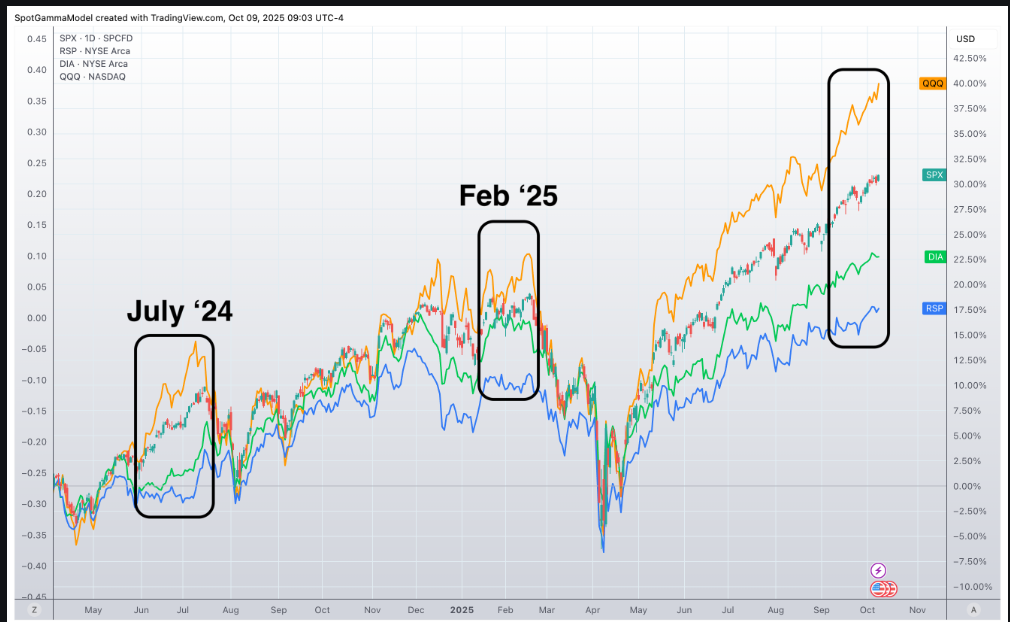
Low correlations with S&P and Nasdaq 100 – see below for more context
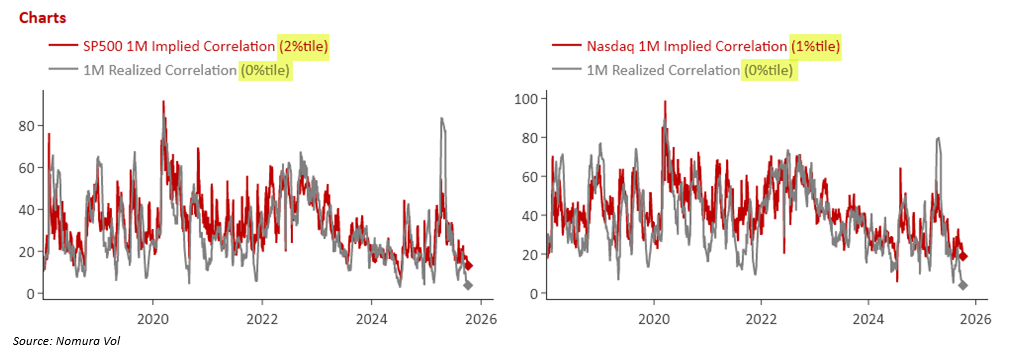
Spotgamma posted this today and it illustrates the low correlation from above. Other occasions when correlation was this low – was high quality risk off signal ahead
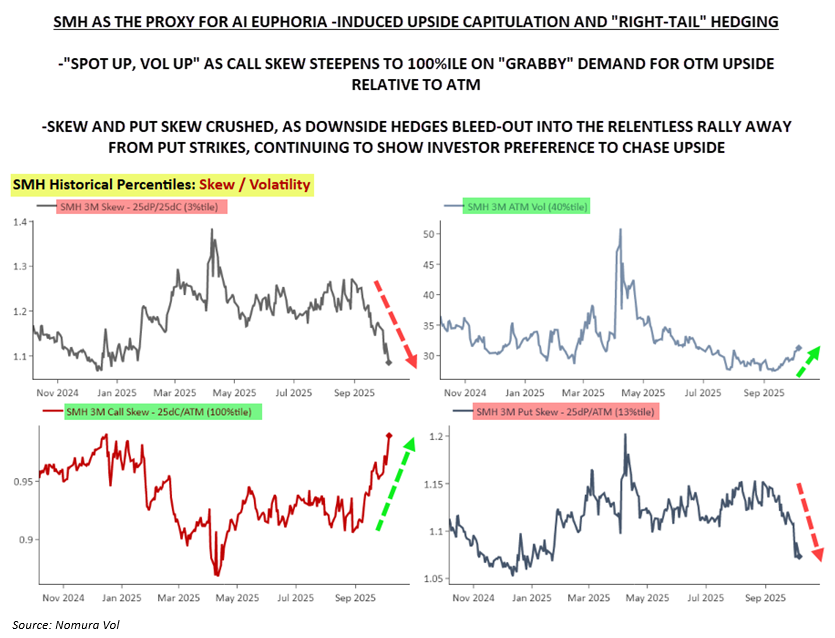
SMH Semiconductors is the proxy for AI Eurphoria. Great chart from Nomura
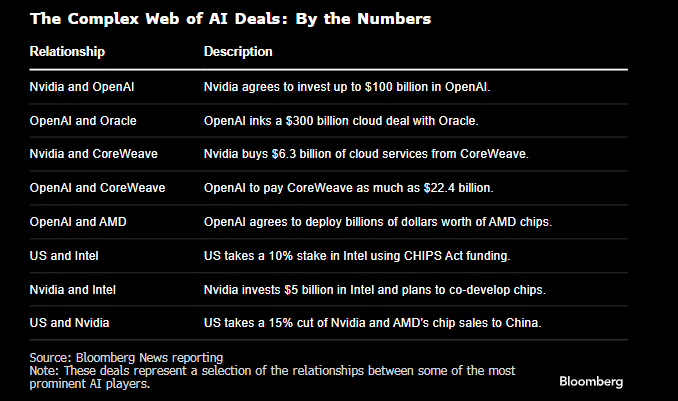
A few AI narratives
A complex web of AI deals.
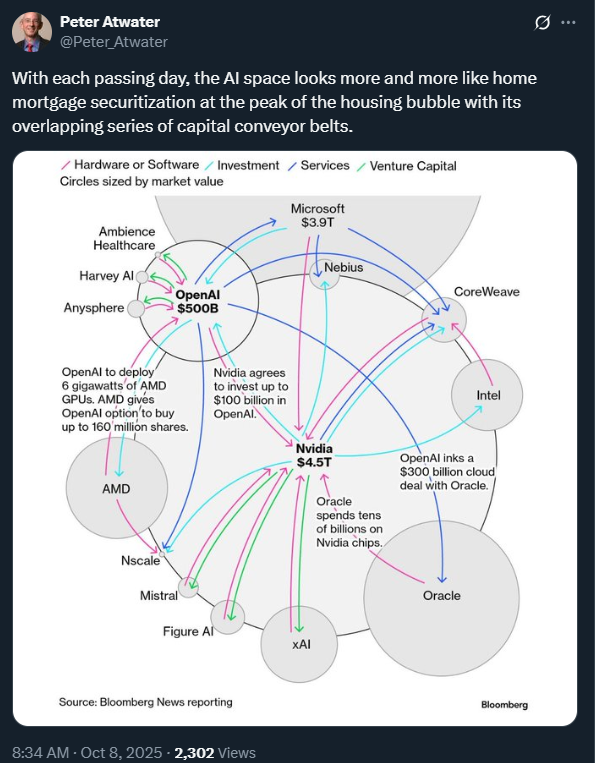
My friend Peter Atwater posted this excellent chart from Bloomberg. A lot has to go right, and nothing wrong, to keep the circle of AI life working as the tech leaders hope.
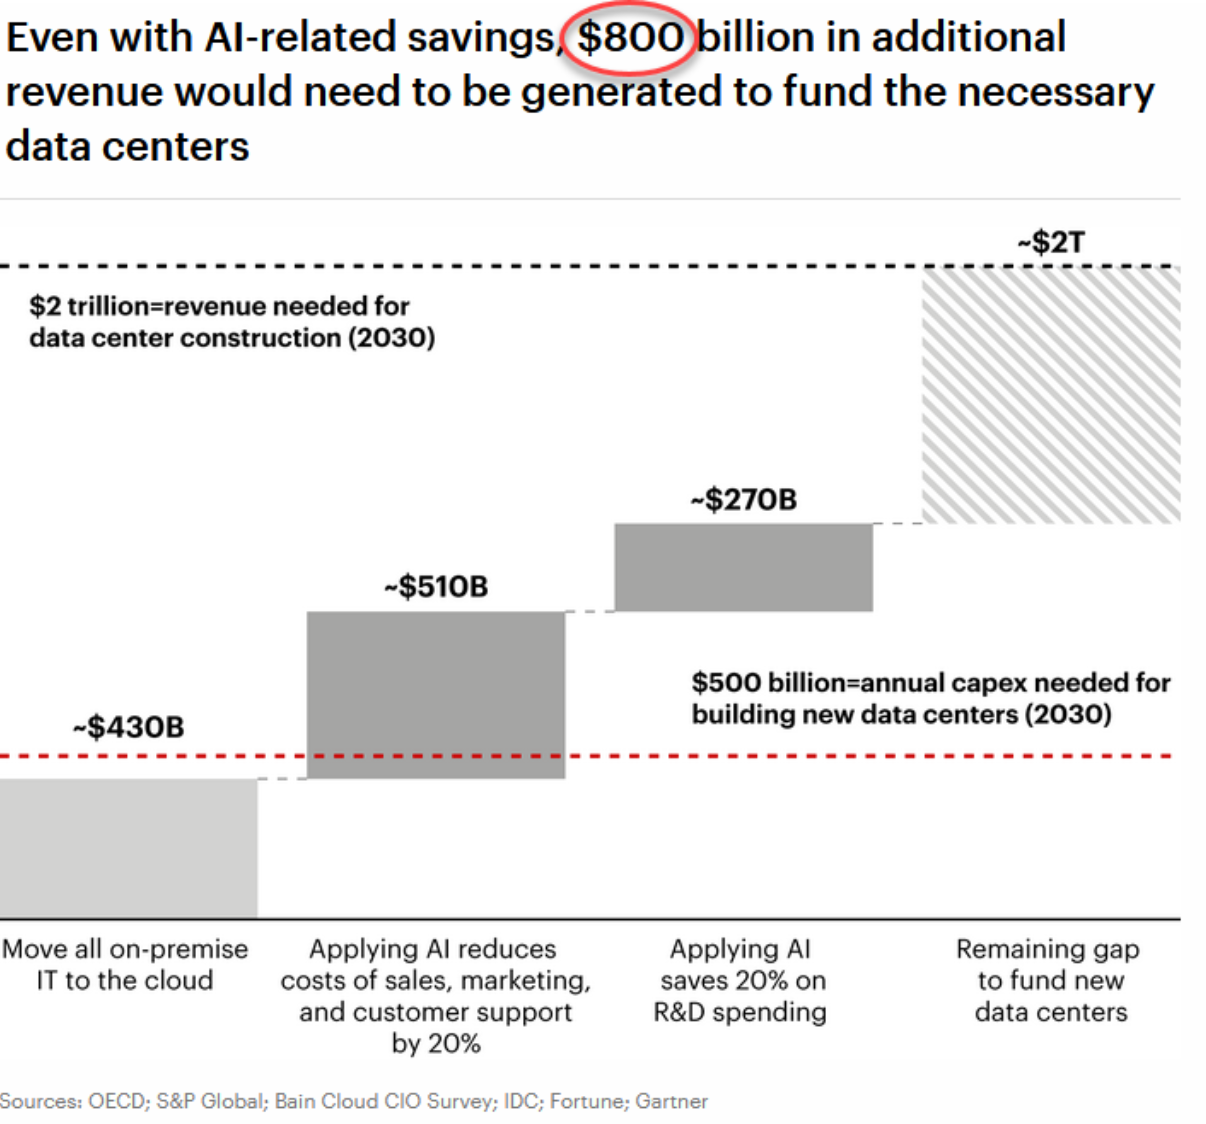
Revenues will have to be substantial to fund the data centers.
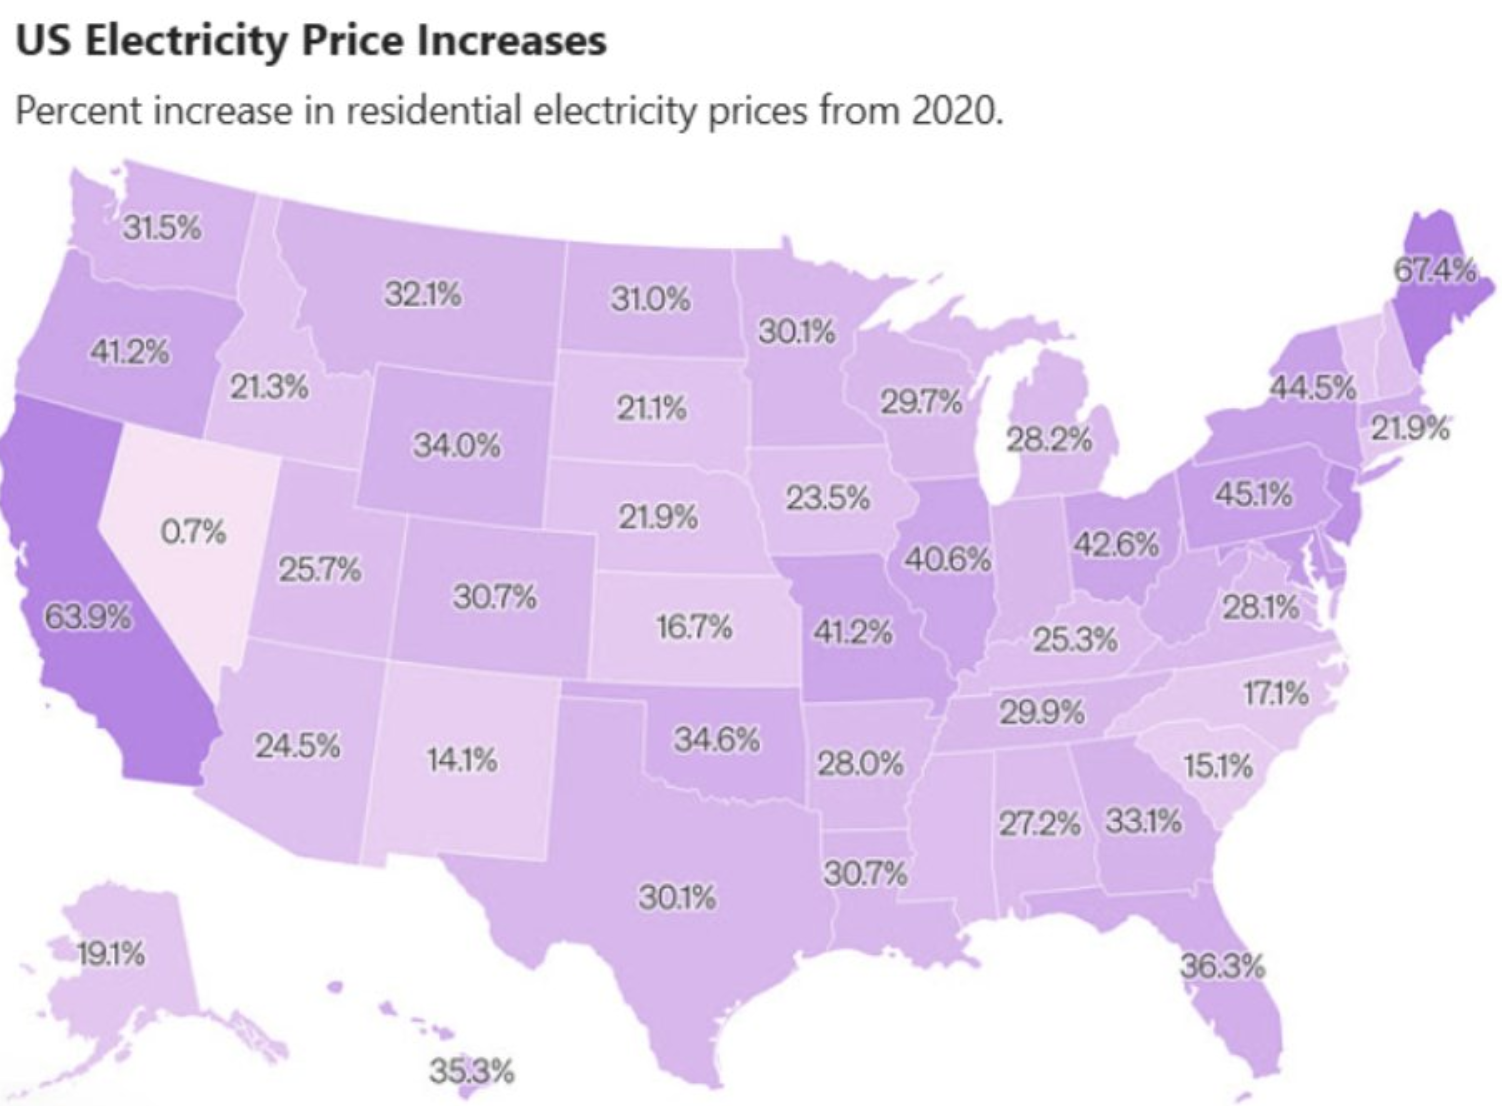
Electricity prices have increased significantly since 2020. And if data centers are going to require a lot of electricity to run, it’s unclear where they get the power, as the DCs will be done before any of the nuclear power plants.
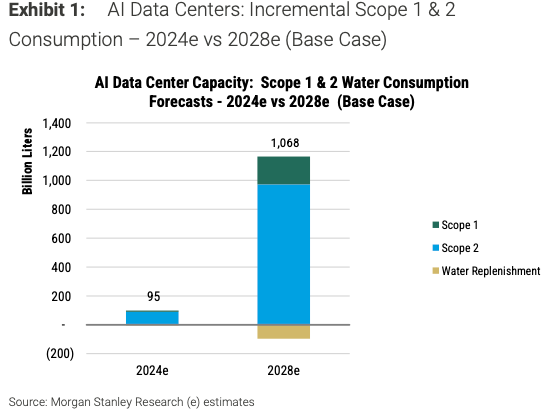
Water is essential for data centers. A lot of it…
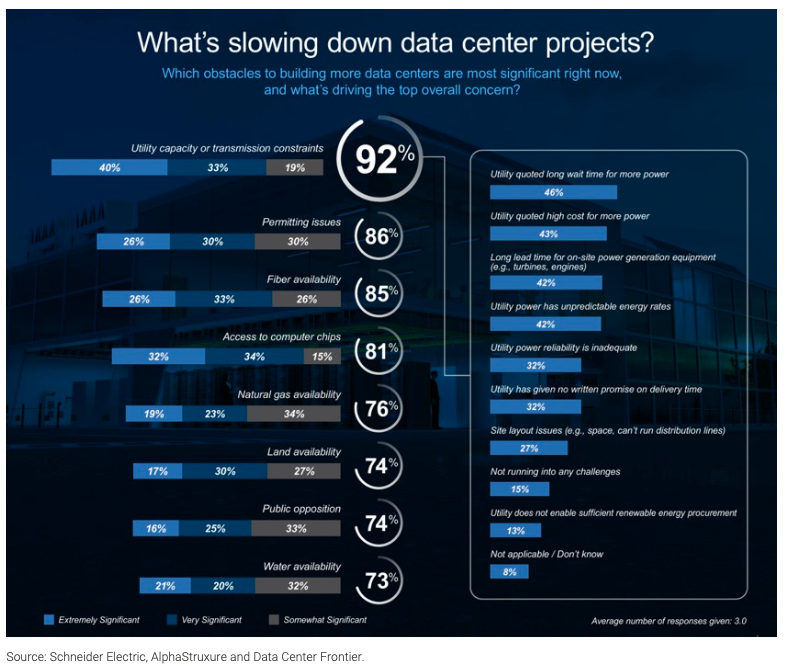
Data center projects face numerous hurdles. MSFT just canceled a project in Wisconsin due to public opposition.
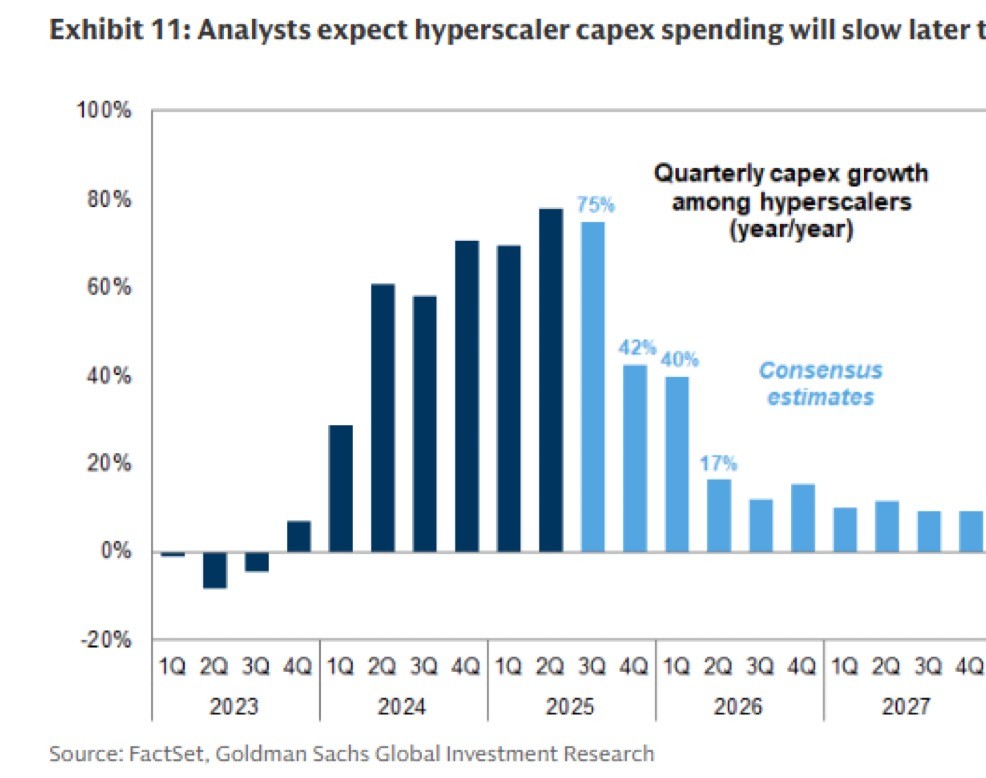
If and when hyperscaler capex peaks and starts to show slower growth, it will be similar to the tech bubble bust when capex was cut by telecom companies.
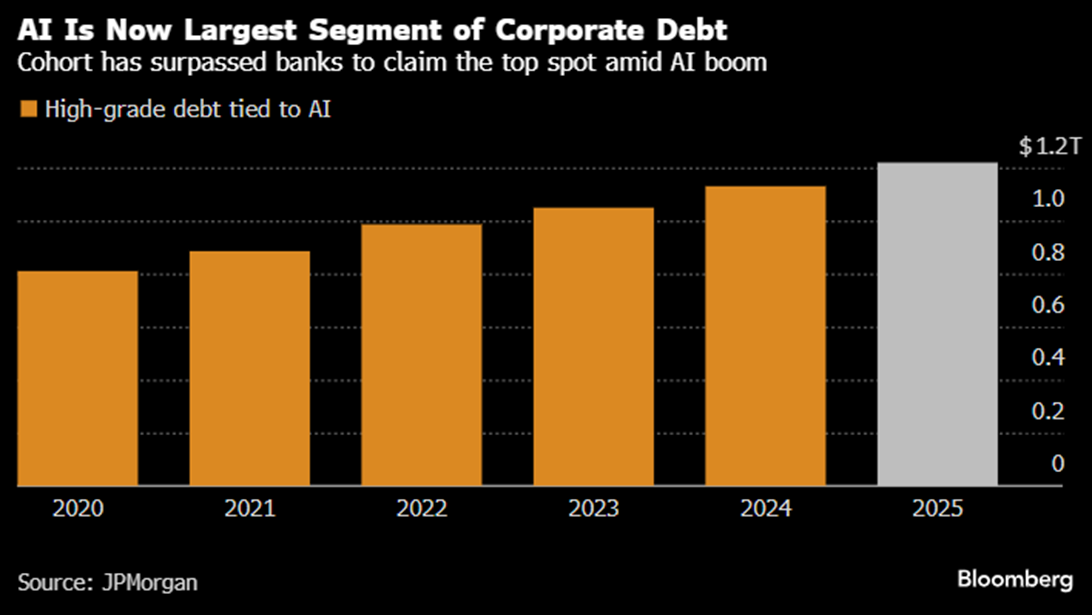
AI is now the largest segment of corporate debt. Again, it’s going to take a lot of revenue to pay for the AI buildout.
Stocks to Watch
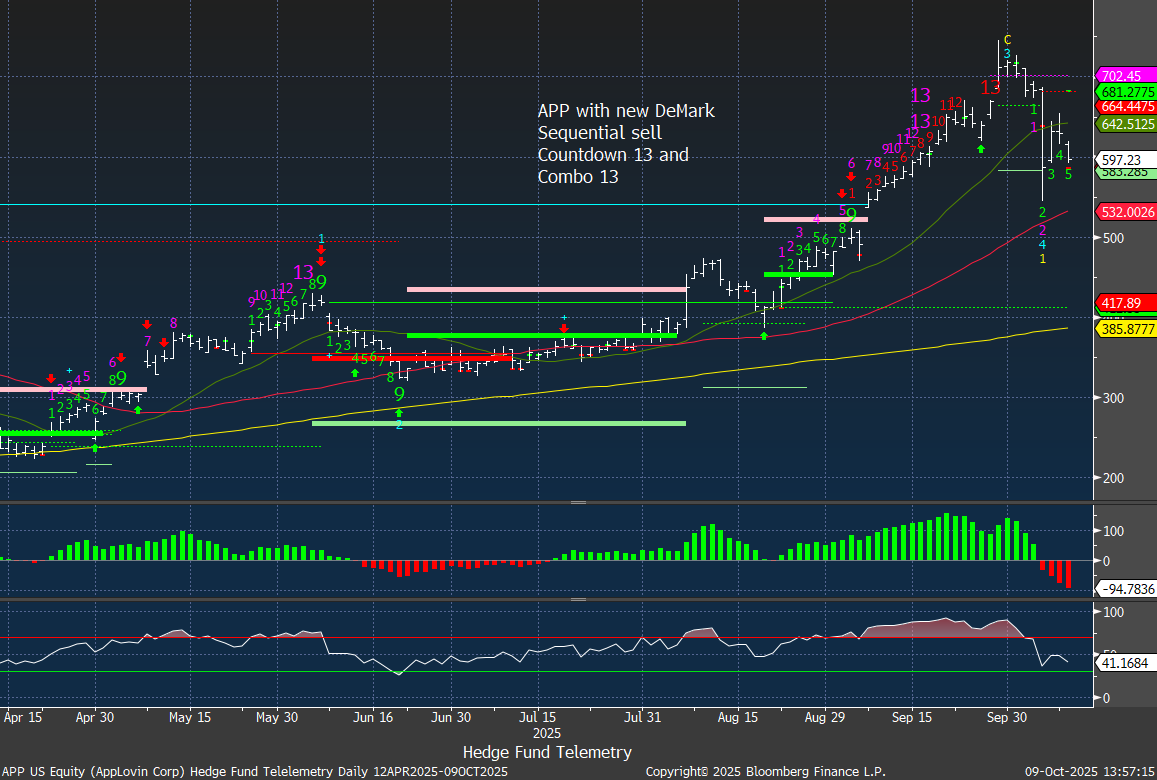
APP App Lovin is on the other side of the blow-off top. The initial spike down on the SEC probe bounced and now back below the VWAP from that day – 617.50
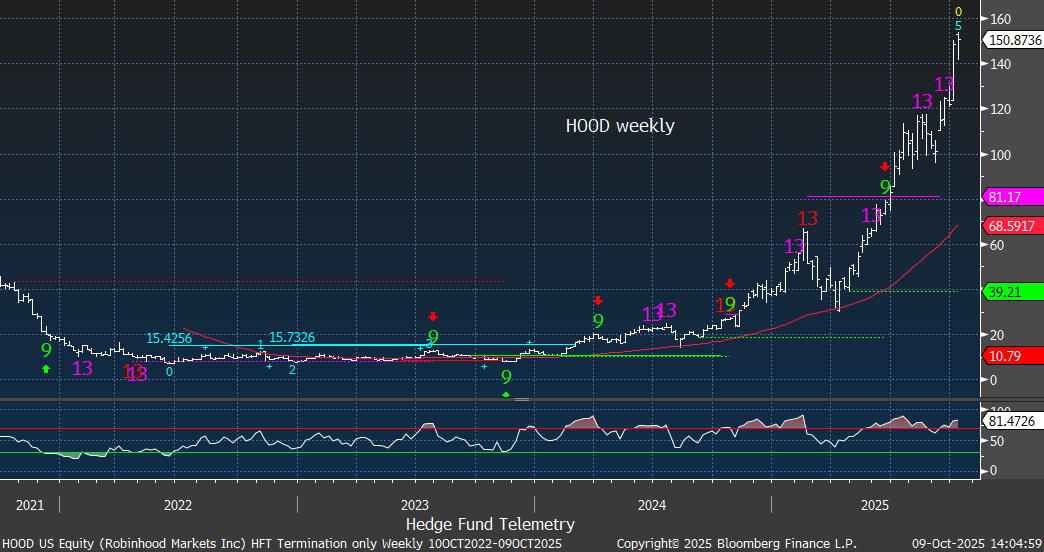
HOOD Robinhood weekly is a blow-off top. Examining the revenue mix is akin to pure speculation. Transaction-based revenue: Options: ~53% of Q2-2025 (≈ $256M). Crypto: ~33% (≈ $160M). Equities: ~14% (≈ $66M). The most actively traded options and stocks are TSLA, NVDA, AAPL, AMZN, PLTR, and HOOD.
NVDA daily with strict version Combo 13. So much is riding on this one. A break of the 50 day at 179 likely would bring out sellers.

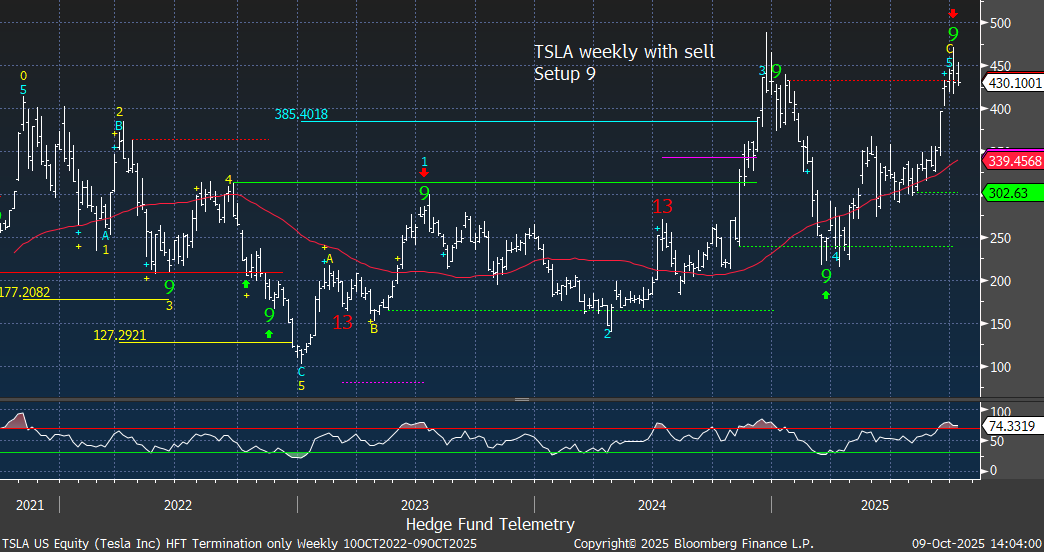
TSLA with possible double top with another sell Setup 9. Breaking 400 and Elon’s recent cost basis ~390 should be watched.
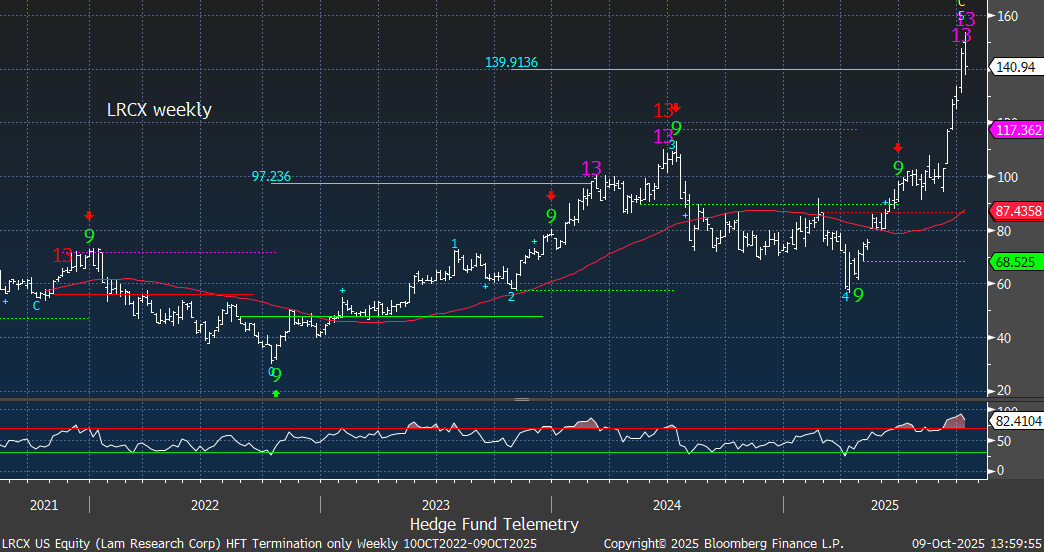
LRCX weekly crazy blow off top
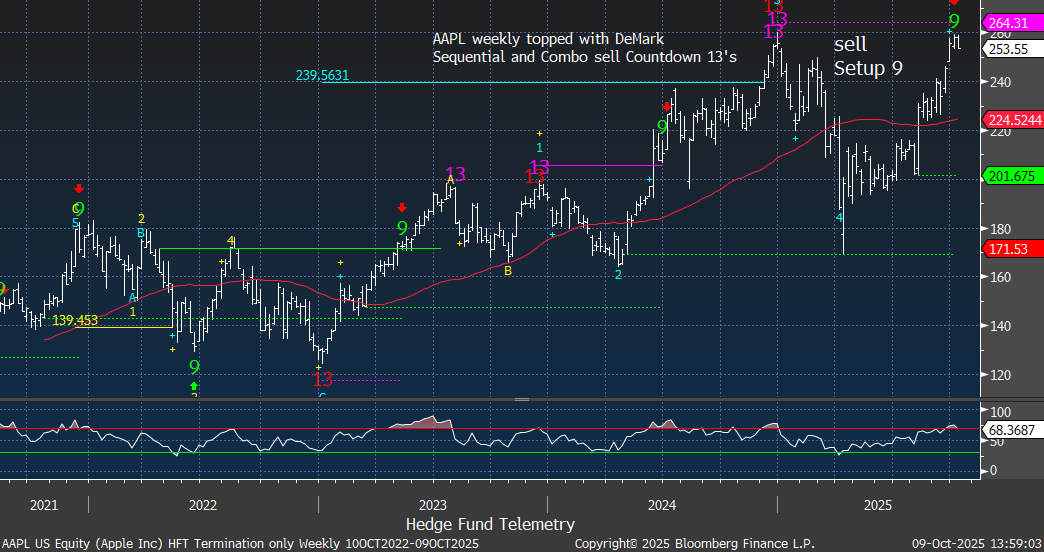
AAPL with a weekly double top
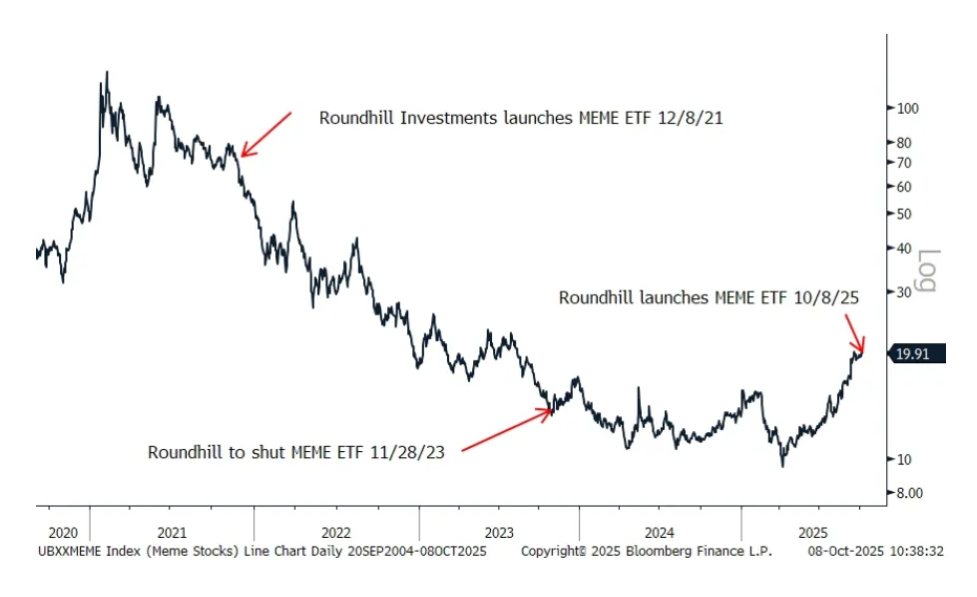
Just in time! The Roundhill MEME ETF is back! Take this as a sentiment check.
FACTORS, GOLDMAN SACHS SHORT BASKETS AND PPO MONITOR UPDATE
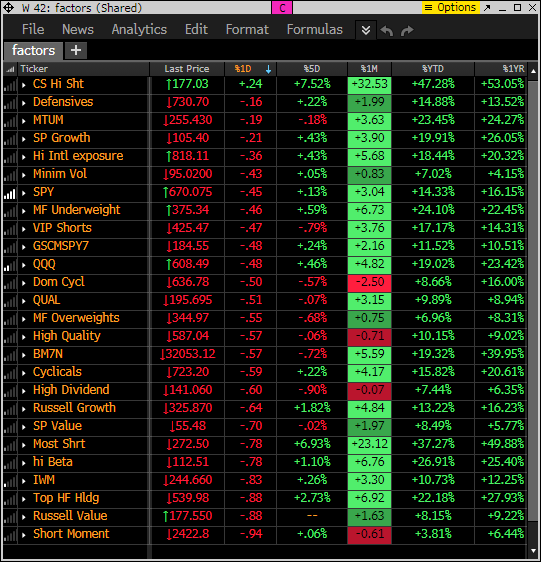
Factor monitor
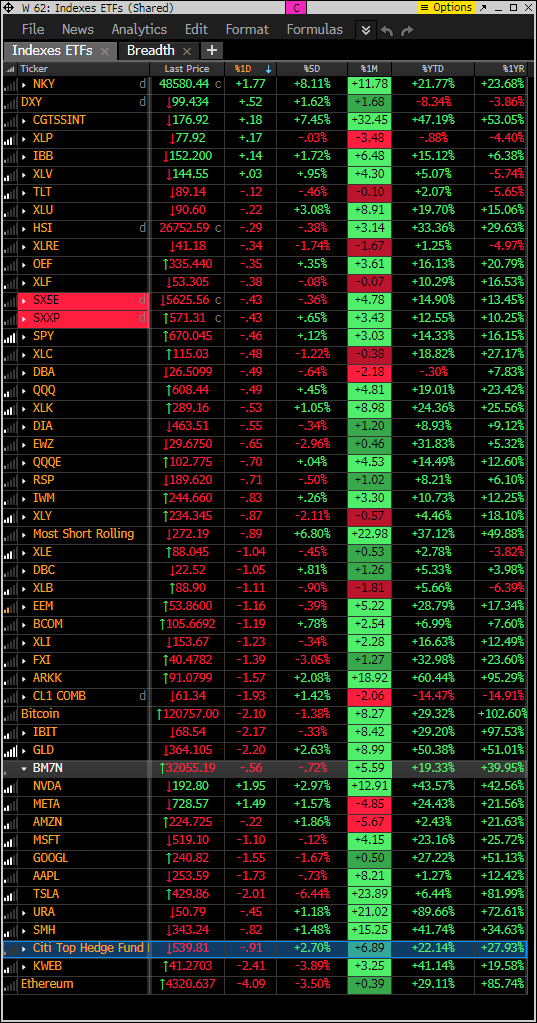
This is similar to the above monitor with various ETFs other indexes
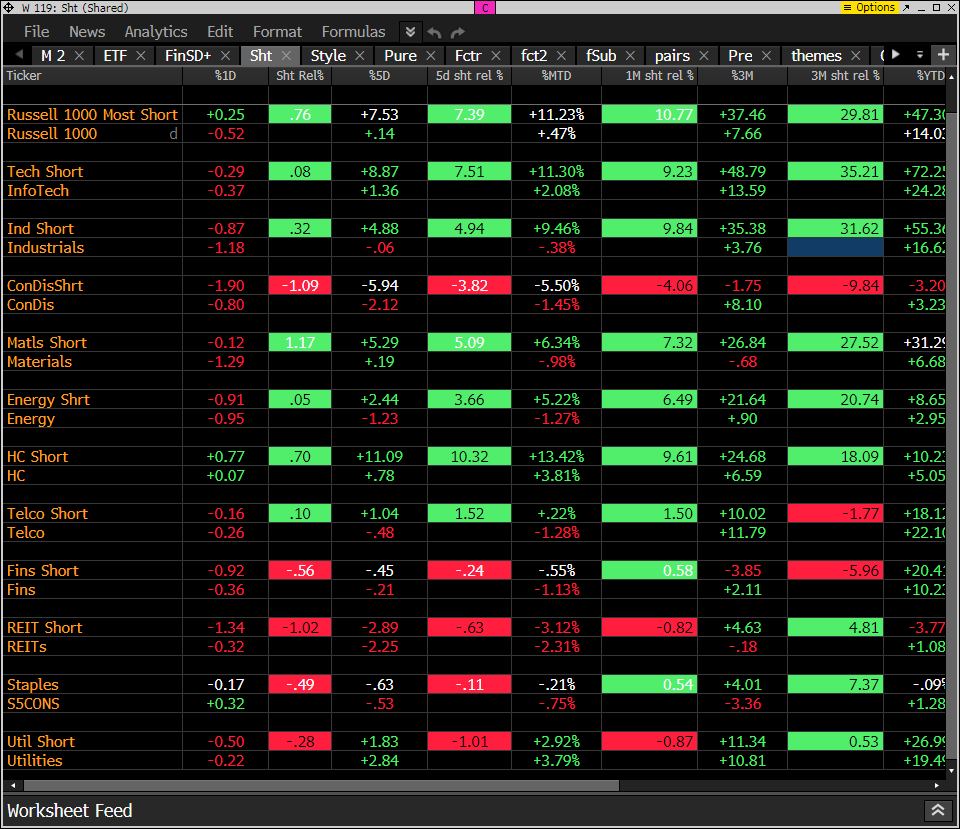
This is the monitor that has the S&P indexes and the Goldman Sachs most shorted baskets. Today the short baskets are mostly lower ex HC. Tech is fairly muted as well.
The PPO monitor (percentage price oscillator) force ranks ETF’s by percentage above/below the 50 day moving average. For information on this monitor please refer to this primer. This monitor is offered to Hedge Fund Telemetry subscribers who are on Bloomberg. Notable: Seeing heavy selling on the top half of the monitor with what has worked and is most overbought

DeMark Observations
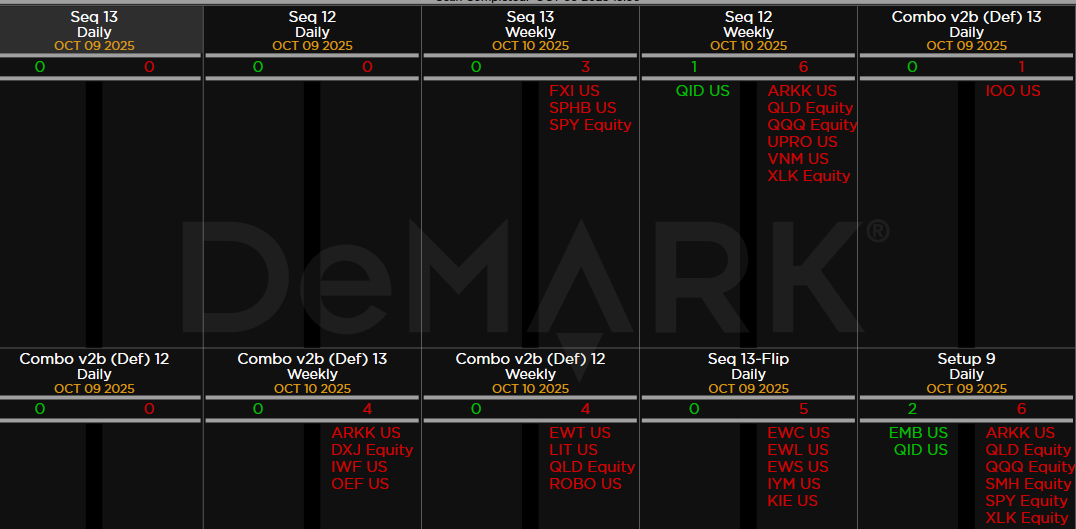
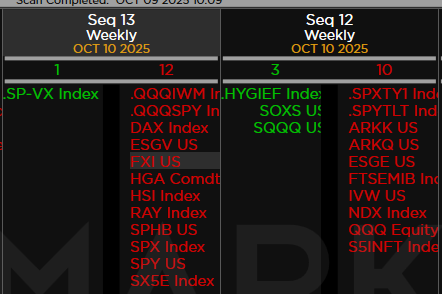
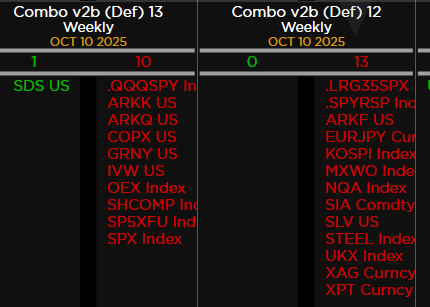
This is the weekly Sequential and Combo 13’s and on deck 12/13s. Some significant indexes, commodities, and ETFs
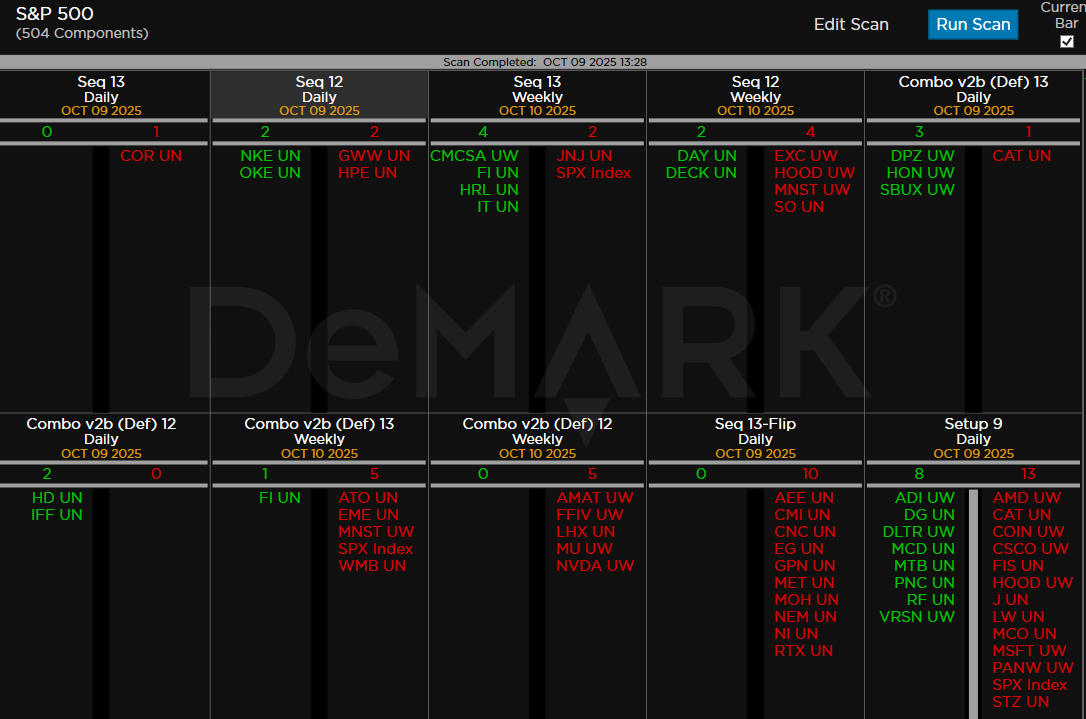
S&P with decent number of sell Setup 9’s and buy Setup 9’s. What has worked and what hasn’t.
Major ETFs