
I often hear, “DeMark Indicators don’t work.” This, oddly enough, is right when they do start to work. It’s usually from people who lack access to the indicators or knowledge of how they work. They don’t always work and, at times, don’t provide pullbacks or bounces sufficient to satisfy the kids’ thirst for glory. No indicators work all the time, and when they don’t, it’s also a sign of the power of the current trend. This is why I utilize a variety of indicators, ranging from sentiment and internals, to enhance the process. I mentioned how I use the weekly time frames at times like this, with the daily time frame again doesn’t give people what they expect. With that being said, there are important weekly signals that have worked well in the past at intermediate time frame inflection points. I ran some historical charts of the S&P and Nasdaq Composite at other periods when I recall hearing “they don’t work.” An earnings preview for Dow reporting tomorrow – a do-nothing.
Quick Market Views
Stocks: Nasty action today with a risk off tone shifting people into defensive sectors. Short baskets are getting hit hard as shorts could be absent and those long these speculative names are discovering air pockets with shorts not there to cover. Breadth is mixed but weak. NYSE with 950 down issues and Nasdaq down 1970 issues. Mag 7 is down 0.8%
Bonds: Rates are down 1-2bps – hardly a big risk off move to bonds.
Commodities: Crude is up 3.7%, Natural Gas down 0.2%, Copper up 0.9%, Gold little changed, Silver up 0.85%.
Currencies: US Dollar index is little changed. As is Bitcoin down 0.1%
Current Portfolio Ideas:
Changes: I like to see stocks that I am short up into reports but a few are down into reports thus might bounce. I will cover 2/3 of the 3% weighted LRCX short and will leave 1%. I will add more after either up or down. Locking in 4.5%. I’ll hold Tesla despite my view that it will probably be pumped up on the call after strong but unsustainable earnings. I discussed it yesterday. I looked at Tesla options and like the October 31st expiration 420/370 put spread for ~$10-11.00. Again if you don’t like risk stay away from this shitshow of a company.
US INDEXES – historical perspective
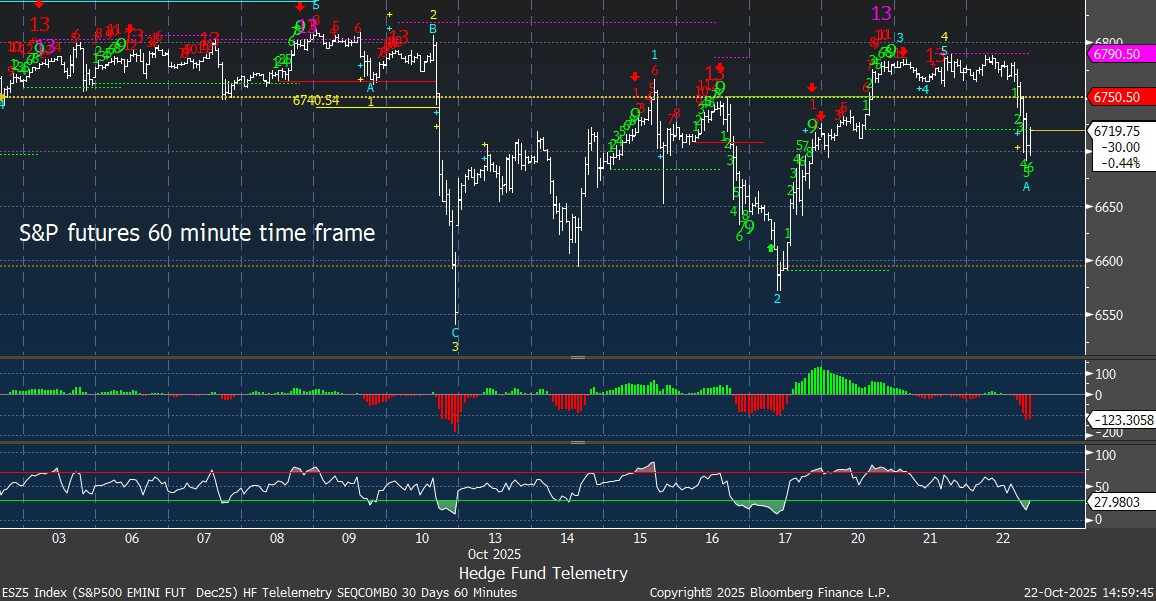
S&P futures 60-minute tactical time frame with recent top with Combo and Sequential 13’s. It’s right at the TDST support green dotted line support now.
S&P 500 Index daily with a new Sequential sell Countdown 13 from yesterday. One of the unique and rare aspects of this upside move is that, typically, with daily 13’s, a move to or below the 50-day (red line) occurs. The recent low did not exactly hit the 50 day but it was close. The next time tested might go right through it.

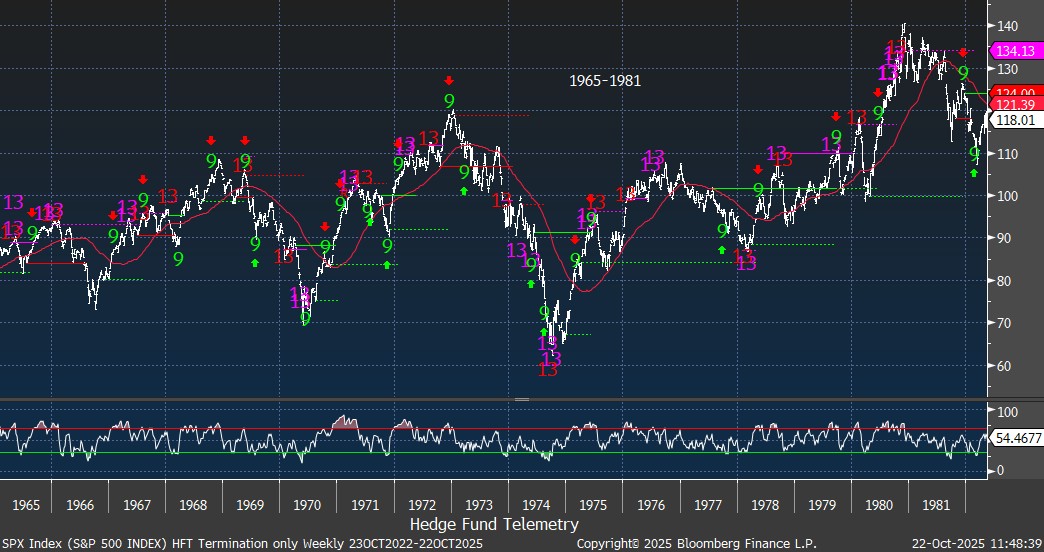
One of the nice things about the DeMark indicators is that you can go back in history and see how the indicators worked at different times. Here are a few times to note – 1965-1981 S&P weekly time frame chart. I can do more but I think you’ll get the point.
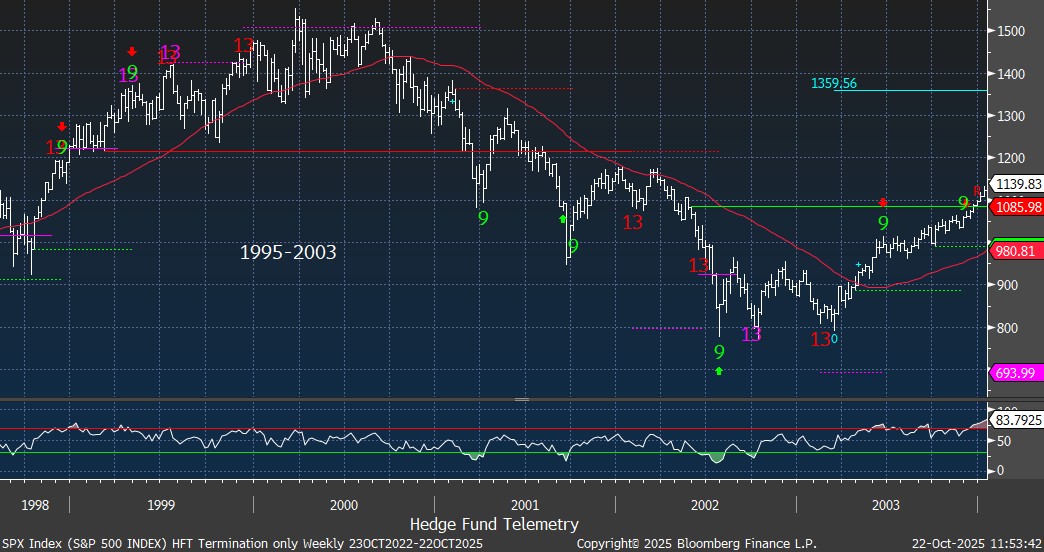
This is the weekly with the S&P in 1998-2003.
This is the period between 2011 to 2019. The lows in 2012 marked the start of QE with 13’s having small pullbacks until 2015 when it took a year off before new gains. The buy Setup 9 in February 2016 was a big inflection point. In late 2017 there were several signals into January 2018 when there was a sharp 10% volmagedden drop.

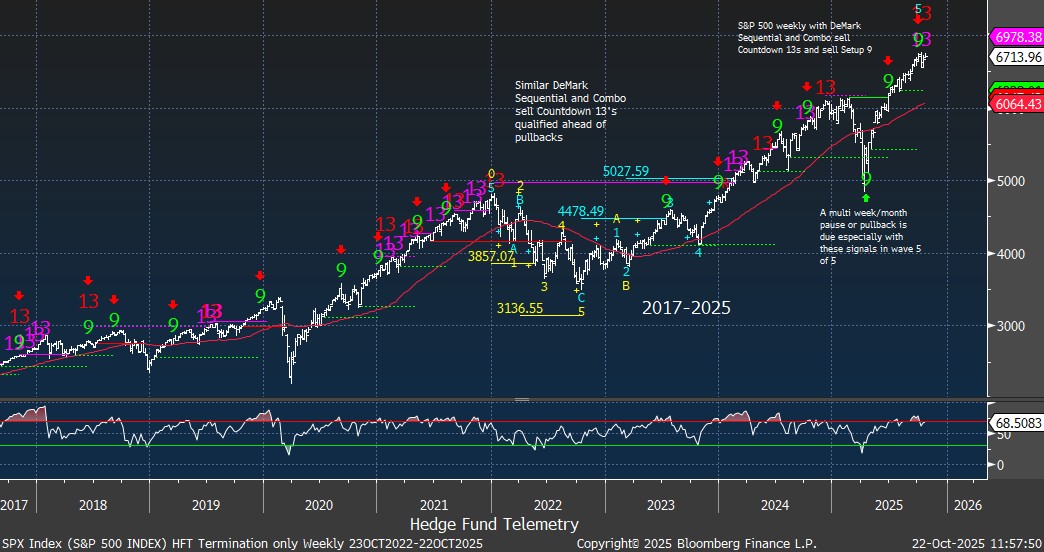
2021 was also a strong period with excessive Fed stimulus that saw minor pullbacks along the way until 2022 when things broke down for 18 months before hitting a new high. 2024 also saw some pullbacks after 13’s and 9’s with a Sequential 13 in December that nearly marked the top. The buy Setup 9 in April was a good signal. Now there are new 13’s and a sell Setup 9.
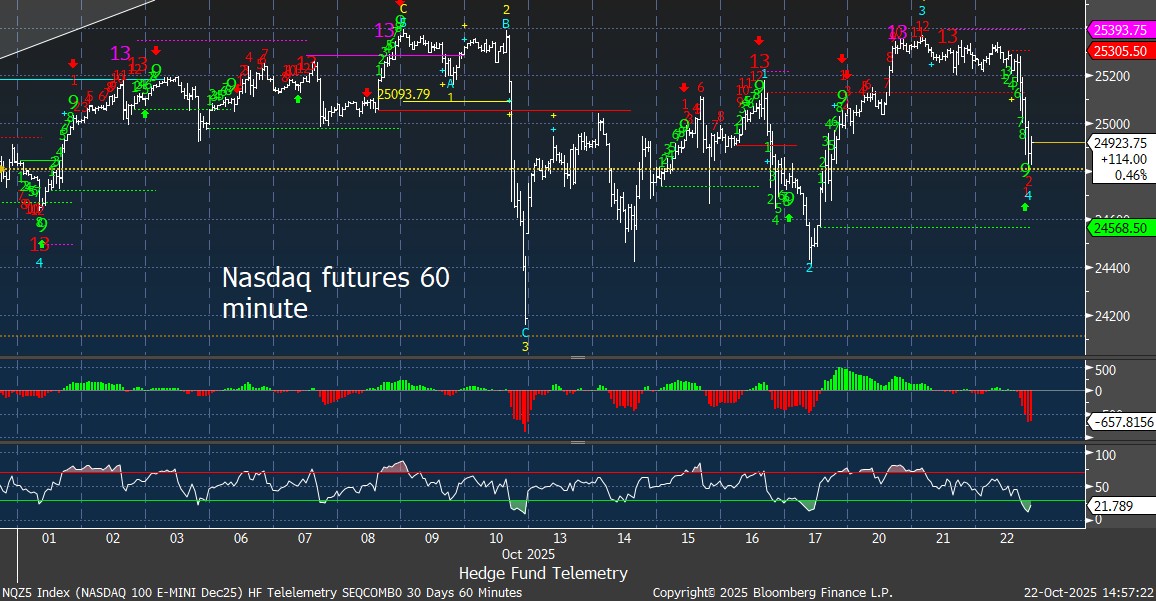
Nasdaq 100 futures 60-minute tactical time frame with strong reversal down today but still above the TDST Setup Trend with new Setup 9. A continuation lower will trigger a downside Sequential Countdown starting.
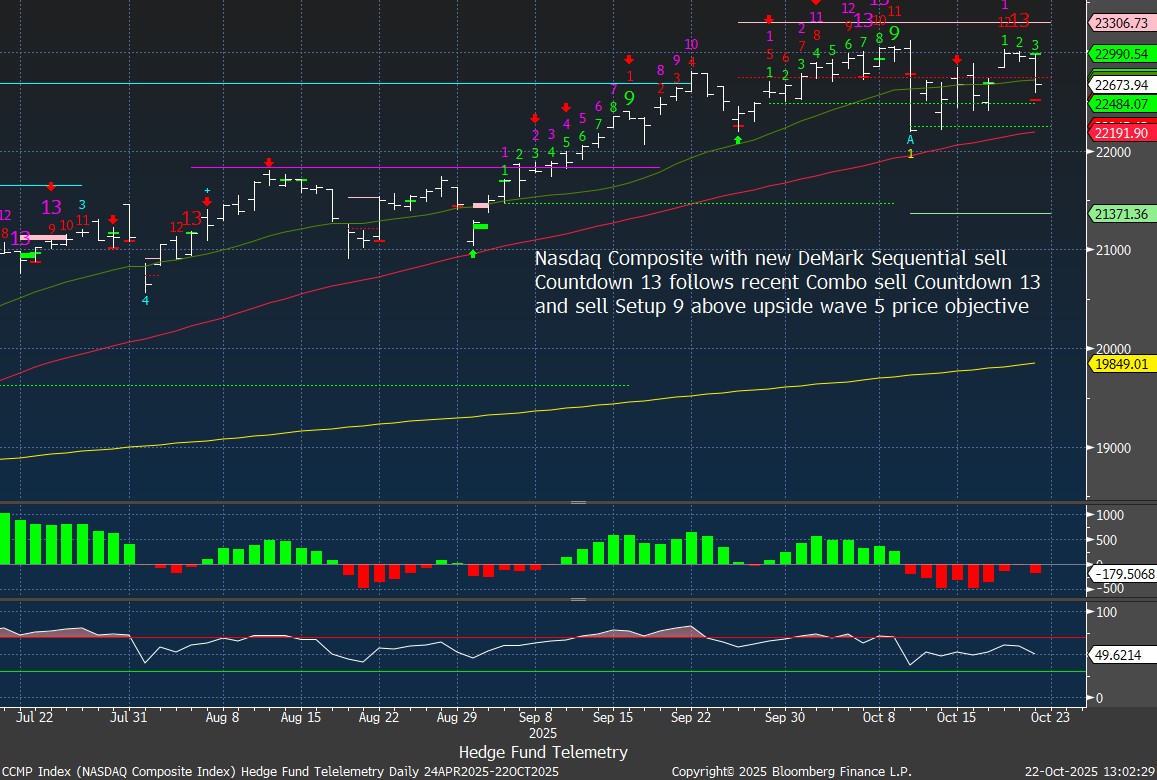
Nasdaq Composite daily with Sequential sell Countdown 13 yesterday
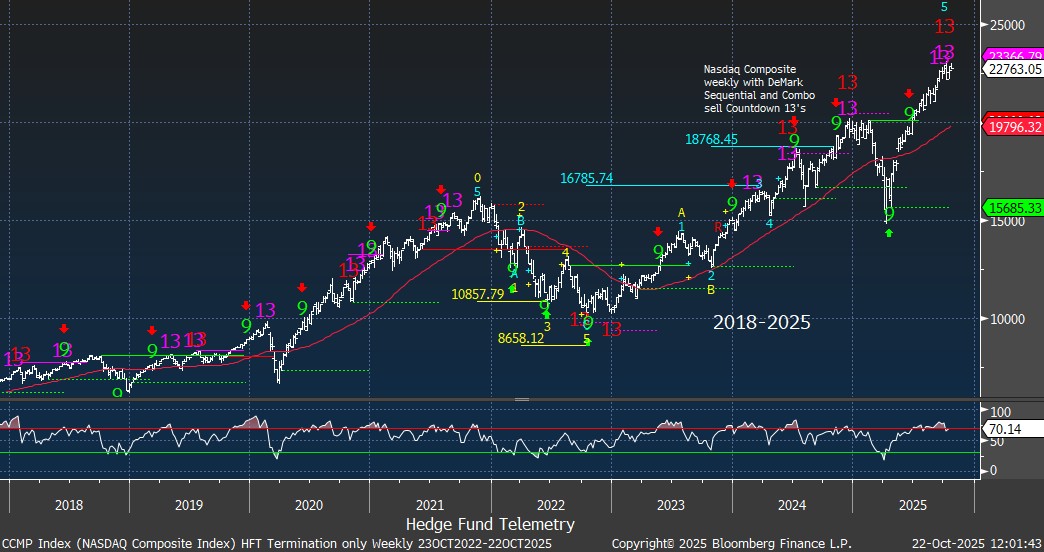
This is the Nasdaq Composite weekly chart from 2018-2025. Sequential and Combo 13’s along with Setup 9 have been pretty decent at spotting inflection points on both upside and downside.
Nasdaq Composite weekly time frame before and after the GFC. 2007 was tricky as Cramer’s Four Horsemen of Tech – AAPL, RIMM (now Blackberry) GOOGL, and AMZN led the index higher with very narrow attribution not so far from the attribution seen today with the Mag 7. Decent inflection points with both 13’s and 9’s along the way.
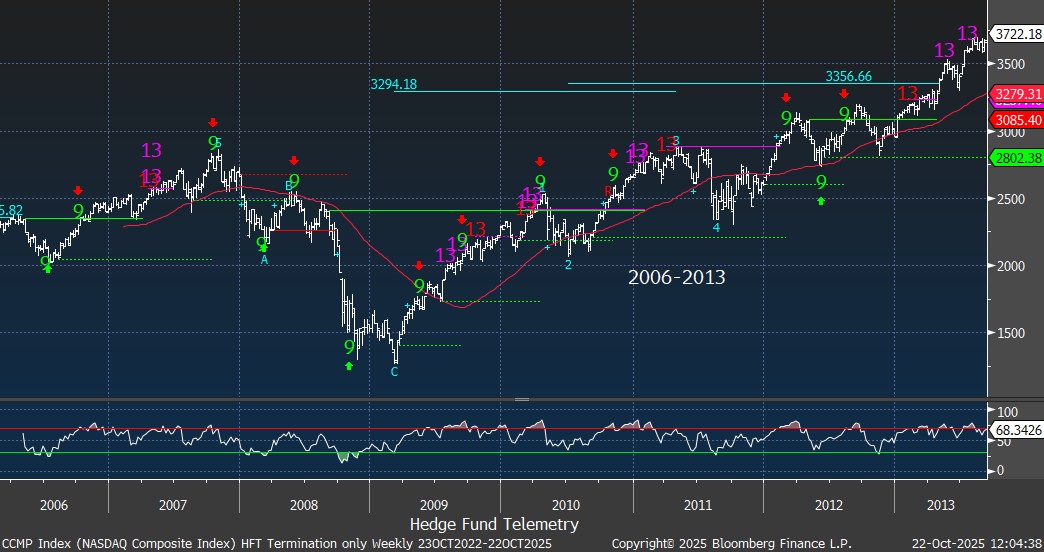
This is the Nasdaq Composite with daily time frame and had good signals at the top in 2007 with bounces and ultimately lows in 2008/2009. Several other pullbacks sell signals and buy signals worked well.

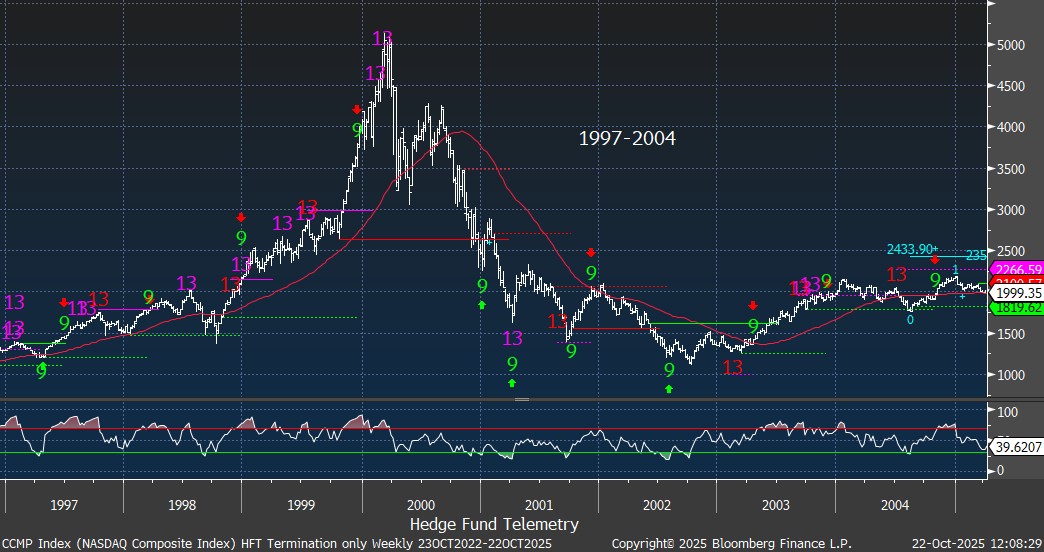
But I get a lot of questions on the Tech bubble period in 1999 and this is the Nasdaq Composite weekly chart. The last move up was primarily with the Fed injecting liquidity combined with the surge in tech spending due to Y2K fears of everyone’s computer systems failing. This created a huge pull forward in tech demand with Combo 13’s (two versions) at the highs. Other 13’s and 9’s worked well along the way too.
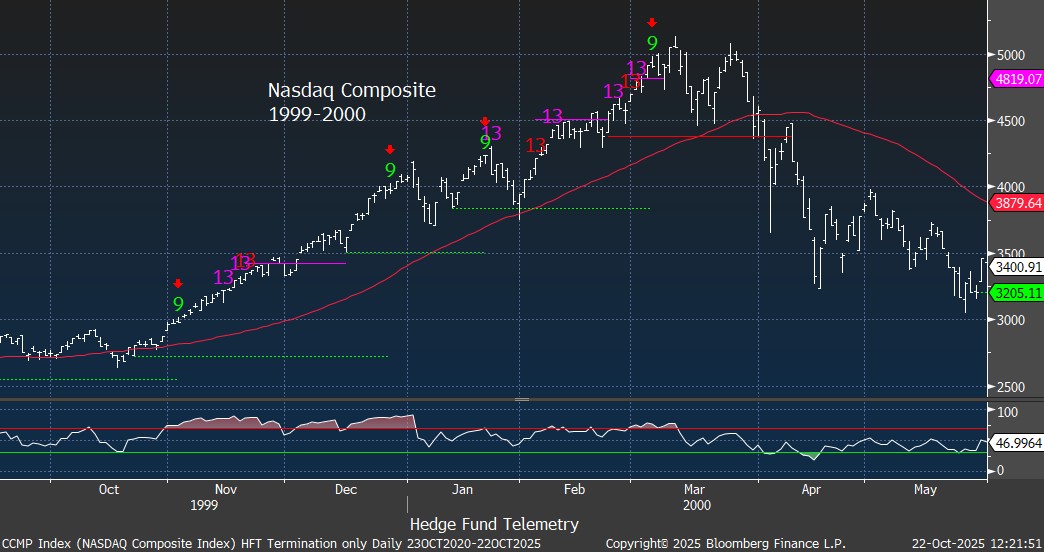
Finally, “DeMark signals don’t work” is usually what I hear right before they work. This is the daily chart of the Nasdaq Composite that had several signals that failed or stalled out briefly. This is why I have utilized the weekly time frame charts that when all are synced up together an inflection point in the near term is near.
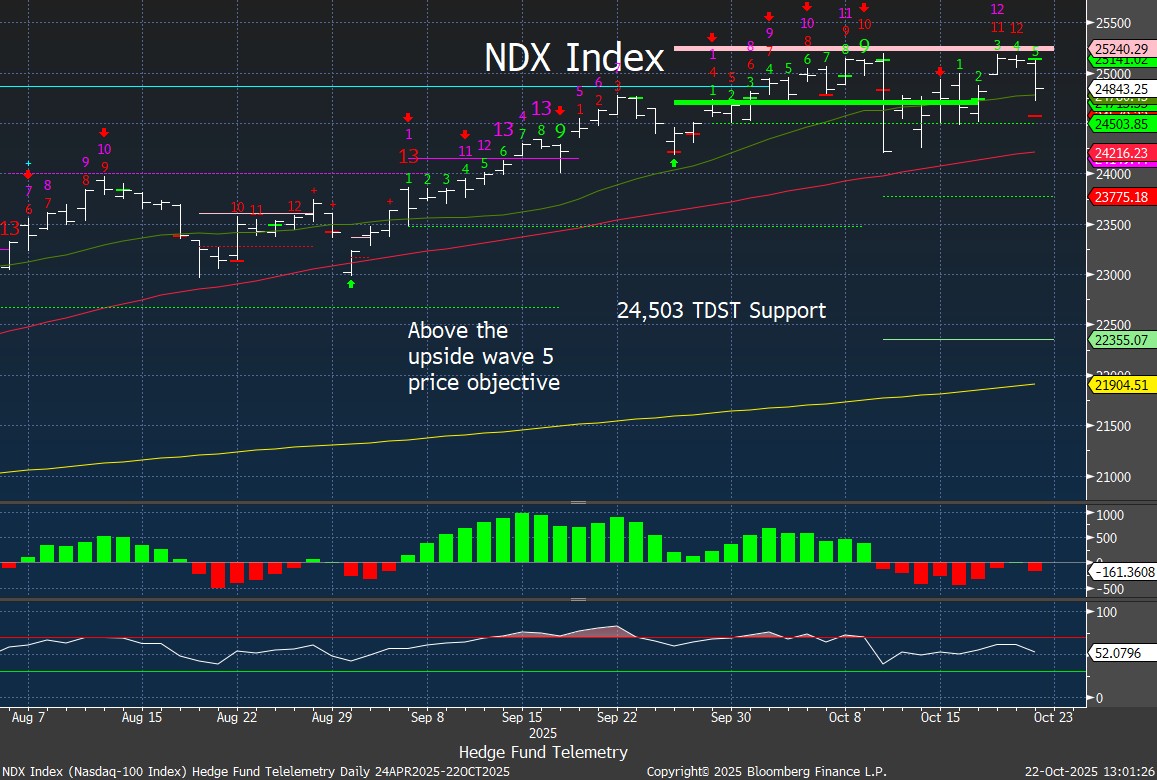
Nasdaq 100 Index daily has moved sideways with the Sequential pending on day 12 of 13. I wouldn’t rule out one more upside pop. Breaking the TDST Setup Trend support is first step then 50 day at 24,216
Short baskets as a market top indicator
When short baskets are moving up it’s a sign of shorts covering but it’s also a measure of speculation as longs and speculators have been buying some garbage like names. I know one man’s garbage is one man’s treasure! Both daily and weekly 13’s. These were also a tell on the downside as shorts were a little too confident pressing the lows with 9’s and 13s on the downside.
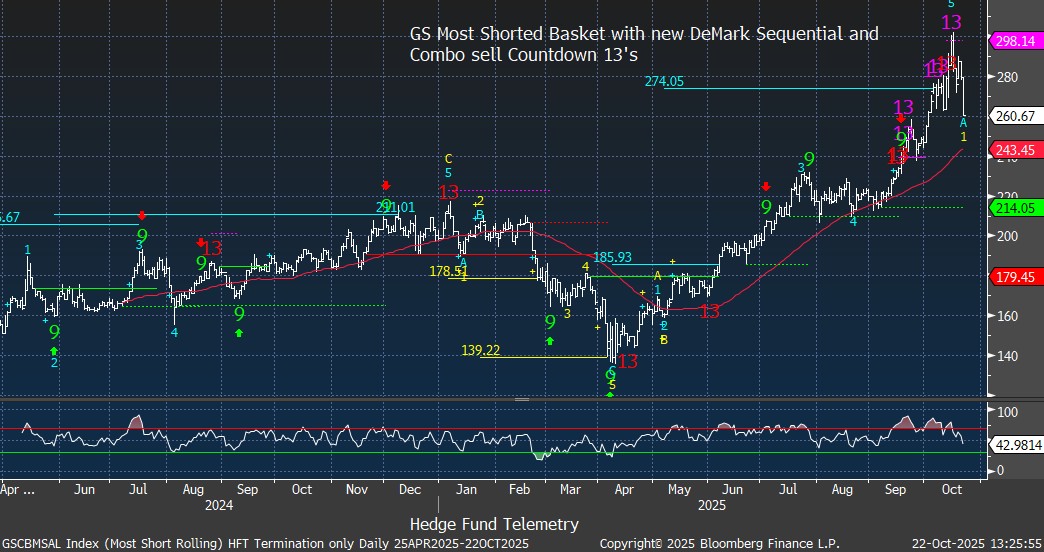
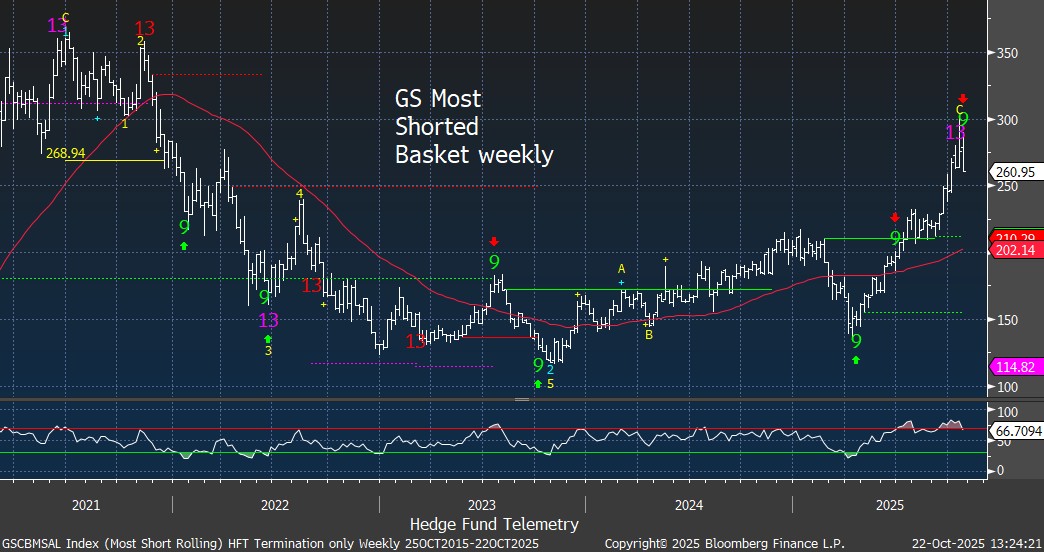
GS most shorted tech basket daily chart is down about 9% today and well off the recent high with the Sequential 13

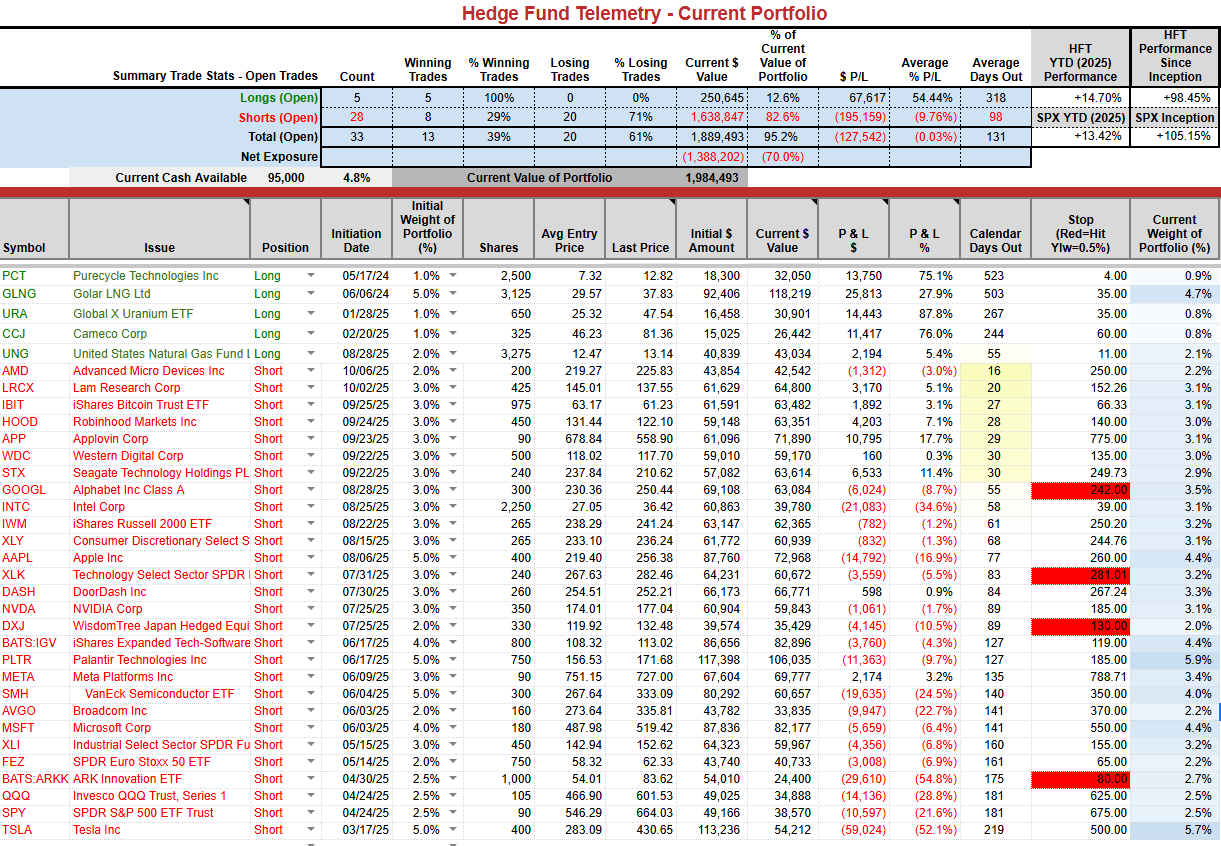
Current Portfolio
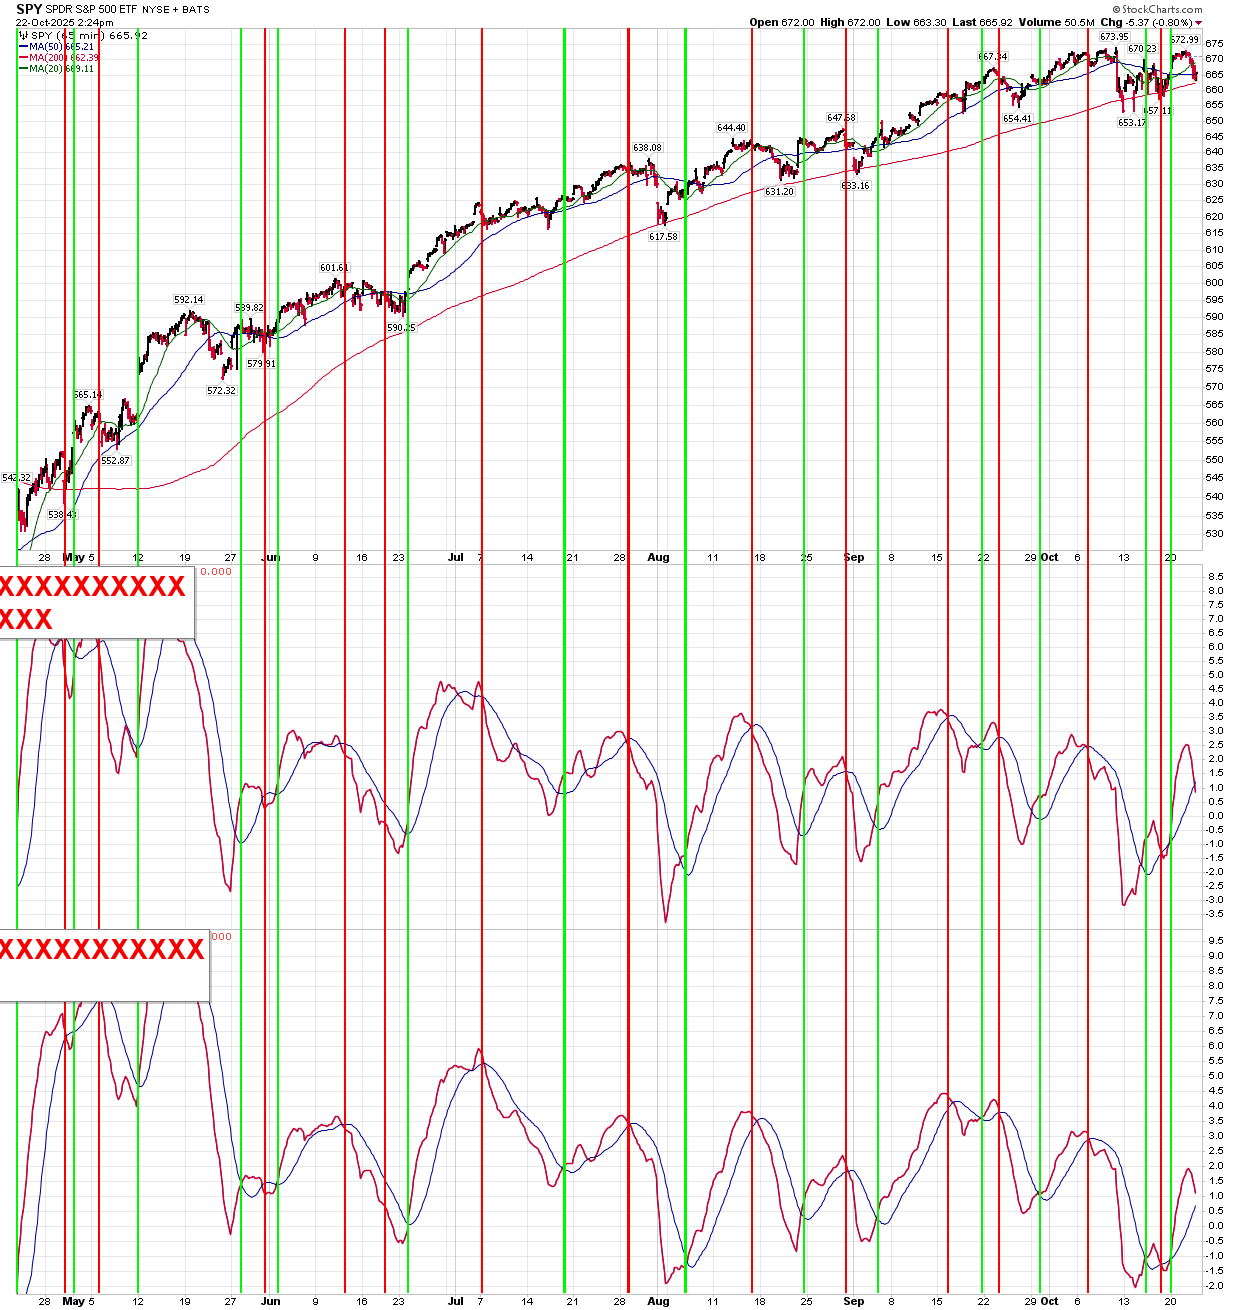
The short term SPY and QQQ momentum indicators are nearly both back to sell with the longer term indicator getting closer. One thing to note is this has held the red line although it’s testing it again. There have been several attempts lower on SPY and we should watch the 655 level as the breakdown level for something more than a short term blip.
Dow earnings preview
DOW (Dow) FQ3 earnings preview (reports Thursday 10/23 before the US open) – the Berkshire/OxyChem deal provided a tiny boost to sentiment, but sentiment is still extremely gloomy on commodity chemical companies given structural oversupply conditions and tepid demand. For FQ3, the Street is looking for sales -5.25% to $10.3B with EBITDA -44% to $771MM and free cash flow of ~$670MM. Thanks, Vital Knowledge, for the color.
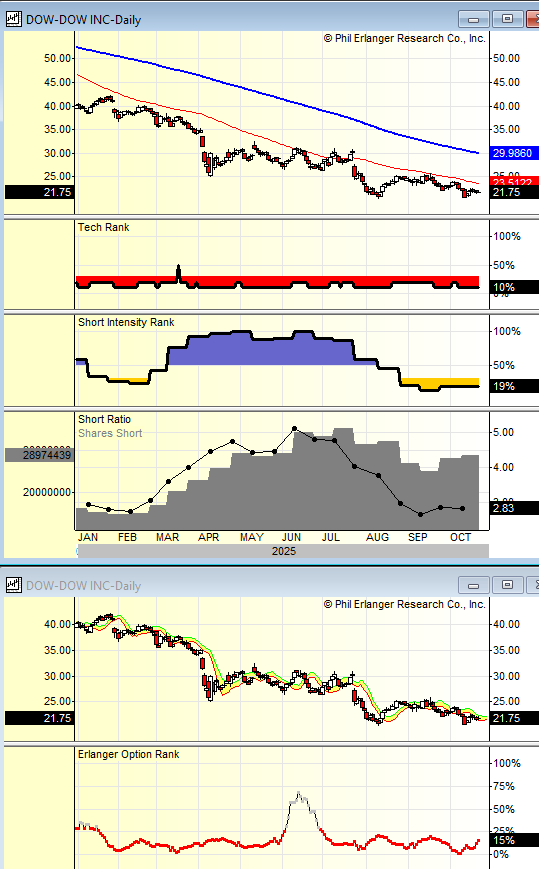
DOW reports tomorrow morning, and it was a loser the last time we tried this ahead of earnings. Having them cut the dividend was a suprise with a lot of funds hitting the red button. The cost basis wasn’t terrible since this was over 60 not so long ago. When I bought this I thought it might attract some activist or even Berkshire taking a look as they like chemicals. It’s trading at or just below book value. The sector is very much out of favor and I’d rather wait and see and buy this on an upswing in profit outlook which might take a quarter or two.
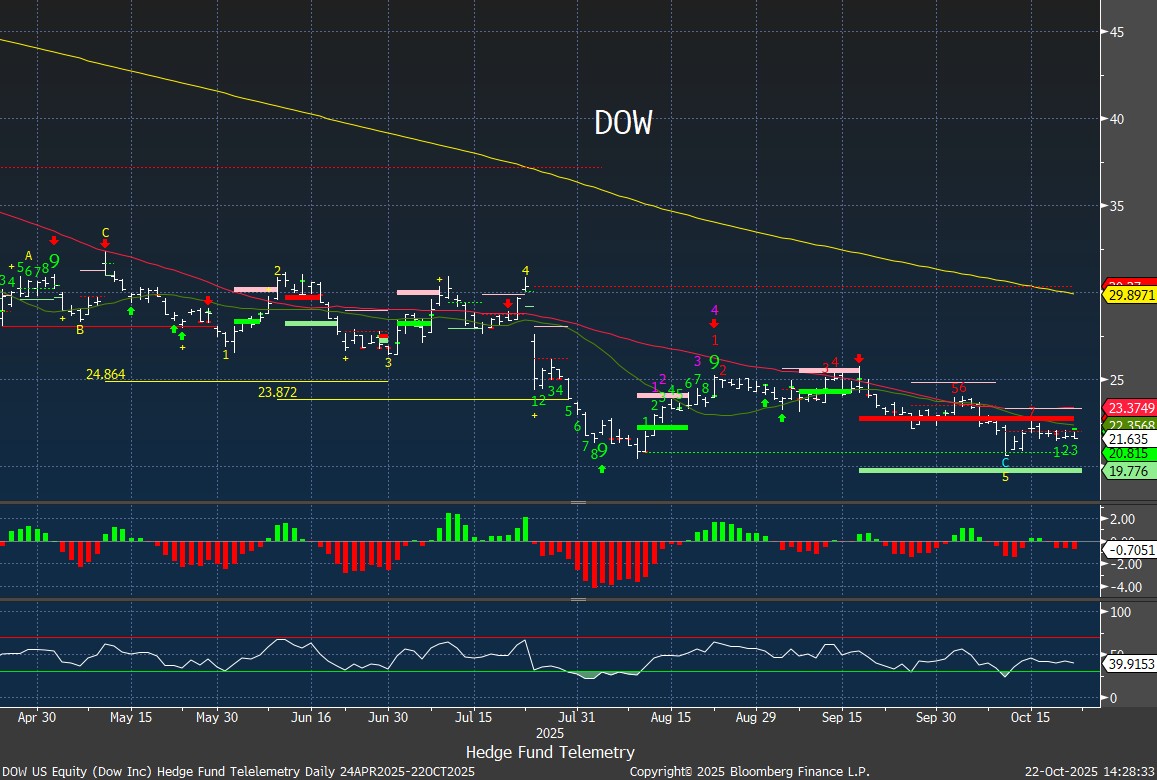
The implied move is 7% which is rarely moves much but last quarter was a disaster
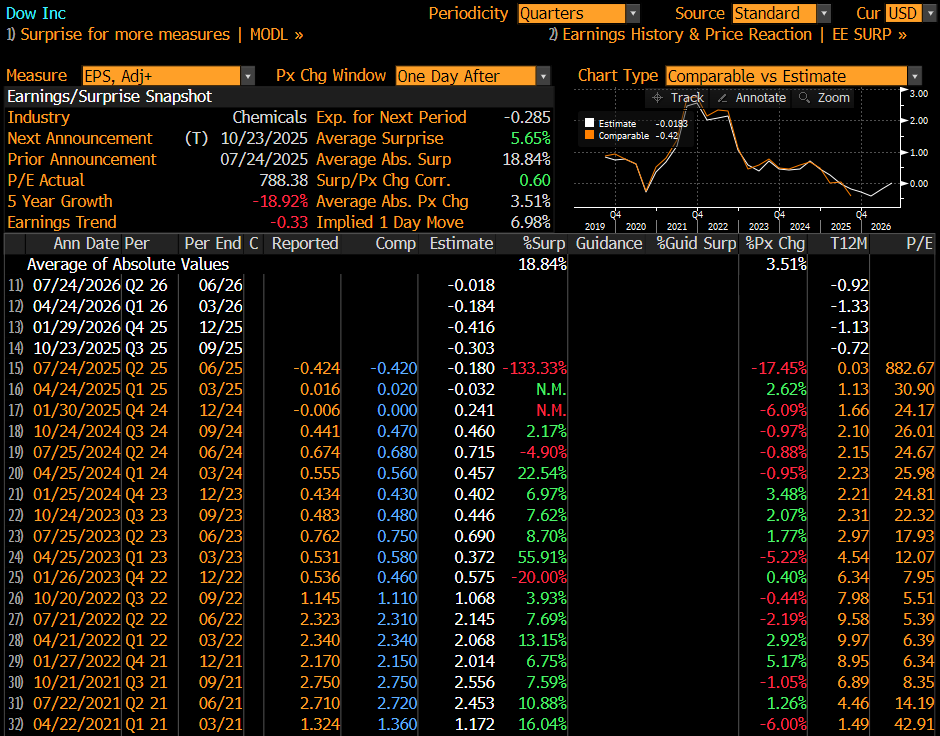
Short interest remains relatively steady with 2.8 days to cover. On the Options Rank there has been also steady call buying with the red dots. I don’t see a short squeeze happening but I thought that might happen last quarter and it was a mess.
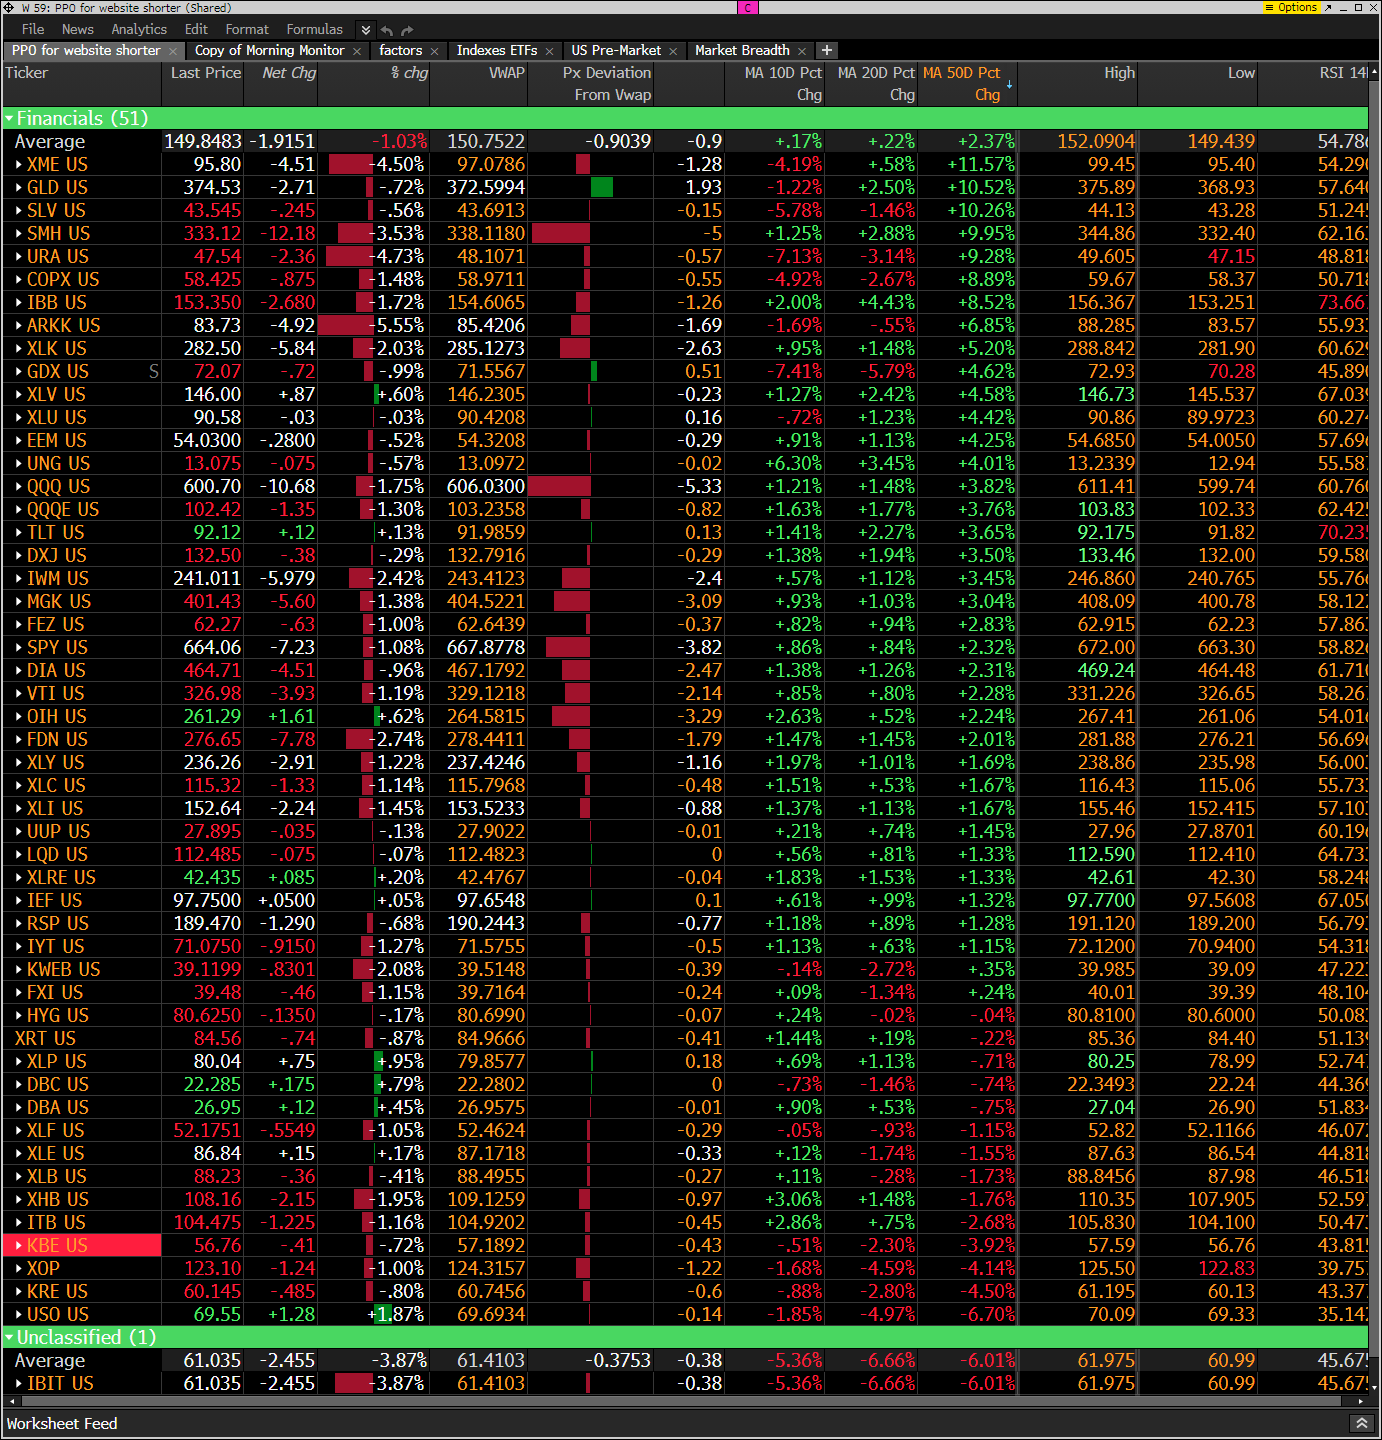
Hedge Fund Telemetry ETF Percentage Price Oscillator Monitor
The PPO monitor (percentage price oscillator) force ranks ETFs by percentage above/below the 50-day moving average. This monitor and others are offered to Hedge Fund Telemetry subscribers on Bloomberg. Most ETFs are lower with some defensive ETFs holding up OK
Index ETF and select factor performance
ETF with today’s performance with 5-day, 1-month, and 1-year rolling performance YTD. Energy and defensive ETFs leading with most shorted and unprofitable tech ETF ARKK down hardest
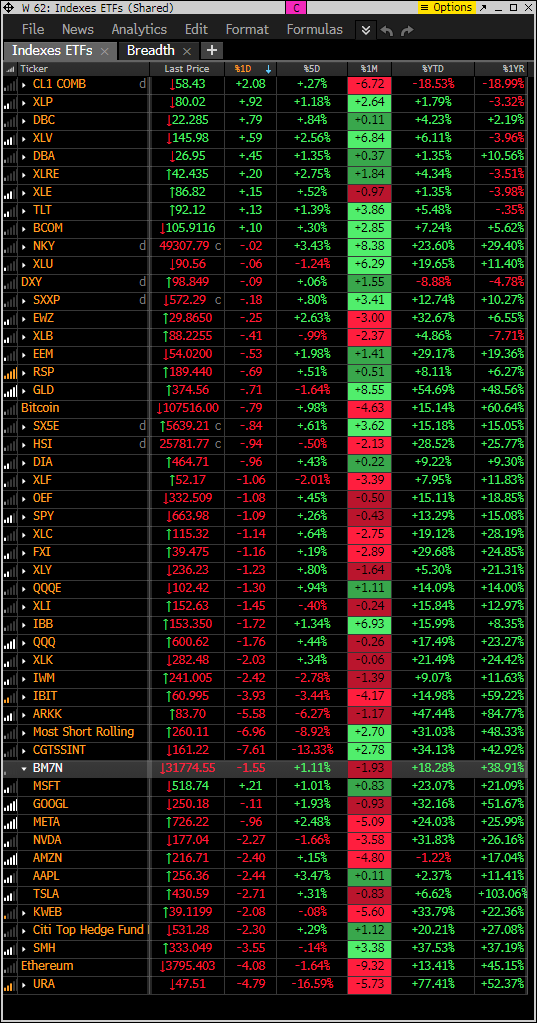
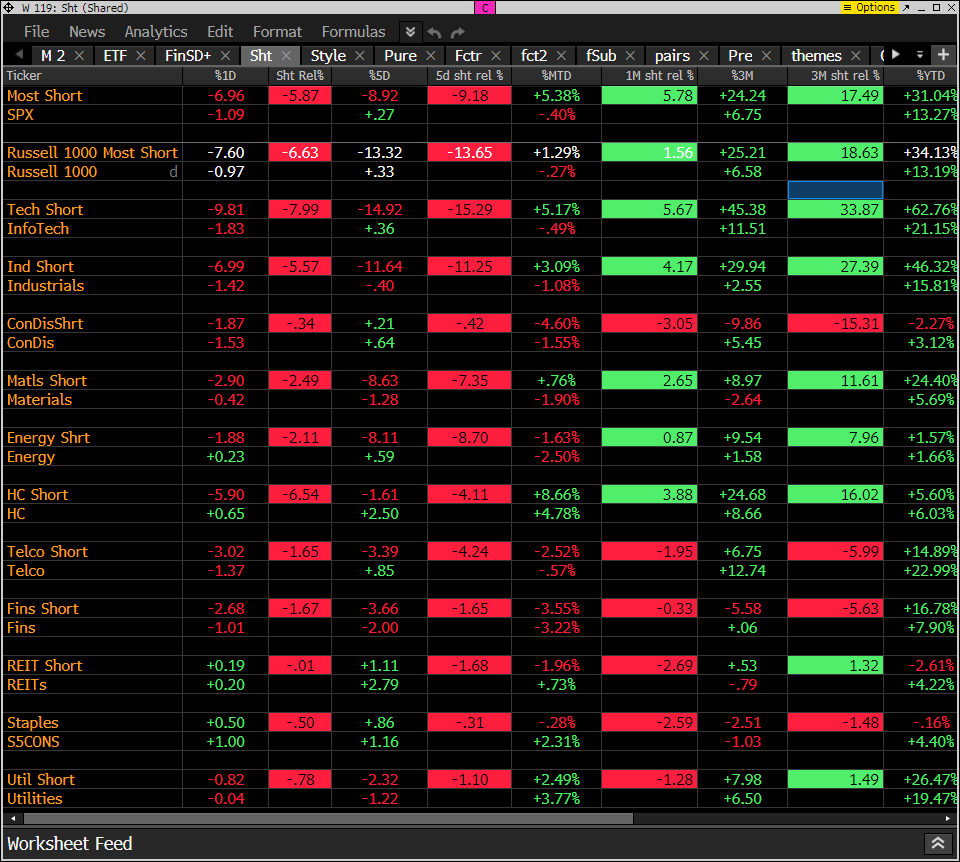
Goldman Sachs Most Shorted baskets vs. S&P Indexes
This monitor has the S&P indexes and the Goldman Sachs most shorted baskets. Short baskets are down hard as shown above.
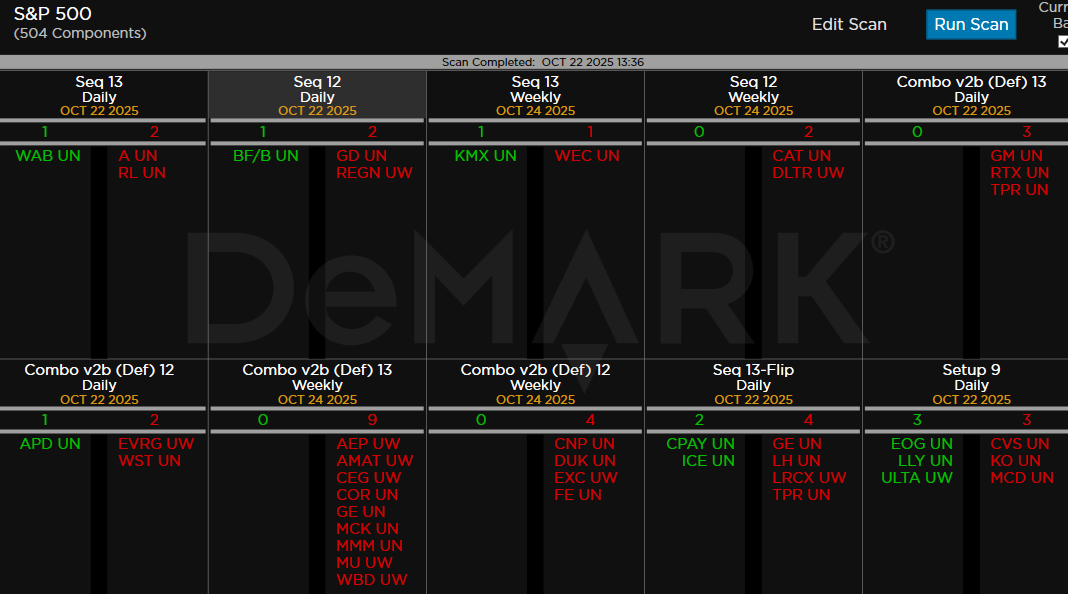
DeMark Observations
Within the S&P 500, the DeMark Sequential and Combo Countdown 13s and 12/13s on daily and weekly periods. Green = buy Setups/Countdowns, Red = sell Setups/Countdowns. Price flips are helpful to see reversals up (green) and down (red) for idea generation. The extra letters at the end of the symbols are just a Bloomberg thing. Worth noting: A few price flips down to watch GE, LRCX – reporting today after the bell. GM and RTX with Combo 13’s after yesterday’s pop after earnings.
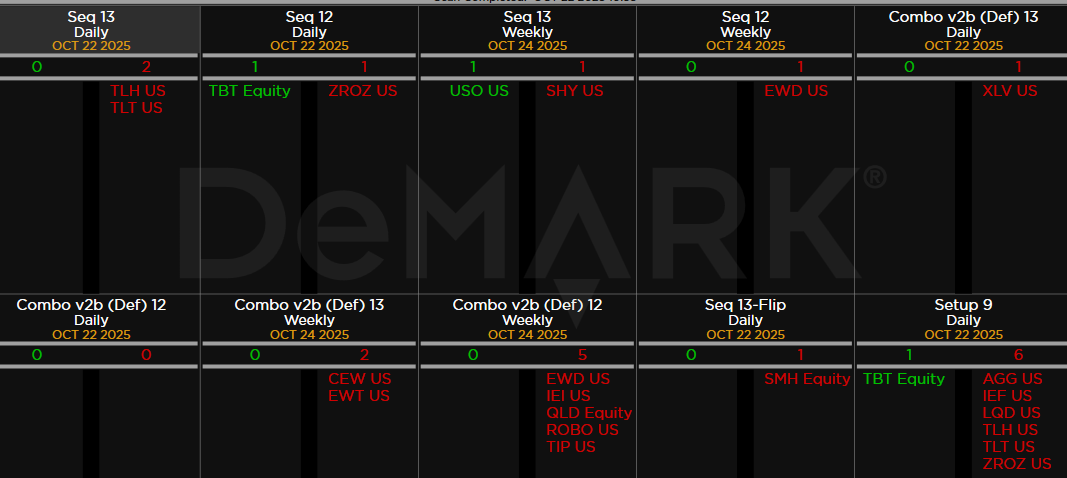
Major ETFs among a 160+ ETF universe. TLT with Sequential 13 – Combo has a few more days to get the 13 – worth noting.
If you have any questions or comments, please email us. Data sources: Bloomberg, DeMark Analytics, Goldman Sachs, Street Account, Vital Knowledge, Daily Sentiment Index, and Erlanger Research