
API this week reported a bigger than expected draw of -5.147M, so when EIA reported a build of 4.278M, the initial reaction of the market was slightly south by 76 cents. It is important to note that API is a voluntary query from a trade association, whereas, EIA is mandatory reporting to the government, why there are often discrepancies. That said, aside from the surprise build, we are only 6% above the 5-year average, which is a marked improvement from earlier in the year. Once again we had a very large distillate draw, which has been the laggard inventory. We also had a nice gasoline draw, and even though refinery utilization was slightly lower than last week, mostly due to refinery repairs, the drawdown was much larger than the utilization reduction. Gasoline inventories are only 3% above the 5yr average in a depressed environment, which is very positive. Refiners are in a really good position into the spring. They have been the adults in the oil market by taking it on the chin and running at 75%. Product draws are always a good sign in gauging the health of the market.
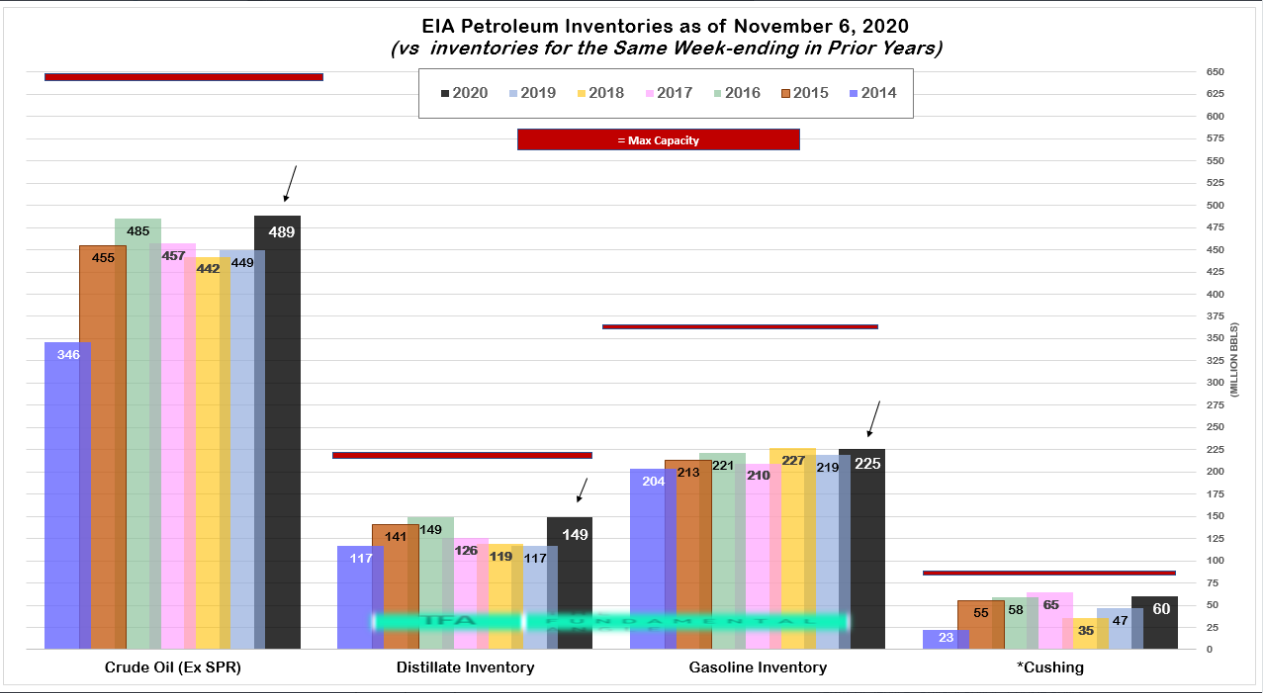
EIA Inventories for the same week Ending in Prior Years
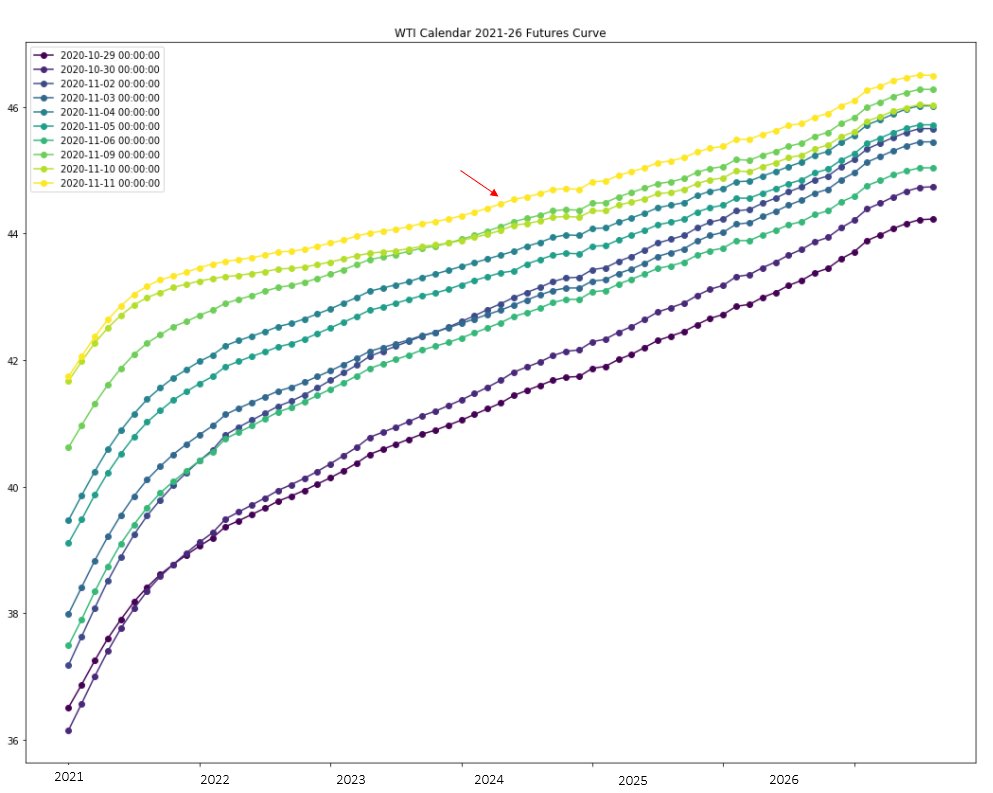
The futures curve has markedly improved over the last two weeks
EIA
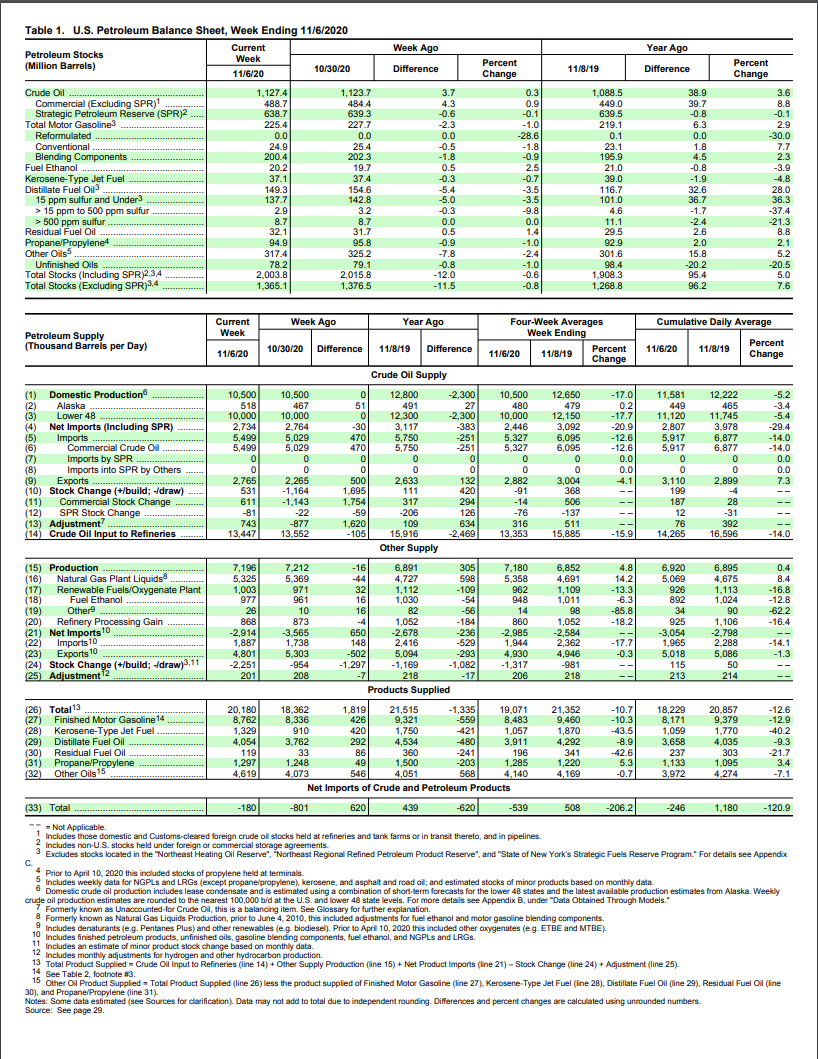
U.S. crude oil refinery inputs averaged 13.4 million barrels per day during the week ending
November 6, 2020, which was 105,000 barrels per day less than the previous week’s average.
Refineries operated at 74.5% of their operable capacity last week. Gasoline production increased
last week, averaging 9.3 million barrels per day. Distillate fuel production decreased last week,
averaging 4.2 million barrels per day.
U.S. crude oil imports averaged 5.5 million barrels per day last week, up by 470,000 barrels per
day from the previous week. Over the past four weeks, crude oil imports averaged about 5.3
million barrels per day, 12.6% less than the same four-week period last year. Total motor
gasoline imports (including both finished gasoline and gasoline blending components) last week
averaged 450,000 barrels per day, and distillate fuel imports averaged 131,000 barrels per day.
U.S. commercial crude oil inventories (excluding those in the Strategic Petroleum Reserve)
increased by 4.3 million barrels from the previous week. At 488.7 million barrels, U.S. crude oil
inventories are about 6% above the five year average for this time of year. Total motor gasoline
inventories decreased by 2.3 million barrels last week and are about 3% above the five-year
average for this time of year. Finished gasoline and blending components inventories both
decreased last week. Distillate fuel inventories decreased by 5.4 million barrels last week and are
about 15% above the five-year average for this time of year. Propane/propylene inventories
decreased by 0.9 million barrels last week and are about 7% above the five-year average for this
time of year. Total commercial petroleum inventories decreased by 11.5 million barrels last
week.
Total products supplied over the last four-week period averaged 19.1 million barrels a day, down
by 10.7% from the same period last year. Over the past four weeks, motor gasoline product
supplied averaged 8.5 million barrels a day, down by 10.3% from the same period last year.
Distillate fuel product supplied averaged 3.9 million barrels a day over the past four weeks,
down by 8.9% from the same period last year. Jet fuel product supplied was down 43.5%
compared with the same four-week period last year.
EIA DETAILS
LINK TO FULL REPORT HERE